Relative Utility Approach
Hi Everyone,
Note: Relative utility in the context of this post refers to a relative utility approach, which compares utility obtained from goods, services, and activities in respect to each other. Relative utility can also be defined as utility influenced by the actions and behaviour of others.
I often write about utility, as I believe it to be one of the most important economic concepts. In my previous posts, I have covered utility and choice in my video, ‘Economics Basics - Utility and Choice’. I covered utility in general in my post, ‘Economic Concepts #1 – Utility’. I covered marginal utility in my post, ‘Economic Concepts #10 – Marginal Utility’. I covered indifference curves in my post, ‘Economic Concepts #7- Indifference Curves’. If you do not have a firm understanding of utility, I would strongly recommend that you read the above-mentioned posts.
In today’s post, I want to discuss relative utility. One of the biggest problems with most approaches to utility is that utility cannot be compared between different individuals. Utility does not have a universally accepted metric that can be applied to everyone. Utils have been described as a measure for utility. However, ‘utils’ are not a standard measure that can be used to compare utility between different people. I believe the best existing solution is to adopt a relative utility approach. This approach applies elements from both ‘Ordinal Utility’ and ‘Cardinal Utility’.
Ordinal Utility
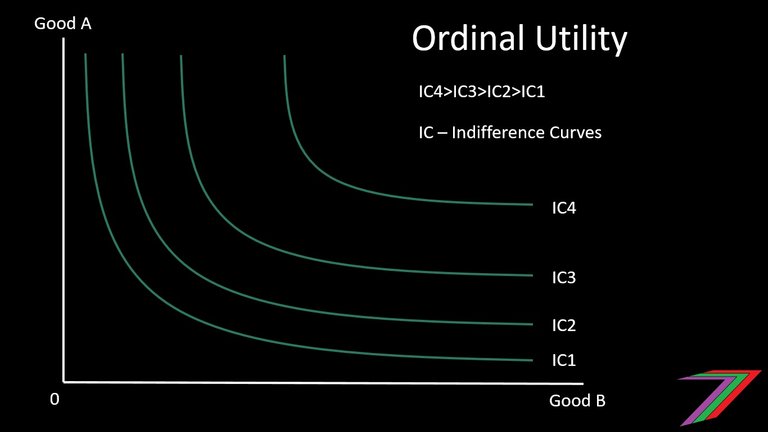
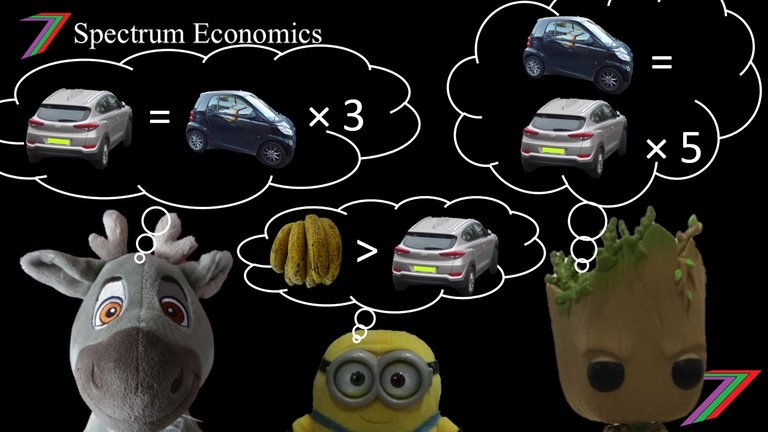
The ordinal utility approach ranks goods, services, and activities based on preference. The ordinal utility approach does not consider how much a person enjoys something or how much more that person enjoys one option over another. For example, Ben has five fruit: a banana, an orange, an apple, a mango, and a pineapple. Ben could rank these fruit accordingly.
- Banana
- Pineapple
- Mango
- Orange
- Apple
The above ranking shows the order of preference. It does not tell us if Ben likes all five fruit, dislikes all five fruit or likes just the few highest ranked fruit. James could rank the same fruit in the exact same order. If James is a fruit lover, it is possible that James likes apples more than Ben likes mangos, even though Ben ranks mangos third and James ranks apples fifth.
Cardinal Utility

Another possible approach is cardinal utility. For cardinal utility, values are assigned to goods, services, and activities. These values are measured in ‘Utils’. Utils can be used to demonstrate how much a person likes one thing over another. Let us revisit our example of Ben and his five fruit. Ben could assign the fruit the following values in ‘utils’
- A banana provides 120 utils
- A pineapple provides 100 utils
- A mango provides 60 utils
- An orange provides 20 utils
- An apple provides 10 util
Providing a value in ‘utils’ demonstrates the extent that Ben prefers a particular fruit to another. The cardinal utility approach appears superior to the ordinal utility approach. The biggest problem with the cardinal utility approach is that ‘utils’ are not a standard metric. A ‘util’ does not have the same meaning to me as it does to anybody else. Therefore, different people’s utility cannot be compared. James could assign the following ‘util’ values to his fruit.
- A banana provides 30 utils
- A pineapple provides 27 utils
- A mango provides 24 utils
- An orange provides 18 utils
- An apple provides 12 util
Just comparing the fruit in terms of ‘utils’ would give the impression that Ben likes bananas, pineapples, mangos, and oranges more than James. Comparing the values in ‘utils’ would indicate that Ben likes mangos four times more than James. However, this is unlikely to be the case. It is possible that James considers ‘30’ to be a very high value. Whereas, Ben considers ‘30’ to be a low value. If ‘utils’ could be established as a standard metric, comparisons between different individuals would be possible. Unfortunately, this is unlikely to be possible. Unlike many metrics, ‘utils’ cannot be observed; they represent the intrinsic value we assign to something. For example, a kilometre can be objectively measured and observed by all. The enjoyment (i.e. utility) a person obtains from a chocolate ice-cream is only known to the person eating it.
Price solution
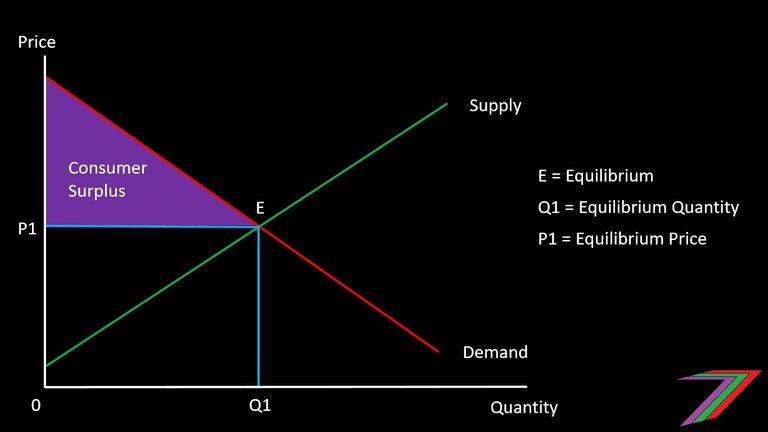
What can be observed is what people pay to obtain something. If a banana is sold for $0.50, we can assume that all those that bought the banana at $0.50, value the banana at least at $0.50. The price does not tell us how many people value the banana at $1.00 or $2.00. We cannot even assume that those people that did not buy the banana at $0.50 actually value the banana less than $0.50. It is possible someone bought an orange at $0.50 instead. They might value the orange at $1.00 and the banana at only $0.60 (still higher than $0.50); the orange is bought instead of the banana because it provides the buyer with a higher consumer surplus. Consumer surplus is the difference between what someone is willing and able to pay and what he or she actually pays. In my post, ‘Economic Concepts #14 – Price Discrimination’, I describe consumer surplus and how it can be partially determined and captured.
Money is sometimes used as a proxy metric for utility. As the amount of money that someone has increases, the greater utility they should be able to enjoy. This approach only provides a rough indication of utility, as utility increases with monetary wealth at a decreasing rate.
Figure 1: Relationship between Utility and Wealth
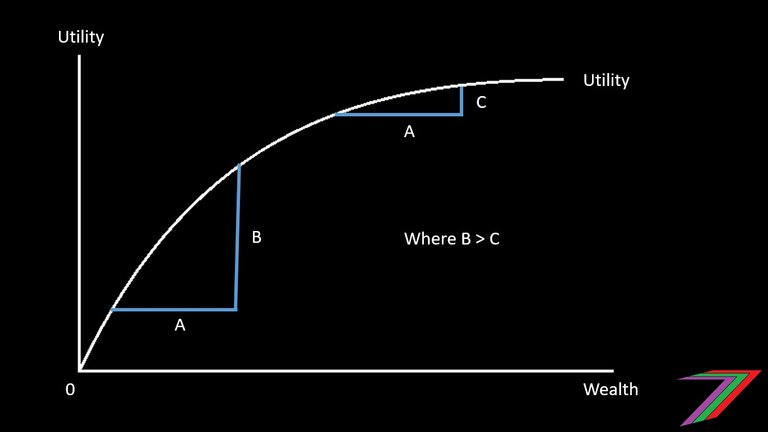
Wealth is also not the only factor that determines utility. The environment we live and work in, the people we interact with, the amount of freedom we have, the amount of security we have, and our health impact our level of satisfaction in life.
Relative Utility Approach
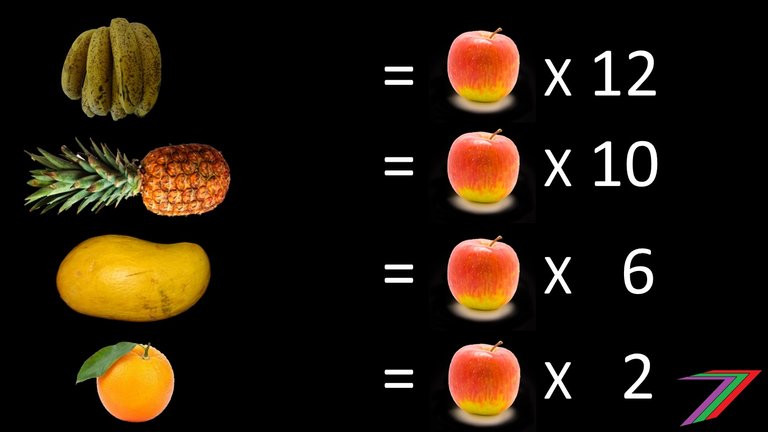
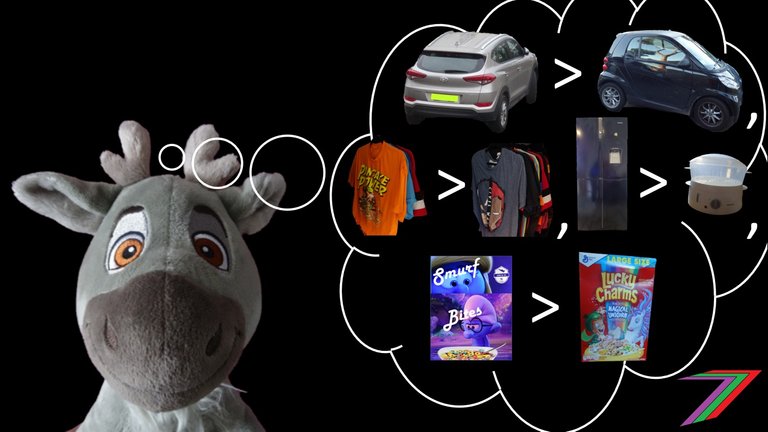
The relative utility approach aims to make it possible to make comparisons between different people without needing to have a standard metric to compare utility. Cardinal utility approach assigns ‘utils’ to utility. The ‘utils’ indicate the extent that someone prefers one thing to another. This measure of extent can be used to compare different goods, services, and activities. Let us revisit Ben and James’ preferences in respect to apples based on what we know so far.
Ben’s preferences
- A banana provides Ben 12 times the satisfaction of an apple
- A pineapple provides Ben 10 times the satisfaction of an apple
- A mango provides Ben 6 times the satisfaction of an apple
- An orange provides Ben 2 times the satisfaction of an apple
James’ preferences
- A banana provides James 2.5 times (30/12) the satisfaction of an apple
- A pineapple provides James 2.25 times (27/12) the satisfaction of an apple
- A mango provides James 2 times (24/12) the satisfaction of an apple
- An orange provides James 1.5 times (18/12) the satisfaction of an apple
With the information given above, we can start to make some comparisons between Ben’s and James’ preferences. Ben has a much stronger preference for bananas to apples (12) than James (2.5). Ben has a slightly stronger preference for bananas to pineapples (12/10=1.2) than James (2.5/2.25=1.111). In the context of just fruit, this does not have significant meaning. However, we can expand the preference comparison to other things. For example, a pancake might provide Ben with 3 times the satisfaction of a banana. A banana might provide James with 3 times the satisfaction of a pancake. As more comparisons are made, we can begin to establish a comparison between Ben’s and James’s preferences for fruit as a whole. If we observe that Ben is consistently viewing the consumption of fruit as less favourable to other things and James is not, we will be able to conclude that James gains more utility from fruit than Ben.
My application of relative utility
I believe there are many useful applications of the relative utility approach. I have applied the relative utility approach in my own work and research. In this post, I will describe two occasions I have applied relative utility to enhance my analysis.
My Master’s Thesis
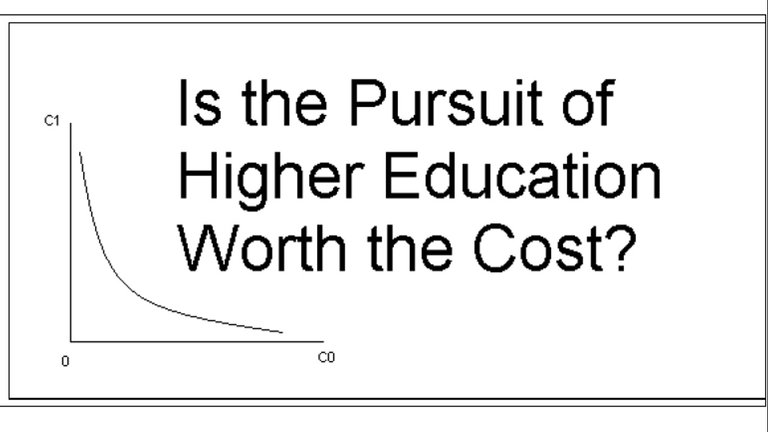
A large portion of my Master’s thesis explored utility in an intertemporal choice model. An intertemporal choice model assesses choices over time. I used the intertemporal choice model to analyse the decision to pursue higher education. Most of the existing work in this field compared income earned from holding a form of higher education to income earned from not holding a form of higher education. These comparisons considered income forgone during the study period and the higher income obtained from a degree after the study period. Future income flows were discounted to account for the cost of forgoing immediate income.
My Master’s thesis took the above approach a step further by comparing utility from pursuing a higher education to not pursuing one. Utility was considered in terms of consumption rather than income. However, I encountered the problem of comparing utility amongst different people. Therefore, I adopted the relative utility approach. I calculated the utility for various groups of people with different combinations of time preferences, wealth, backgrounds, risk aversion and several other factors. I compared the utility obtained from pursuing a higher education to that of not pursuing a higher education and presented that as a ratio. I compared this ratio between the different groups to determine which groups with which characteristics would be better off by pursuing a higher education.
Social Economic Utility Analysis
My recent work relating to Social Economic Utility Analysis also applies relative utility. I have developed/developing an algorithm to calculate utility based on a number of different factors. These factors include.
- Income
- Working hours
- Wealth
- Work related activities
- Non-work related activities
- Time consumption
- Externalities
- Social environment
- Natural environment
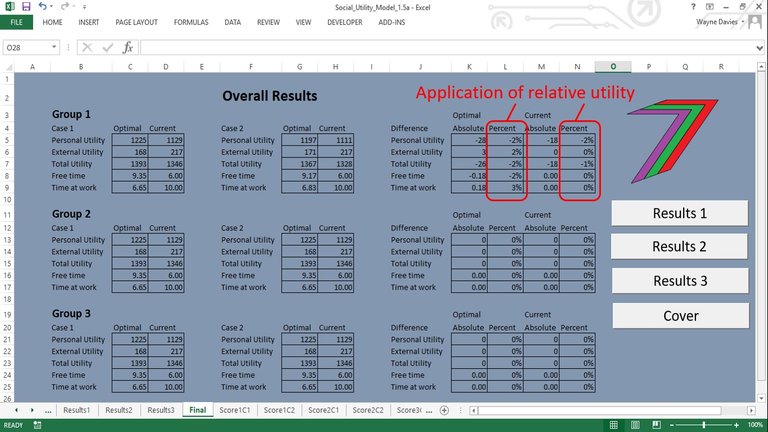
The algorithm is calculated and presented in a Microsoft Excel-based model. The model compares two cases. An existing case (base case) and a case where one or several factors have changed. The utility is calculated for both cases and these values are compared. The results are presented as a change in utility (Utils) and as a percentage change which aligns with the relative utility approach. The model can be used to compare three groups of people to determine which groups benefit the most from particular changes. If there are more than three groups, data can be entered into copies of the model and the results can be combined into a spreadsheet. I describe this model and algorithm in more detail in the following posts.
Social Economic Utility Analysis (working title) Algorithms
Social Economic Utility Analysis (working title) Model
Social Economic Utility Analysis Model (Video)
Summary
Relative utility enables easier comparison of utility obtained by different people without necessarily stating or establishing a universally accepted metric. For relative utility to be an effective approach for comparing utility between different people, data regarding preferences is still required. This can be obtained by observing behaviour and/or from people’s responses to surveys, questionnaires, and interviews. This process could be time consuming and expensive depending on the nature of the data required.
Based on my experience, I do not believe relative utility, as defined in this post, is frequently applied to analysis. This is a shame, as utility is a core theory in economics. To be able to compare utility between different individuals or even groups of people can be exceedingly useful. I have certainly found this to be the case with the work and research I have done.
More posts

If you want to read any of my other posts, you can click on the links below. These links will lead you to posts containing my collection of works. These posts will be updated frequently.


New Economics Udemy Course
I have launched my first Udemy course ‘Economics is for Everyone’. The course focuses on how economics affects everyday people, the decisions they make and how they interact with the world around them. The course contains 24 video lectures (about 4 hours of viewing), 64 multiple-choice questions (3 at the end of most lectures), 32 downloadable resources (presentation slides, additional notes and links to relevant Steem posts), and 2 scenario questions. The course is currently free-of-charge. Click the link above to access the course.


Steem - The Future of DApps

Fascinating. So much of it is self-evident when explained. (yes I realise that's something of an oxymoron)
Yeah, thanks.
Posted using Partiko Android
Hi, @spectrumecons!
You just got a 1.04% upvote from SteemPlus!
To get higher upvotes, earn more SteemPlus Points (SPP). On your Steemit wallet, check your SPP balance and click on "How to earn SPP?" to find out all the ways to earn.
If you're not using SteemPlus yet, please check our last posts in here to see the many ways in which SteemPlus can improve your Steem experience on Steemit and Busy.
Wow, all that work to avoid prices. And at the end of the day, it doesn't seem like relative utility itself has a higher relative utility than just plain old traditional price tags.
If markets can operate freely, price mechanisms can provide useful information regarding preferences. Prices are often distorted by tax, subsidies, and monopoly power.
There are also many things that are not captured particularly well by the market, such as externalities.
Posted using Partiko Android
Yes, I agree that prices do not capture everything. And they are most certainly distorted by the things you mention. But ideally, this just creates opportunity for people who have innovative models and a long time horizon.
I'm not sure if a structured metric like relative utility can be accurately applied, say hypothetically, in an unencumbered economy where speculators are free to explore different time horizons.
This is some of the best posts I've seen on STEEM in the recent times. Found you thanks to @crypto.piotr Awesome work! Keepi it up :)
Thanks @d-zero.
Thanks for sharing this very interesting post today great to look into something different : )
Hey no problem. I like to explore different areas of economics and sometimes dive deeper into certain areas.
Hi @spectrumecons!
Your post was upvoted by @steem-ua, new Steem dApp, using UserAuthority for algorithmic post curation!
Your UA account score is currently 4.764 which ranks you at #1519 across all Steem accounts.
Your rank has improved 1 places in the last three days (old rank 1520).
In our last Algorithmic Curation Round, consisting of 267 contributions, your post is ranked at #40.
Evaluation of your UA score:
Feel free to join our @steem-ua Discord server
This post has been voted on by the SteemSTEM curation team and voting trail. It is elligible for support from @curie.
If you appreciate the work we are doing, then consider supporting our witness stem.witness. Additional witness support to the curie witness would be appreciated as well.
For additional information please join us on the SteemSTEM discord and to get to know the rest of the community!
Please consider setting @steemstem as a beneficiary to your post to get a stronger support.
Please consider using the steemstem.io app to get a stronger support.
Hi @spectrumecons, good content that you just shared. I recommend placing references in your next installment so that readers can get more information about this!
Yeah sure, no problem.
I find this interesting as it ties to some thoughts I have relating to economics' relationship to psychology. Specifically, I see economics as a branch of psychology.
Furthermore, I see very limited potential to economics' predictive capacity, except for when it's merely directly measuring something, say like a food thermometer stuck into a chicken breast: it's not so much a prediction as a reading. And as you say "data regarding preferences is still required" - basically you're taking people's preferences as input and then outputting a graph, but people's preferences might change and you can't predict that with economics, but you might be able to do so with some more overarching psychological approach or theory regarding human nature or specific aspects of it.
Economics crosses over into many other fields. Psychology being a big overlap when we look at behavioural economics.
Economics often relies on historical data or past behaviour to predict the future. This is problematic as circumstances, preferences, and environments change. It might be possible to establish patterns of behaviour to predict future behaviour. This is very difficult to do on a larger scale.
Posted using Partiko Android