Spectral lines - playing with light waves
What do you know about spectral lines and why are they so valuable in physics/astrophysics?

the best way to read this post is using steemSTEM.io or steempeak .
Let's start with the basics of Electromagnetic wave (light) - On the photo below is EM spectrum. Depending on the frequency light particle/wave has different energy. We have a c - which is constant, and we have a relation between frequency (ν) and wavelength (λ) c = λν => Let's explain extreme cases:
- Radio waves: big wavelengths - lower frequencies (low energies)
- Gamma Rays: High frequency - very small wavelengths (enormous energies)
Also.... you know that light has dual nature - on the high energy part of the spectrum it is detected more like the particle, while the radio is as we all know - waves. :) and you have never heard about Gamma- waves, its always that gamma particle/ ray.

Visible or optical light is a very small part that our eyes are adapted to see. I bet it has something to do with our Sun, since the peak of the light of Sun is set to 550nm (greenish-yellow colour).

This thing above is spectrograph, which will split white light into "rainbow" colors, something like a sophisticated prism - with a high-resolution camera attached do it.
Now more about light: We have continuum and spectral lines. Continuum is basically all "natural" light produced in the heart fo stars, and then we have spectral lines - which can be:
- Emission spectral lines
- Absorption spectral lines
These lines are showing when the light we are detecting is interacting with something on its way to us, or we have a very specific source that generates light.
When we have a hot source (Star) which goes through a colder gas - we will always have absorption spectral lines, and we can see that on our Sun.
But, if we have a really hot star, and it heats enough of this colder gas, we can see that these gaseous regions start emitting light - The most famous ones are called HII regions (which means ionised hydrogen) - and you probably know the beautiful Orion nebula. Here is WAY more boring image of Krypton light, captured with the LoSpectrograph above.

Do you see the difference between emission and absorption lines?
Image 1> Solar spectrum it has Fraunhofer (absorption lines) while Image 2 is Krypton light from a lamp.
Interesting stuff, isn't it?
Now how this helps astronomers?
We know how all these lines look in the laboratory and we can observe difference for various results:
- Carefuly observing spectral lines we can determine the composition of stars.
- REDSHIFT - when the star moves away from us, its lines are moving more into the red spectrum - so if it is moving very faaaaaast, blue line (which is at 460nm) will be seen in red for example (630nm), there is also blueshift when an object is moving towards us. - REDSHIFT is used to calculate the distance, and speed and a lot more interesting stuff.
- Temperature - depending on the width of the line or specific element that requires strictly determined energy, we can calculate temperatures and Rotation speed from the width of and shape of the lines.
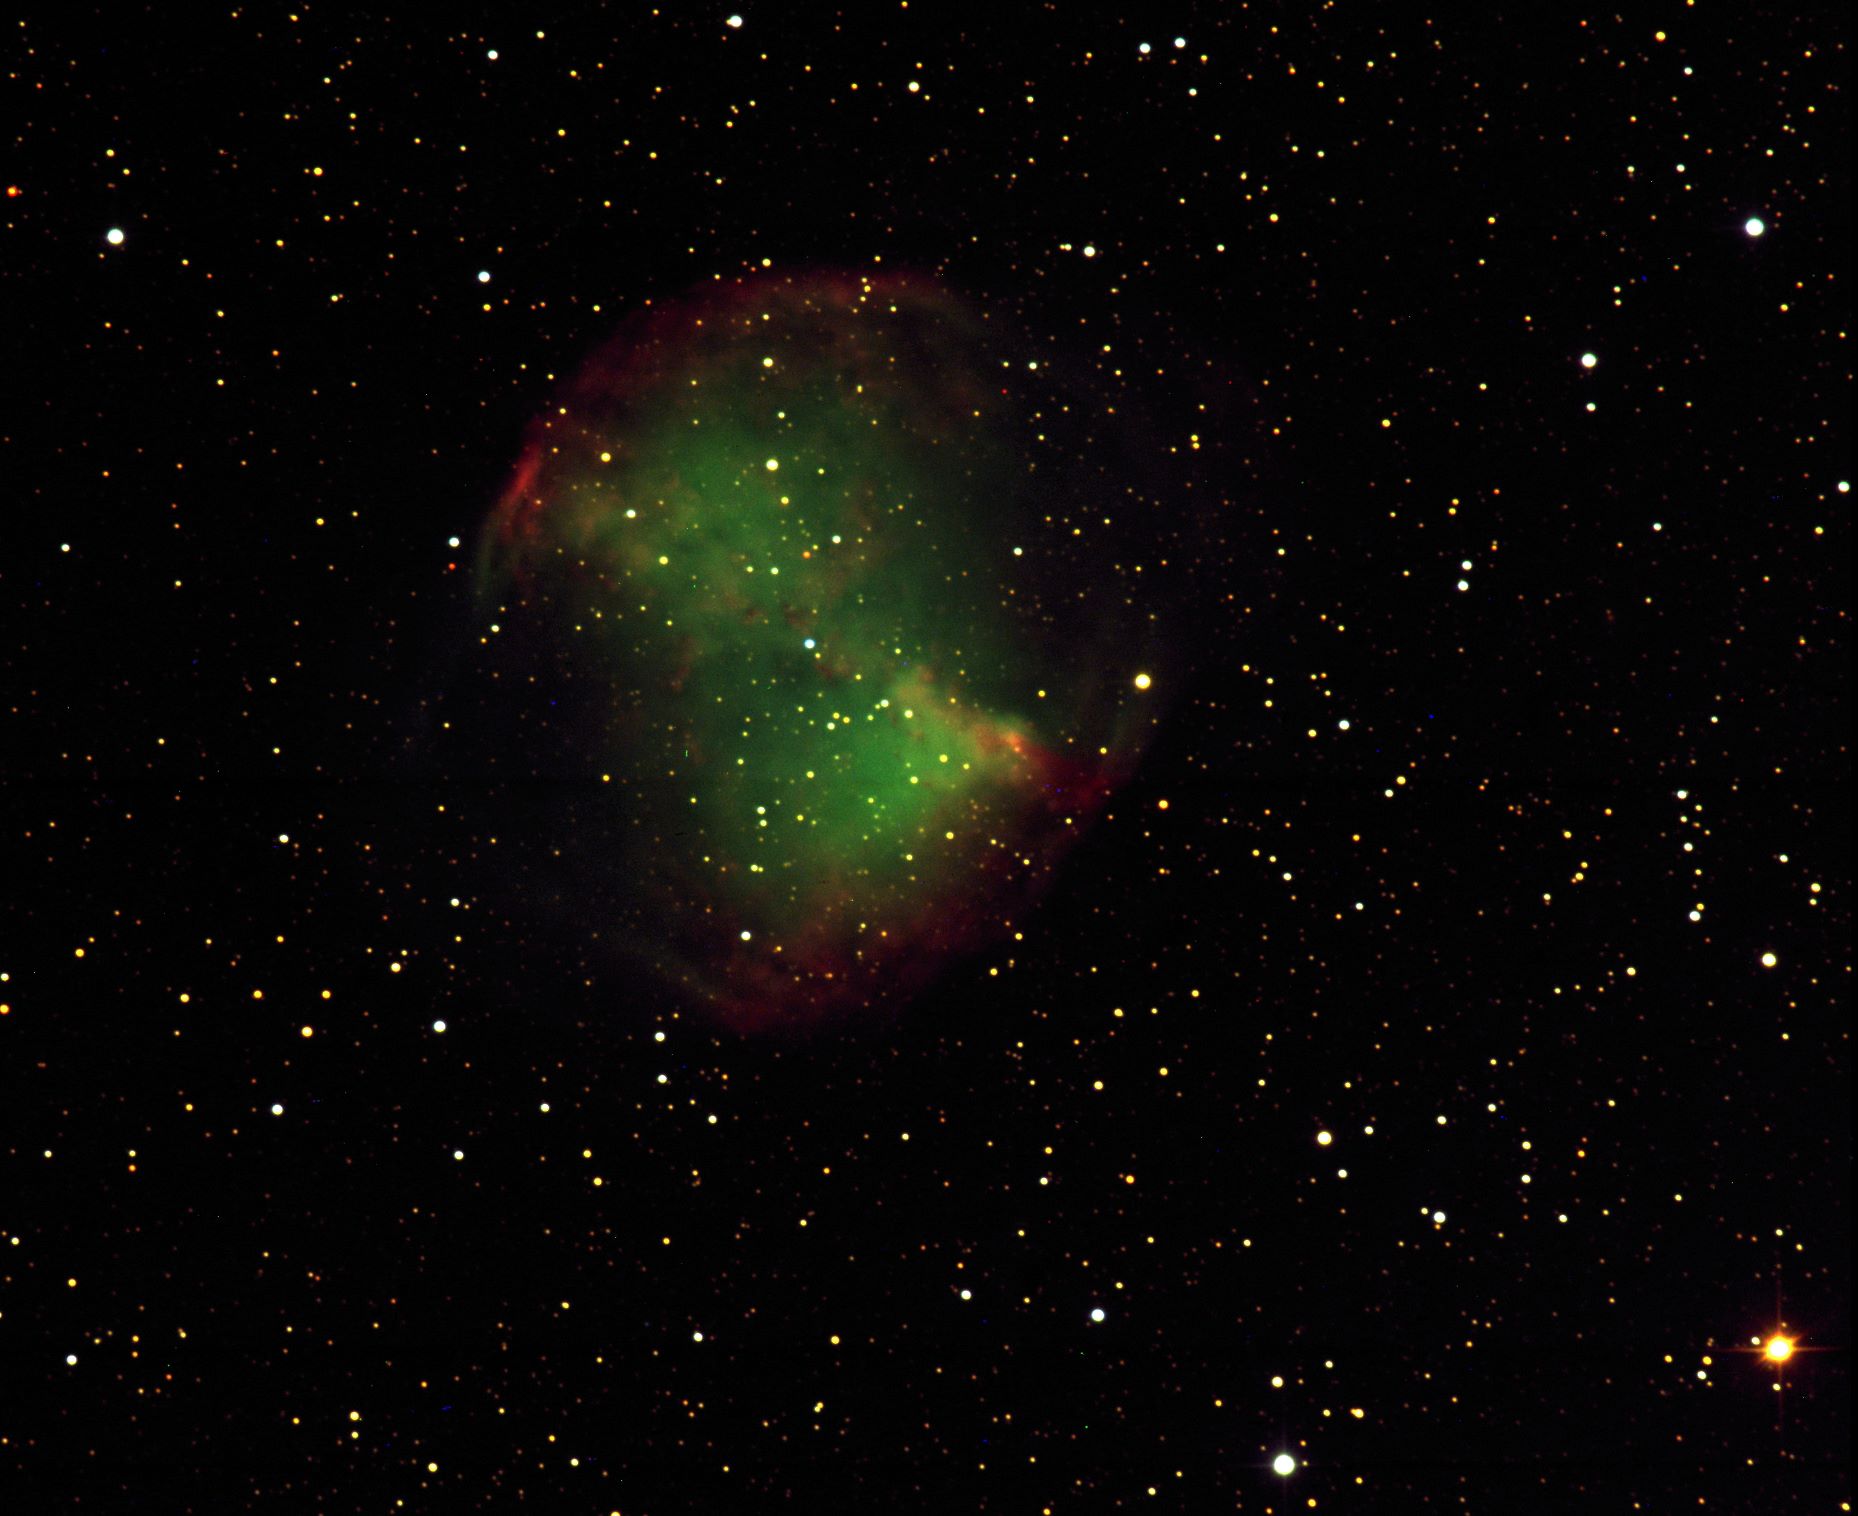
Here is a photo from 60cm telescope, I took some years ago. It is Dumbell nebula which is planetary nebula with green and red emission lines.
If you would like to know more about anything from this - hit up the comments, or ask on discord.
Unless stated otherwise, all photos are mine. ©svemirac

co-founder of crowdmind project and crowdwitness operator
It is very interesting stuff indeed! I remember reading about light waves when I was much younger and thinking it was magic. Still blows my mind the amount of information that can be gathered just from light.
Well it is a magic in a way! :)
The whole astronomy is based on extracting information from light - It's just so awesome! :)
How are spectral lines used to determine composition of stars?
Well... Here is the solar spectrum - much more professional and beautiful than the one I provided.
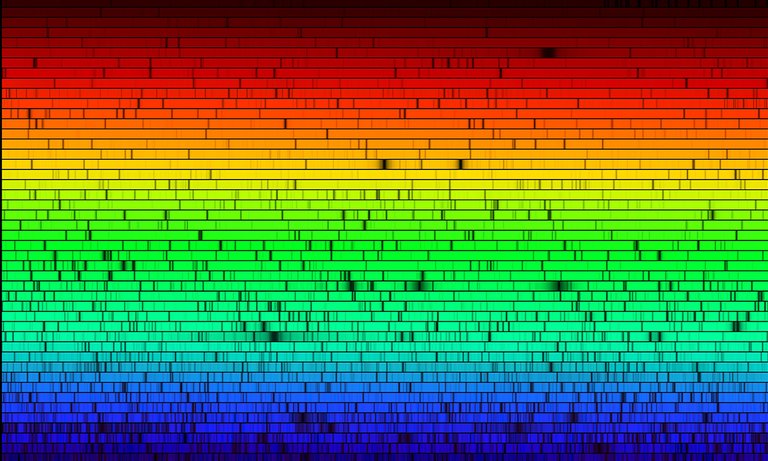
All these black spots, are spectral lines - and you see they happen in different colors.
Now - different color = different energy.
Red - lowest energies, Blue - highest energies.
All elements and atoms can only absorb a photon with specific amount of energy. Meaning - on a wavelength 656.3 nm we have a hydrogen line (Hα) H-alpha. (red color), there is a green line of Iron, K, Mg and stuff.
Also, Helium is found first on the Sun, using spectral lines, and then found on earth, hence the name Helios-Helium. But yeah, we have all the lines of the elements in periodic table - in lots of variations. and simply matching them with the spectra we get (with wavelengths they are), we can say hey... THe sun has IRON (Fe) which is ionized 11 times (misses 11 electrons).
Here is a nice stuff to read on for more info and probably better explanation:
https://www.explainxkcd.com/wiki/index.php/1733:_Solar_Spectrum
If you have more questions shoot :)
I always carry a few of these, in case I need to do a quick spectral analysis on something.
Haha, that is just awesome! Never seen it :)
Me too. This is really cool! :)
How do you separate the different doppler sources when measuring velocity? For example, if an object is traveling toward us, but the object is also experiencing universal expansion, is it possible for the doppler shift to disappear?
Excellent question - short answer: hypothetically yes, but we would know it is cancelled out depending on its distance/environment/companions.
First, we need to divide space into two stages - low redshift and high redshift which can be interpreted as: present time(13.8 by old universe), young universe.
present time = redshift from the expanding of the universe is z=0, as we go back in time redshift grows.
Now, in the local Universe, we can observe stars and all variety of stuff out there while in the high redshift we are bound to galaxies and all sorts of raging formations. The farthest single star that was detected (in 2018) is on redshift z =1.5 (9 billion light-years away.)
Also - another thing that needs to be mentioned - things in space tends to cluster. and here are two images for that
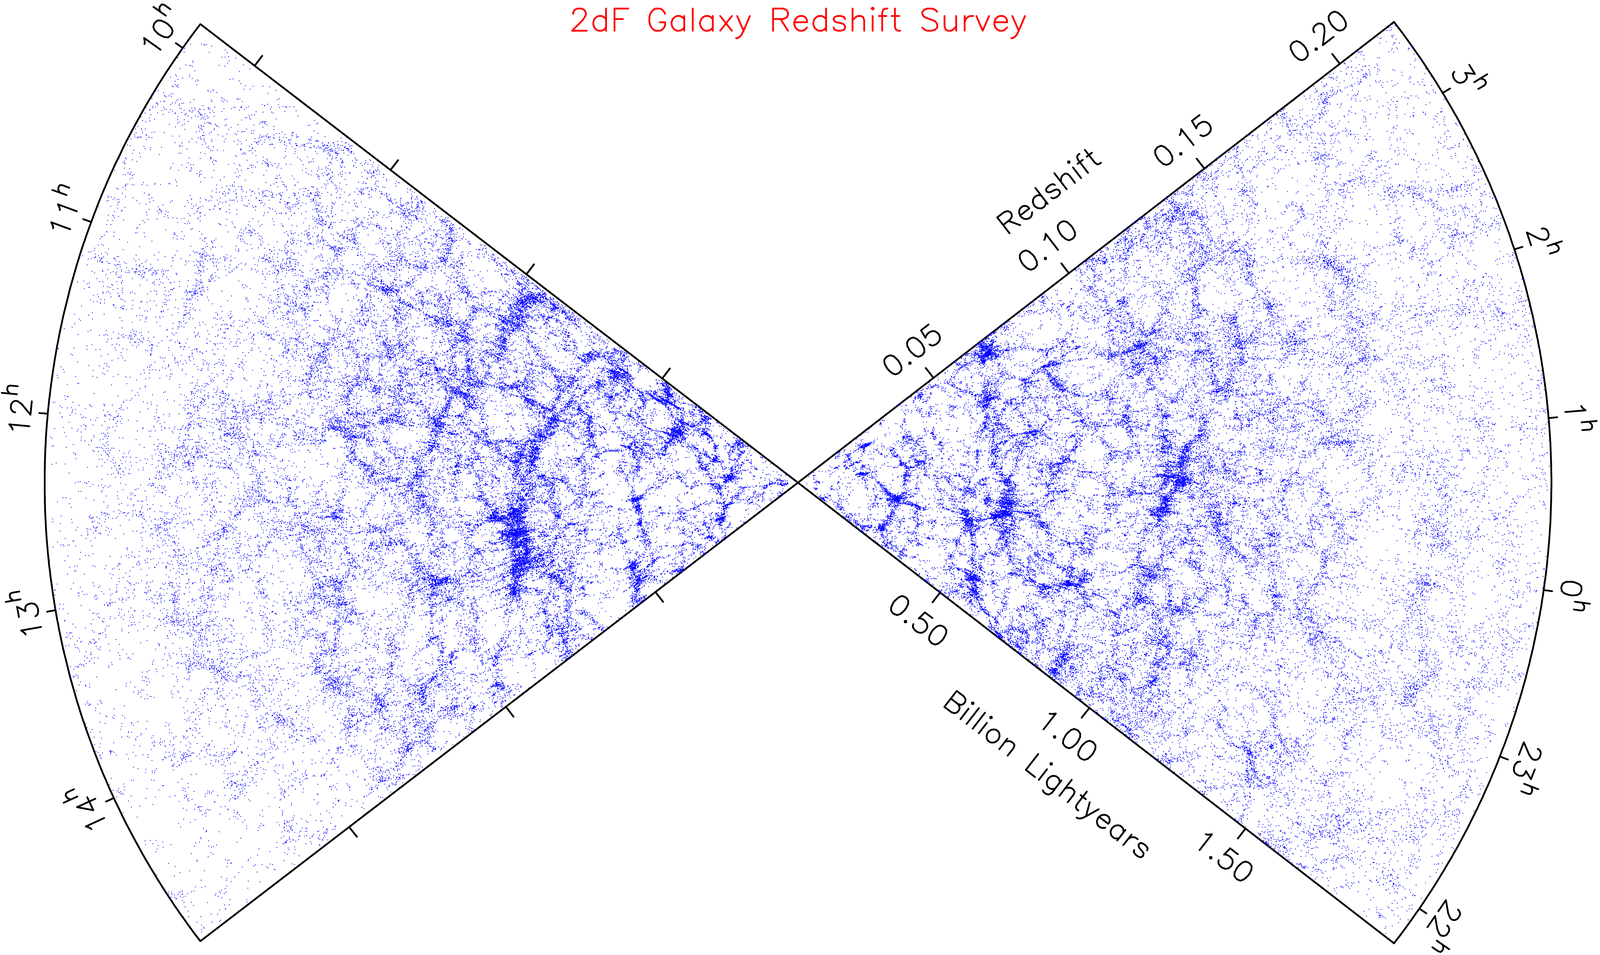
Actual Survey of galaxies (observable universe - obviously)
3D simulation of the cosmic web structure
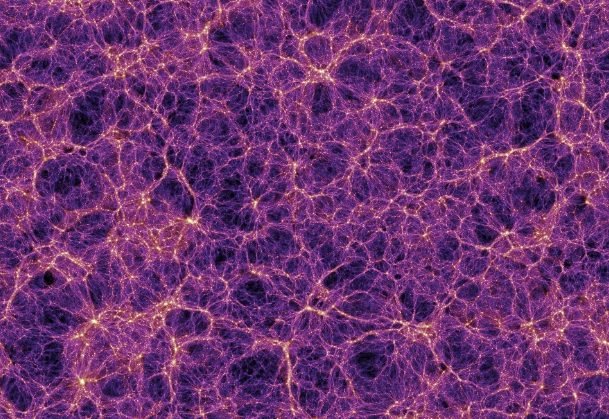
we can see that galaxies(every light dot) tend to group up together into nodes and filaments - but there is also the dark patches - called voids.
Why am I talking about this - Simply because it is very rare that we have wanderer stars and systems. It's all somehow grouped and organized - when it is organized (for example star clusters) all the stars inside tend to have relatively the same properties, and they are on the same distance(cosmological redshift) - if there is a star inside that is going nuts (blueshift) we would see it as bluer than all other ones (unless we do the cosmological redshift reduction - then there would be some in blue some in red).
To conclude we expect blueshift in our local universe, where we can observe motion of stars/planets.
For example if we look in the andromeda - all the stars in there have blueshift (even tho 50%(random number) of stars have different true and radial velocities). It is the same with cosmological redshift - it dominates, but we can subtract it - and get their velocities.
I hope any of this makes sense - but here is an awesome video you have probably already checked upon :)
Nebula ... :>)
A bunch of gas hanging around bound by gravity. :)
The best-known catalogue of nebulous objects in the sky is made by Messier - all the things can be seen from Earth - most of it with just binoculars. They are just diffuse and foggy. :)
IF that was the question at all :D
Thanks for the response @svemirac...
I wasn't asking a question lol … I was merely attempting to show my enthusiasm for your posting the planetary nebula photo that you took.
We have yet to discover a ghost from all the known spectrum.
You got a 46.34% upvote from @ocdb courtesy of @svemirac! :)
@ocdb is a non-profit bidbot for whitelisted Steemians, current max bid is 20 SBD and the equivalent amount in STEEM.
Check our website https://thegoodwhales.io/ for the whitelist, queue and delegation info. Join our Discord channel for more information.
If you like what @ocd does, consider voting for ocd-witness through SteemConnect or on the Steemit Witnesses page. :)
This post has been voted on by the SteemSTEM curation team and voting trail. It is elligible for support from @curie.
If you appreciate the work we are doing, then consider supporting our witness stem.witness. Additional witness support to the curie witness would be appreciated as well.
For additional information please join us on the SteemSTEM discord and to get to know the rest of the community!
Please consider setting @steemstem as a beneficiary to your post to get a stronger support.
Thanks for having used the steemstem.io app. You got a stronger support!
Thank you for your continued support towards JJM. For each 1000 JJM you are holding, you can get an additional 1% of upvote. 10,000JJM would give you a 11% daily voting from the 700K SP virus707 account.