Creating A Weather Forecast Dashboard With Google Sheets
Post number 2 of “The Practical Google Sheets Guide”
These blog posts are part of research I’m doing for a potential new book, hopefully allowing me to further my love for spreadsheets. Theses posts are hoping to provide a practical cookbook of examples to the reader and allow me to learn what people are interested in and how to approach different subjects working with Google Sheets.
TLDR: This post walks you through the steps to create a basic weather forecast data. The Google Sheet can be copied directly from the link here
Importing Weather Forecast Data Into Google Sheets
This dashboard could be part of a wider weather forecast app, or similar steps could be used to provide a forecast of statistical information. The steps involved are not too in depth as you will see from the following:
What You Need To Know To Get This Done?
For todays post, to create the weather forecast dashboard, you will need to be able to do the following. We will step you through things further on in the post, but as a general guideline, you will need to be able to:
- Access a weather API, sign up to the API and set up the specific weather information you are looking for
- Use the IMPORTDATA function to use the information from the weather API
- Use the TODAY function to get todays date, to use in our dashboard
- You will use the SWITCH function to refer to today’s date and then work out what day it will be in 2, 3, 4 days time.
- Finally, you will also use an IF function to allow you to view the chance of rain on a given day and then provide a graphic image that will be suitable for the forecast weather.
All formulas used can be referenced at the following page.
The following steps will walk you through how to create the dashboard on your own Google Sheet, starting with accessing the weather forecast API:
1.Access the weather API: In this instance, we are going use the Visual Crossing website, which provides weather forecast data for the location of your choosing. At the moment, Visual Crossing allows up to 1000 weather forecasts a day on the free account. To get access to your weather forecast, follow the steps below:
- Open a new browser session or tab and access the domain https://www.visualcrossing.com/
- If you have not used Visual Crossing you will need to create an account by clicking on the “Sign Up” button. If you have an account, select “Sign In”
- Select the Query Builder option at the top of the screen to create an API link that you can use to import data into your sheet
- Specify the location for the weather forecast you need, and select the duration to determine the amount of days data you need
- Review the data and when you are happy with your selection, click on the API button to get your URL.
- Your screen should look similar to the one below. Ensure Language is set to Http, output type is CSV and output section is set to Daily. The URL provided will be unique for you and your account with Visual Crossing.
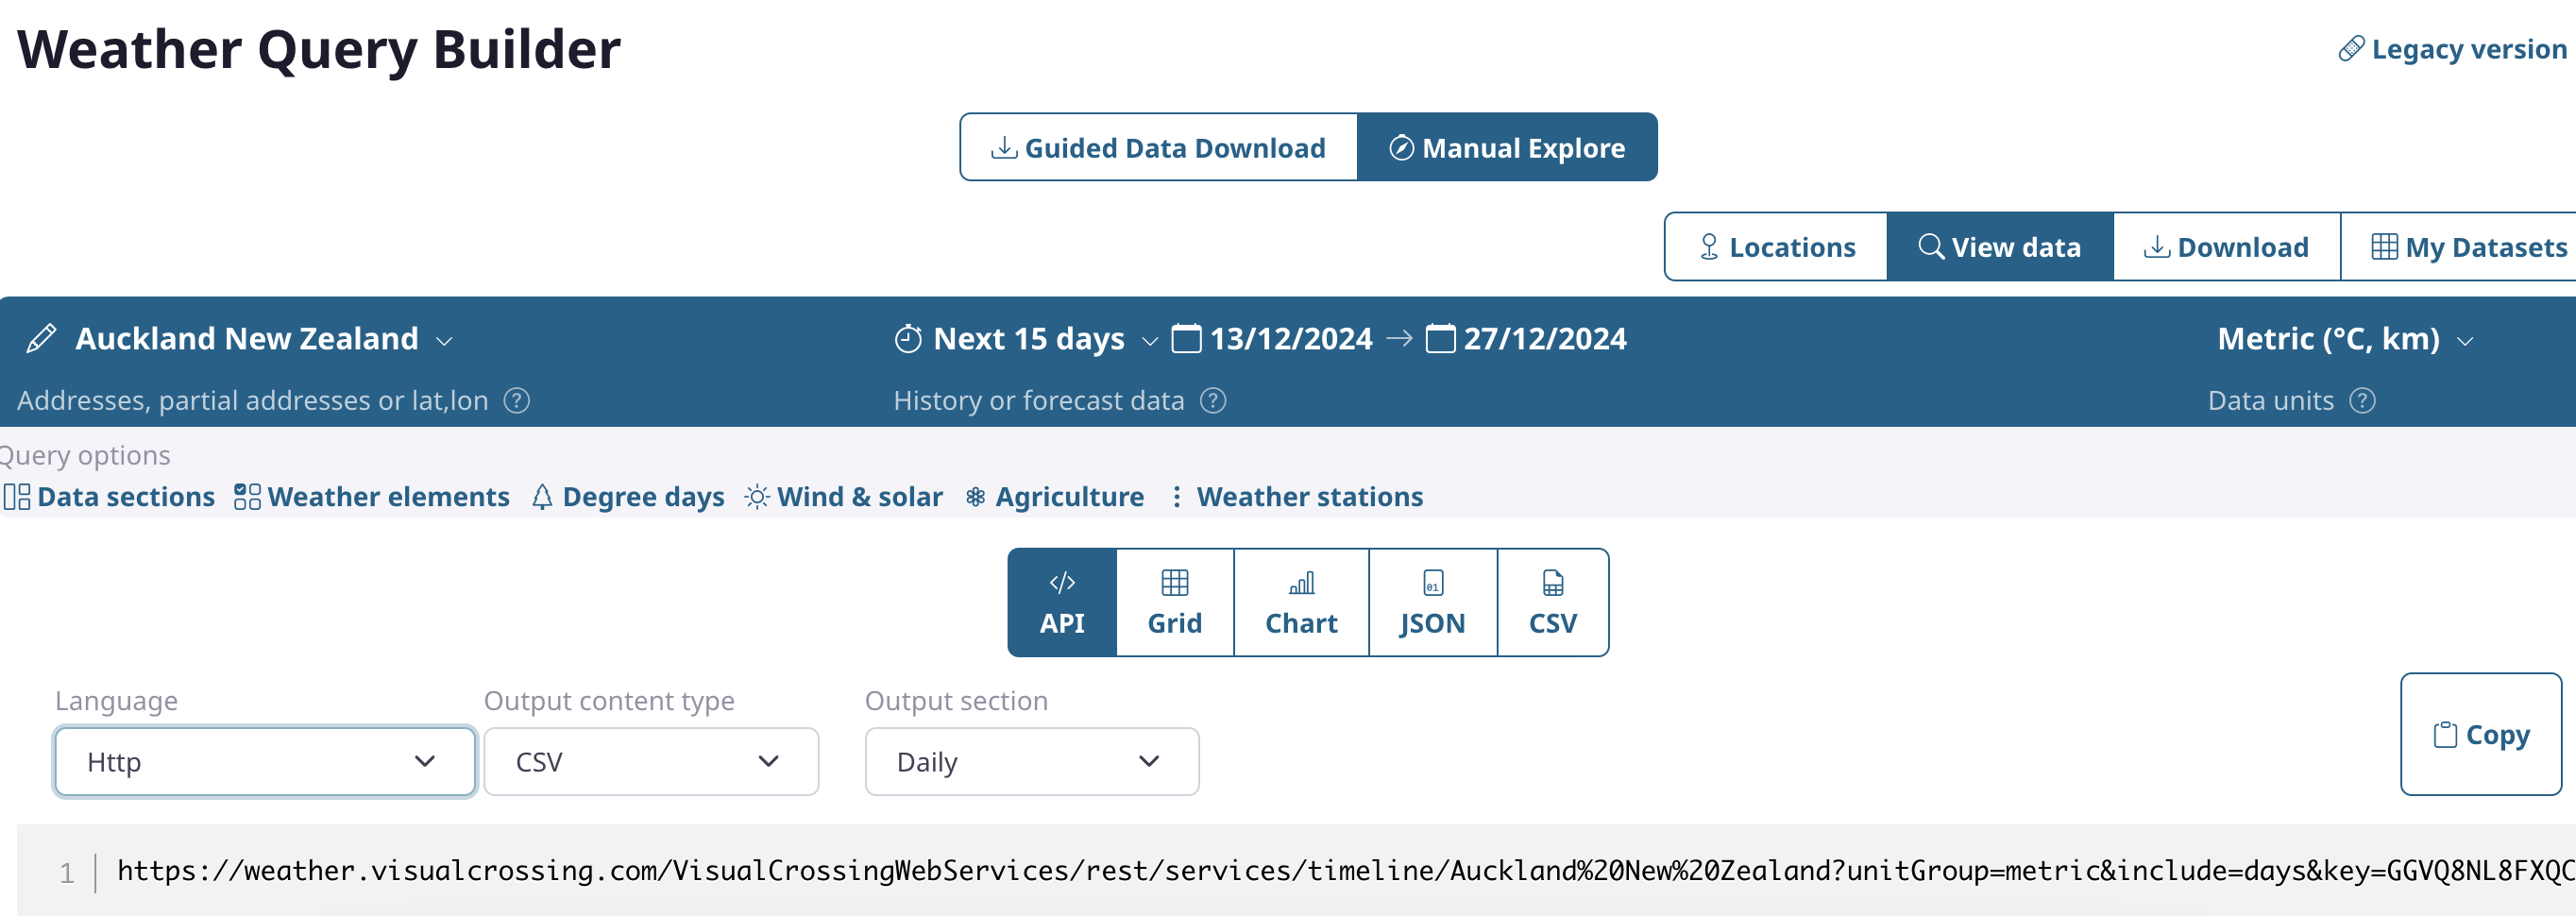
2.You can now import your data. In my case, I created a new sheet and added the IMPORTDATA function to the B13 cell, to allow me to set up the dashboard on top of the data. If you have not used this function before, all you need to do is add the URL you copied in the previous step, in between the function brackets. For example, your unique URL will looks similar to the incomplete one I have added here:
=IMPORTDATA("https://weather.visualcrossing.com/VisualCrossingWebServices….)
3.We can now start creating our dashboard, using the data we are now importing from Visual Crossing:
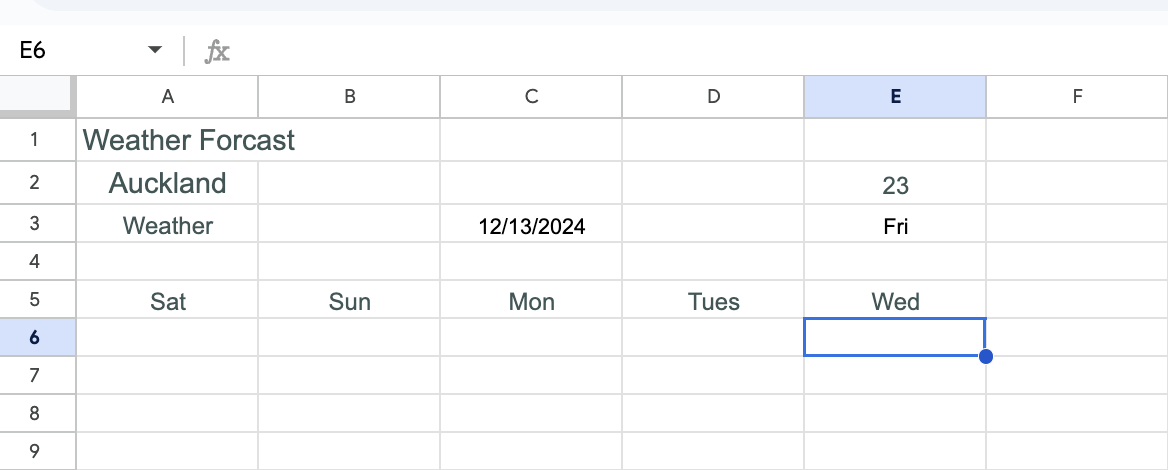
In the centre of our dashboard, add in today’s date under the C3 cell using the =TODAY() function
We can now add todays day name. In our instance we are adding this function in the E3 cell. We use a SWITCH function that takes the value of “$C$3” and uses the WEEKDAY function. This will give us a day number of the week. Using the SWITCH function, we then allocate the day based on the number, for example, day 1 is “Sun”. The full formula is listed below:
=switch(WEEKDAY($C$3),1,"Sun",2,"Mon",3,"Tues",4,"Wed",5, "Thur",6,"Fri",7,"Sat")Now that we have today set up, we can also add in the weather forecast for today as well. From the data we have imported from Visual Crossing, we can simple grab the value for “tempmax” that we have listed in D14. Cell E3, as we have in the image below, you will simply enter the value =D14
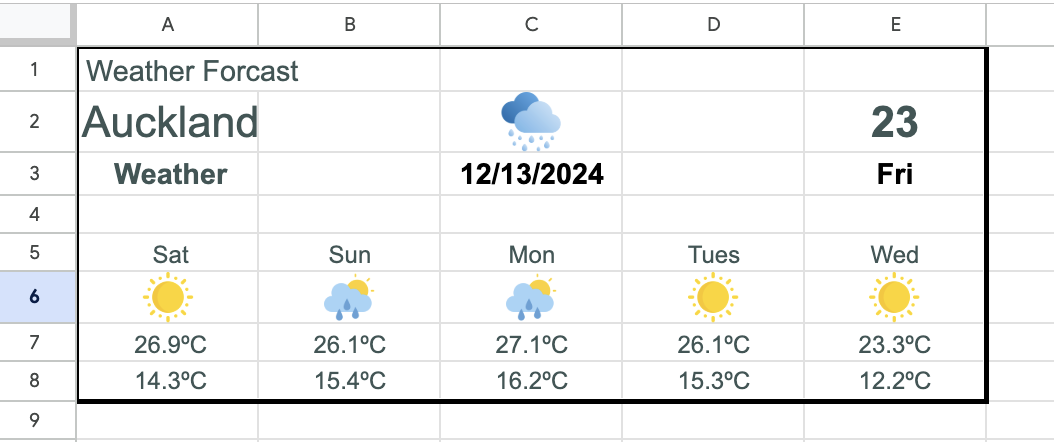
In the image below, we can see that row 5 has the rest of the days of the week. We can add them in again by referencing our TODAY value in $C$3, but for each day, we need to add to that number depending on how many days we are from today. For example, the formula for A5 adds one to the weekday value, as we can see below:
=switch(WEEKDAY($C$3 + 1),1,"Sun",2,"Mon",3,"Tues",4,"Wed",5, "Thur",6,"Fri",7,"Sat")
- In the image below, you can see we now have a forecast minimum and maximum temperature for the next five days across rows 6 and 7. These simply link back to the tempmax and tempmin data that we are importing from Visual Crossing:
.png)
- I found three nice little graphics that are free to use and I am providing them as a graphic based on the chance of rain predicted. In the image above, I added these three images in A14, A15 and A16. You will need to find your own, and then add them to the cell be selecting the cell selecting Image from the Insert menu, and then clicking on “Insert image in cell”.
- We can then create an IF formula in our dashboard to present a graphic of the weather forecast. The data from Visual Crossing also includes a column called “precipprob” which is currently in my page as M14. So the formula in C2 is currently set as:
=IF(M14 < 10, $A$15, IF(AND(M14>11,M14<70), $A$16, IF(M14 > 71, $A$17, "" )))
The formula is basic and has three parts- If the “precipprob” is less than 10, show the sunny image
- If “precipprob” is greater than 10 and less than 70, show the sunny with clouds and rain
- Anything over 71 will be a dark rain clouds.
- Increase the size of some of the cells to improve the look of the dashboard
I think at this point, you should have a nicely formatted and sharp looking dashboard. We have signed up with Visual Crossing and signed up to their weather API. We have used the IMPORTDATA function to import the data into our sheet. We are then using this data to populate our dashboard and some nice formulas to provide the week day for our dashboard, and an image that gives us insight at a glance on the weather forecast. I hope this was useful and clear for you to use in your own examples. For any issues or questions, please reach out to me on my LinkedIn account at the details below.
About the Author
The post is written by Vincent Sesto, a Aussie Software Engineer, living and working in Auckland, New Zealand. If you are interested in my authors page on Amazon, feel free to checked it out at the following link: https://us.amazon.com/stores/author/B073R3VW2G
Thanks for your contribution to the STEMsocial community. Feel free to join us on discord to get to know the rest of us!
Please consider delegating to the @stemsocial account (85% of the curation rewards are returned).
You may also include @stemsocial as a beneficiary of the rewards of this post to get a stronger support.