The Real Number System
Hi there. In this math education post I cover the real number system.

Topics
- Natural Numbers
- Whole Numbers
- Integers
- Rational Numbers
- Irrational Numbers
- Real Numbers
- Summary Chart
Natural Numbers
The natural numbers in mathematics are your regular counting numbers starting from 1. These are 1, 2, 3, 4, 5 and so on. We use a fancy version of the letter ℕ to represent the natural numbers.
Whole Numbers
Adding the number zero to the natural numbers gives the whole numbers. The whole numbers start from zero and count up by 1. These are 0, 1, 2, 3, 4, 5 and so on. The letter W is used to represent the whole numbers.
Integers
The integers ass the negative whole numbers to the whole numbers. You have all the whole numbers that can be either positive or negative plus zero.
This fancy version of the letter ℤ is used to represent the integers.
Rational Numbers
A rational number is a fraction that has an integer in the numerator (top of fraction) and an integer that is not zero in the denominator (bottom of fraction). Rational numbers include 2, -11, one half, negative two thirds, 0.111 which is one ninth and so on. The symbol for the rational numbers is the funny looking Q, ℚ.
Here is the more mathematical representation of representing the rational numbers. Quicklatex.com rendered image below.

This means that the set of rational numbers ℚ is the fraction p over q where p and q are integers and q cannot be equal to zero.
Irrational Numbers
An irrational number is a number that is not rational. These numbers cannot be expressed as a fraction. There is no symbol for the irrational numbers but you can use ℝ\ℚ to represent the real numbers minus the rational numbers.
Examples of irrational numbers include (pi) π ≈ 3.14159… , √5, and the golden ratio φ ≈ 1.618033… .
Real Numbers
Real numbers include the irrational numbers and the rational numbers together. Any whole number, natural number, integer, rational number or irrational number belongs to the real numbers.
I don't get into the complex numbers such as the square root of negative one in this post.
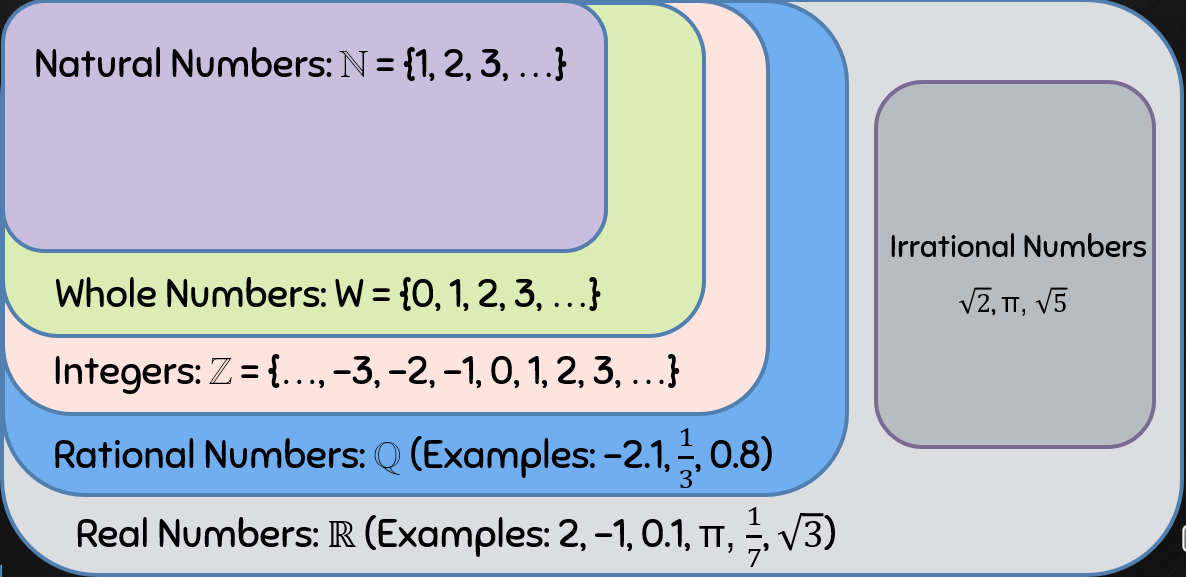
Summary Chart
Here is a summary chart that I made in my Powerpoint notes. This chart is similar to many charts like this one.
Posted using STEMGeeks

Thanks for your contribution to the STEMsocial community. Feel free to join us on discord to get to know the rest of us!
Please consider delegating to the @stemsocial account (85% of the curation rewards are returned).
You may also include @stemsocial as a beneficiary of the rewards of this post to get a stronger support.