jamovi Software - A SPSS Open Source Alternative
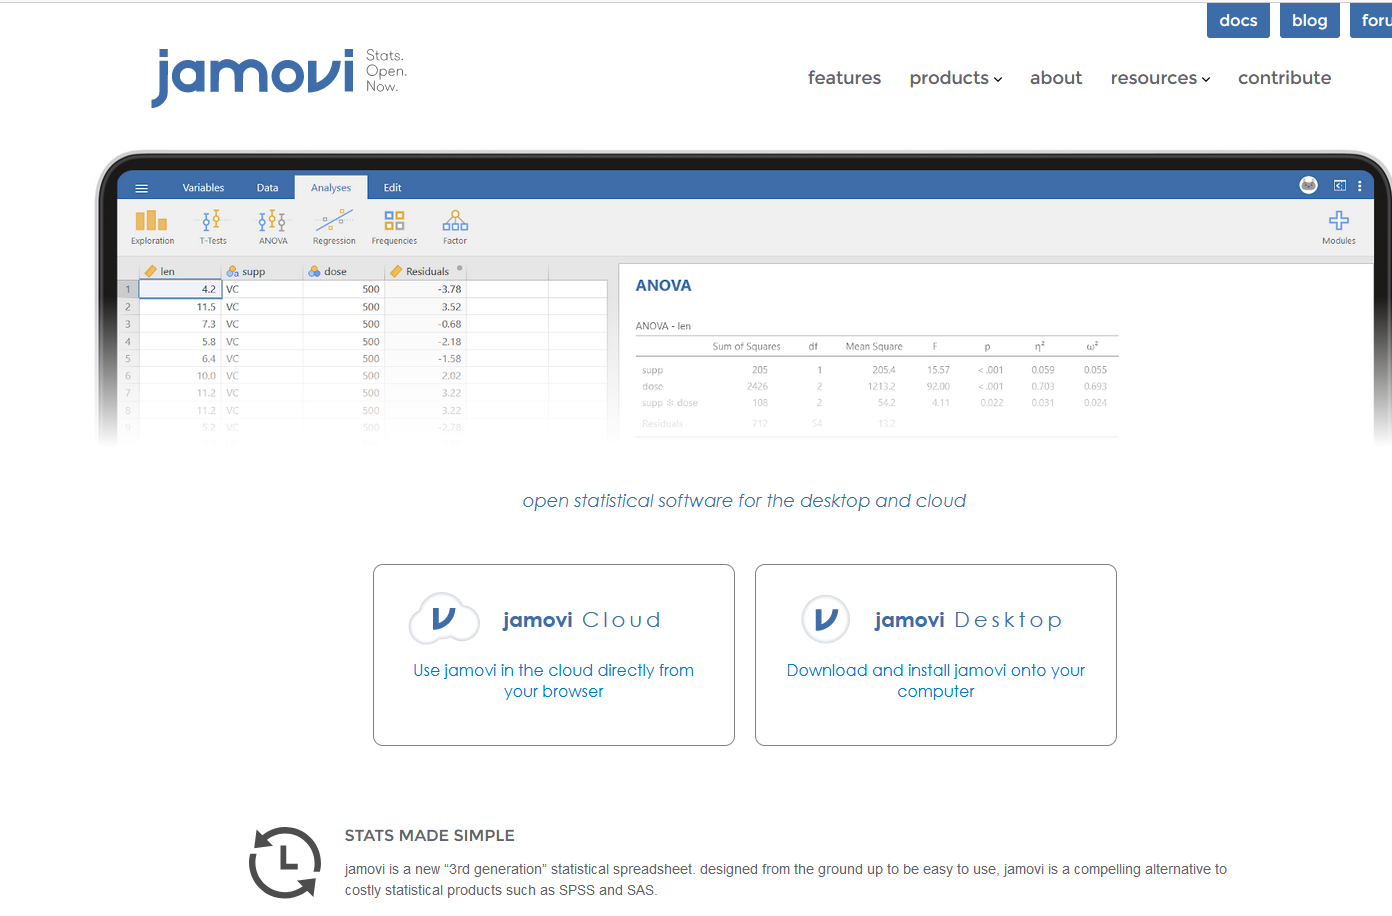
Hi there. I feature the software jamovi in this post. Jamovi is a graphical user interface for the R programming language. It is a free and open-source program for data analysis and for statistical tests. Jamovi is an alternative to paid software products like SPSS and SAS.
I found out about this software from a new student that I am tutoring for statistics for non-math people.
The images are screenshots.
Installation
The installation process is quite simple. From the website click jamovi Desktop to download and install jamovi to your PC. There is a cloud option to use jamovi in the cloud from your web browser. Screenshot below.
Jamovi Interface & Basics
When you start jamovi you get a screen that looks like this. There is a spreadsheet part on the left side and a blank like screen on the right.
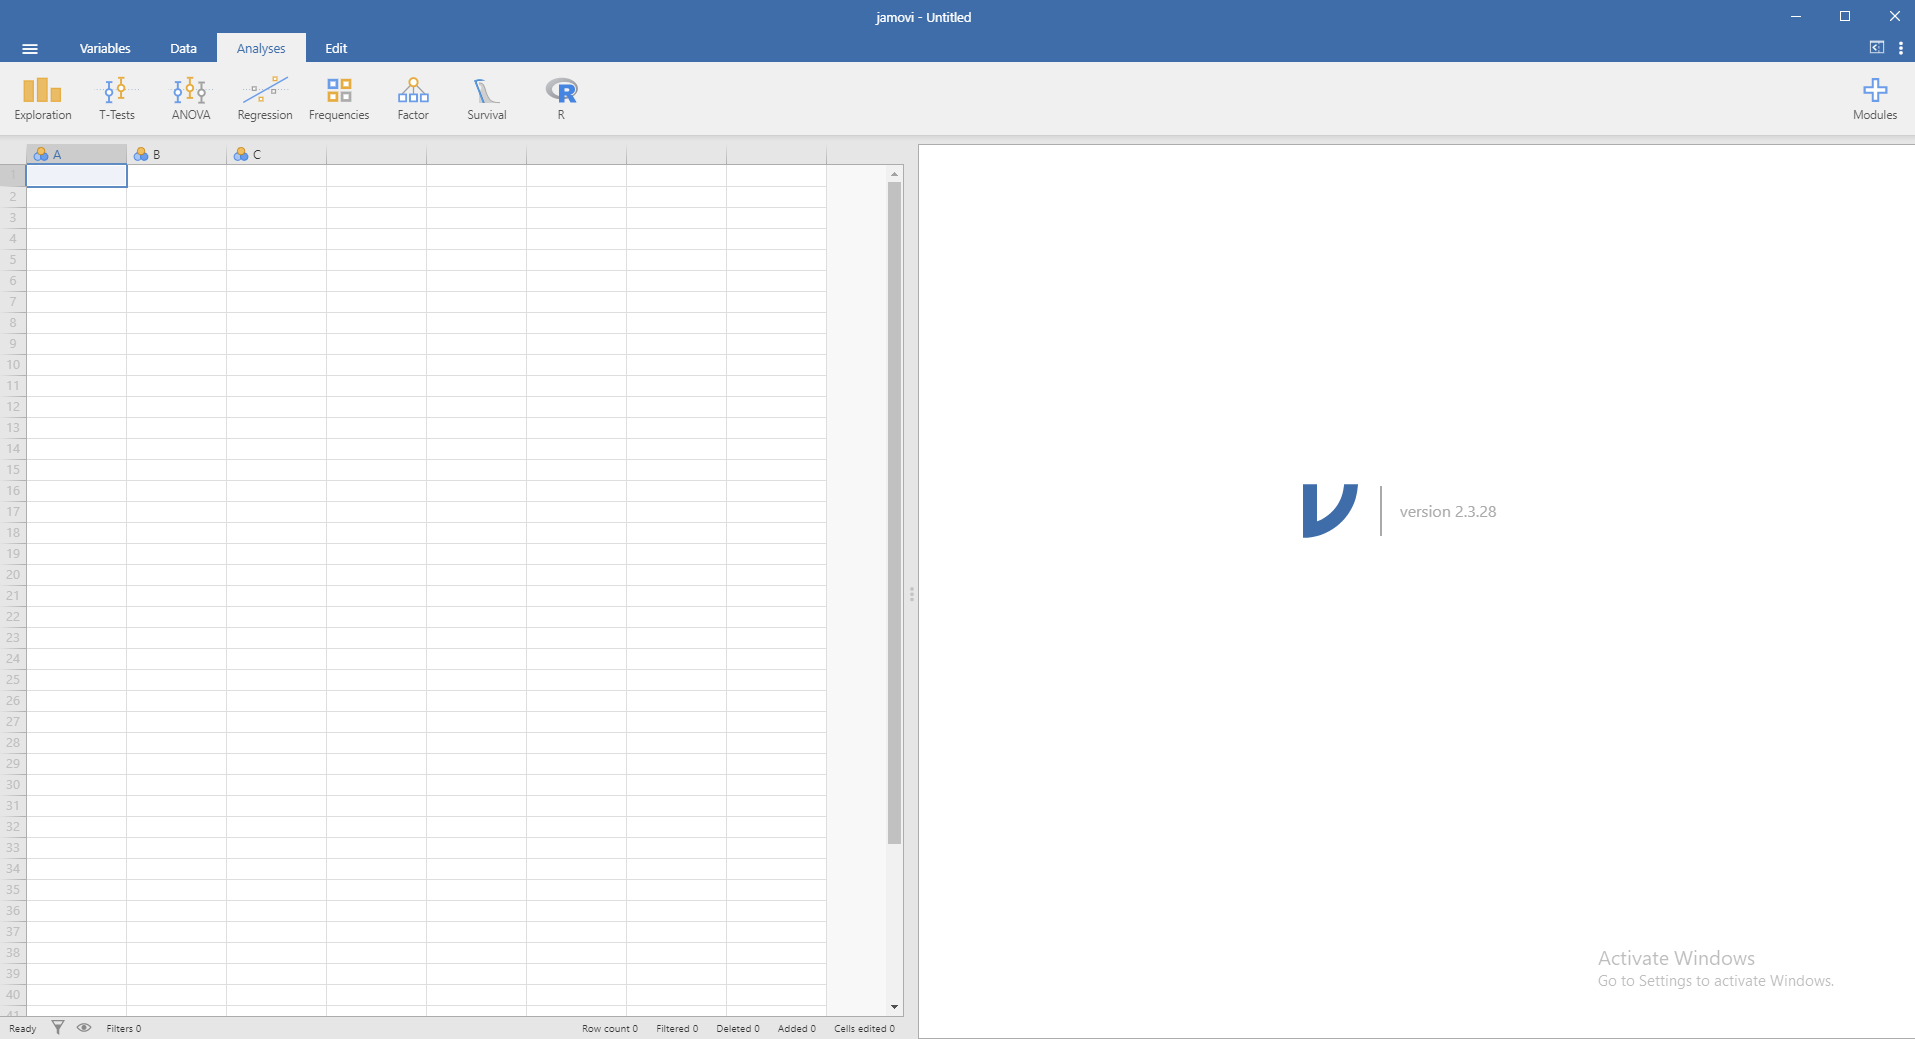
In the top left you have icons. These icons are under the Analyses tab. You have Exploration, T-tests, ANOVA, Regression, Frequencies, Factor, Survival and R.
Changing Variable Names
By default you have the variables A, B and C. The variable name A can be replaced by double clicking first. After the double clicking a pop up window appears.
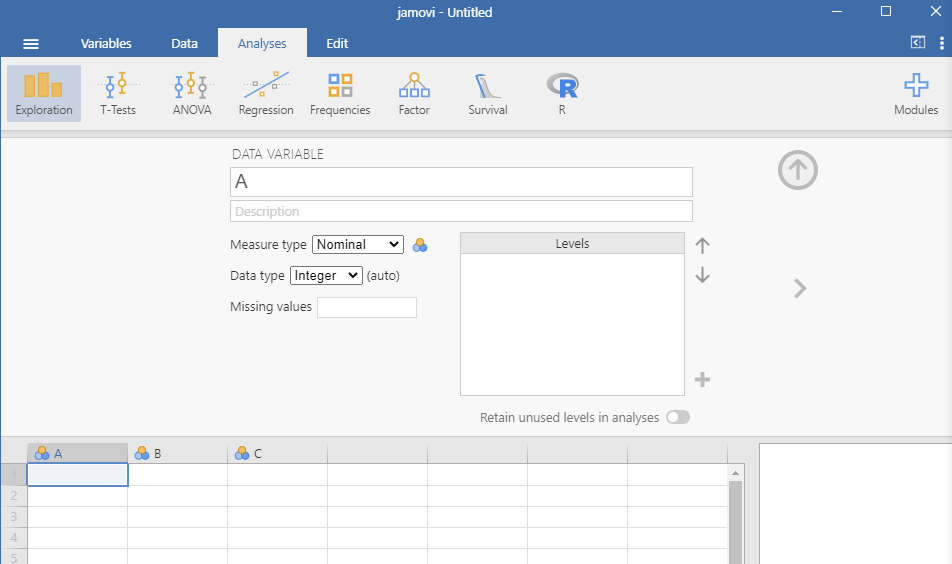
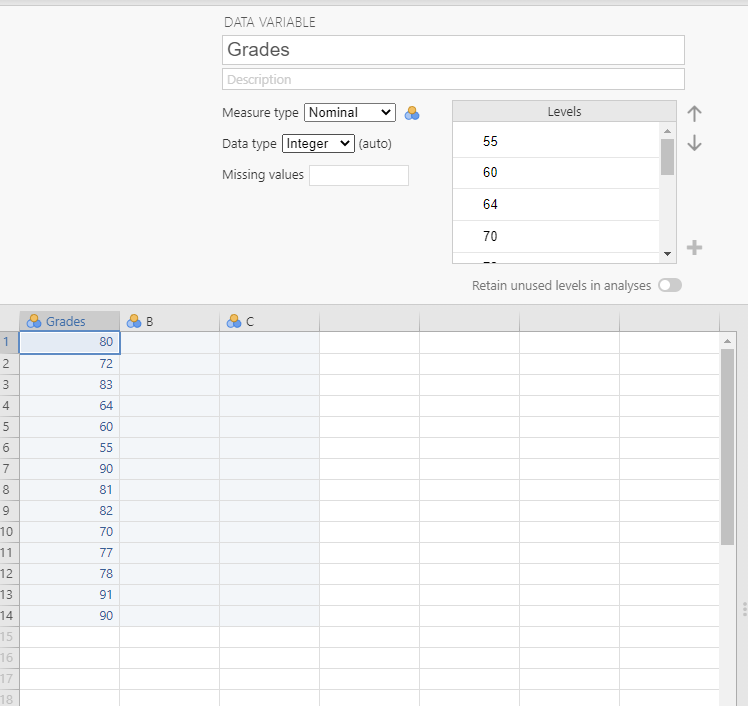
You can change the variable name A into something like Grades. A description can be inputted too. The measure type is either Nominal, Ordinal, Continuous or ID. For data type it is either Integer (default), Decimal or Text.
A Simple Example Of Summary Statistics
Jamovi has a easy to use spreadsheet part on the left side. You can input numbers however you like. I input a sample of fake grades.
In this section I showcase a simple example of generating summary statistics. Summary statistics as in mean, median, mode, minimum and maximum.
Click on the Exploration icon under the Analyses tab. Then click on Descriptives. Another pop up section appears.
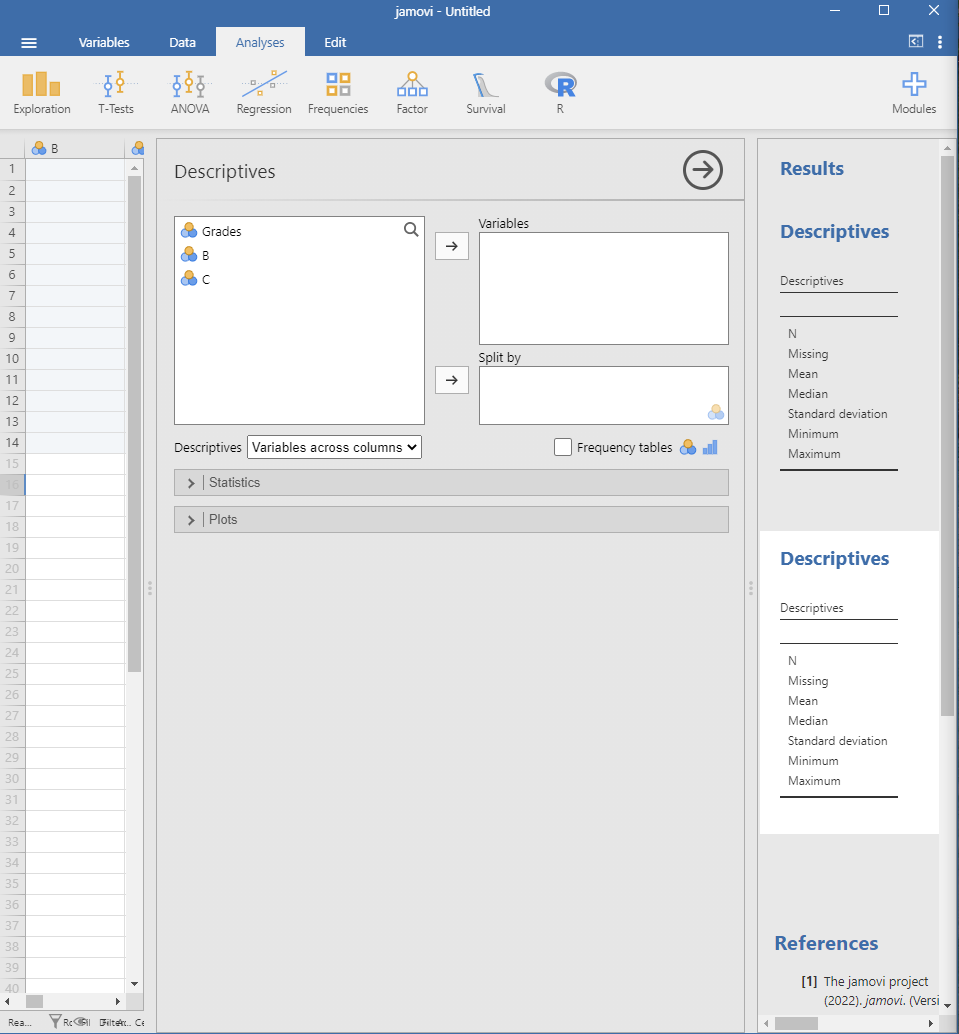
What is the variable of interest for the summary statistics? In this case it is Grades. I want to find the average grade, the median grade, the standard deviation and other summary statistics. Click on Grades and the right arrow beside Variables. You do get your descriptives information on the right side.
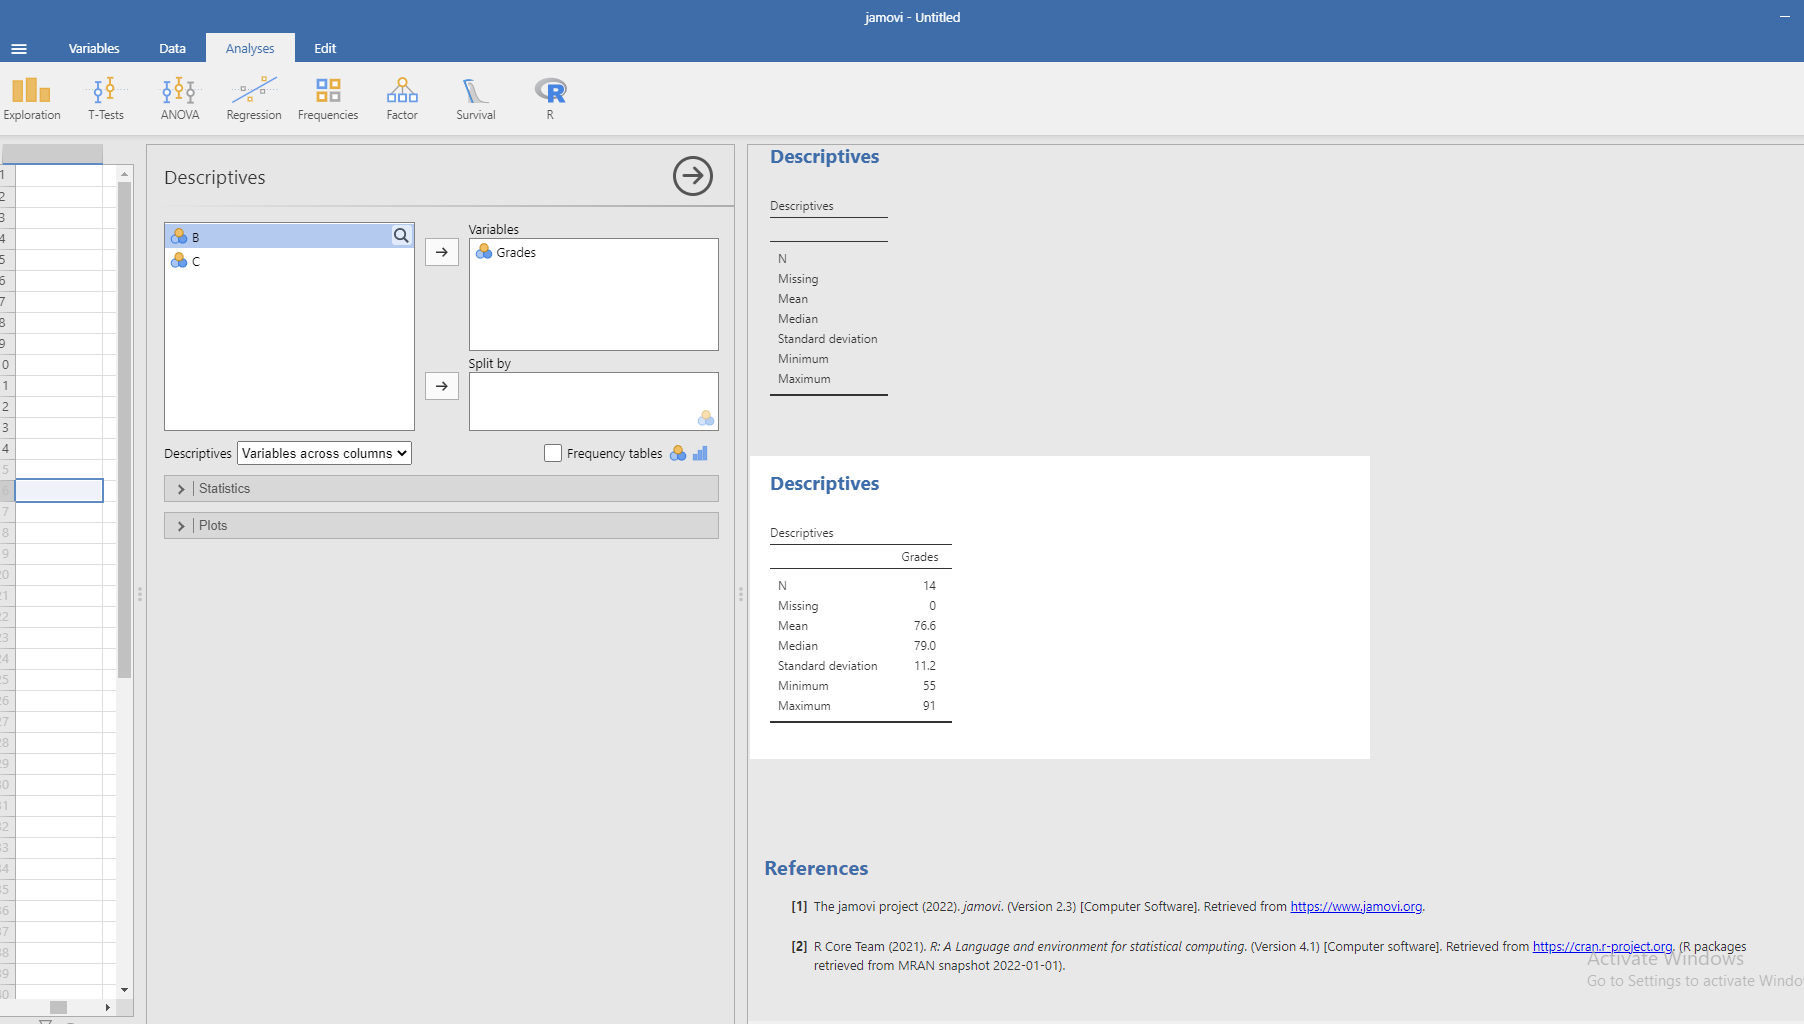
Since jamovi is mainly for non-math/non-stats people there is a References section on the bottom right. This is for reporting purposes.
I may do another post on jamovi where I cover z-scores. It depends on how I feel on writing stuff between stats/math topics, education and Pokemon TCG stuff.
Posted using STEMGeeks
@tipu curate
Upvoted 👌 (Mana: 0/60) Liquid rewards.
Thanks for your contribution to the STEMsocial community. Feel free to join us on discord to get to know the rest of us!
Please consider delegating to the @stemsocial account (85% of the curation rewards are returned).
You may also include @stemsocial as a beneficiary of the rewards of this post to get a stronger support.