Programming My Own Trading Chart - Part 2

It would seem my laying the foundations has paid off. Implementing the chart candles has been smoother than expected. I've ironed out the bugs (I believe) and the chart now renders a specified range of the price history dataset.
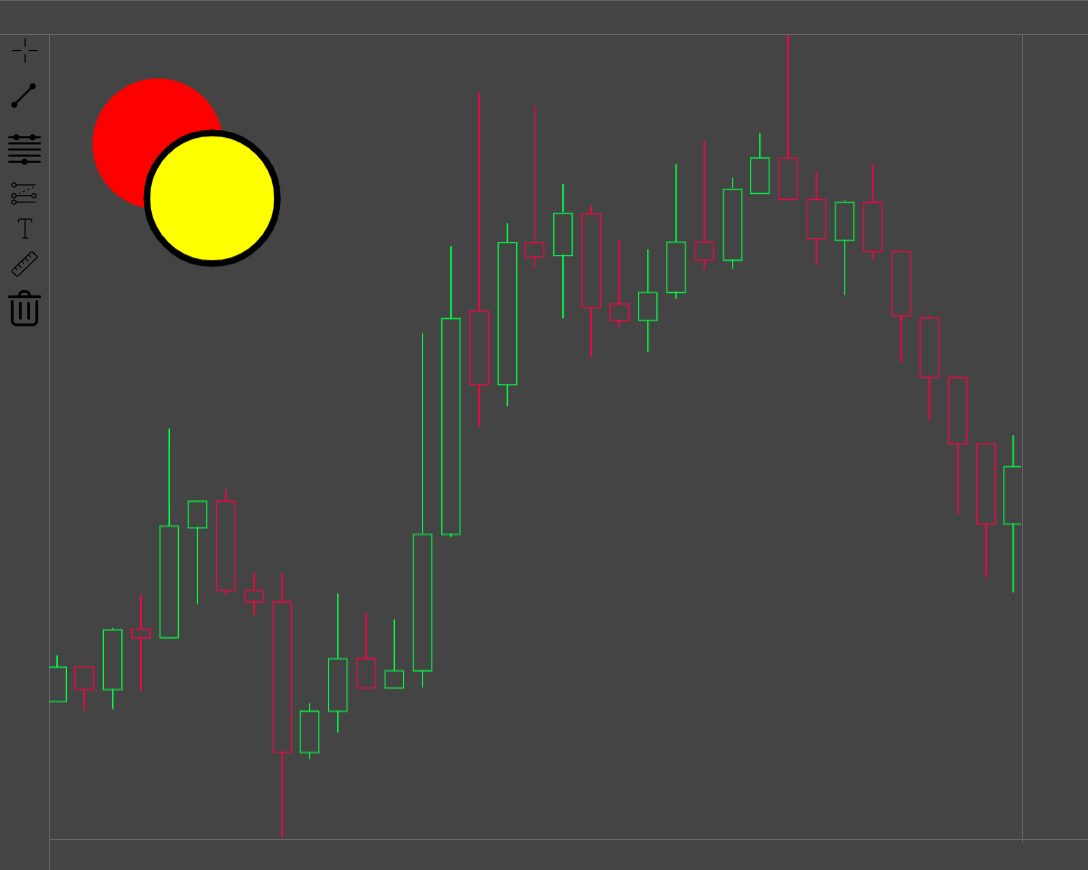
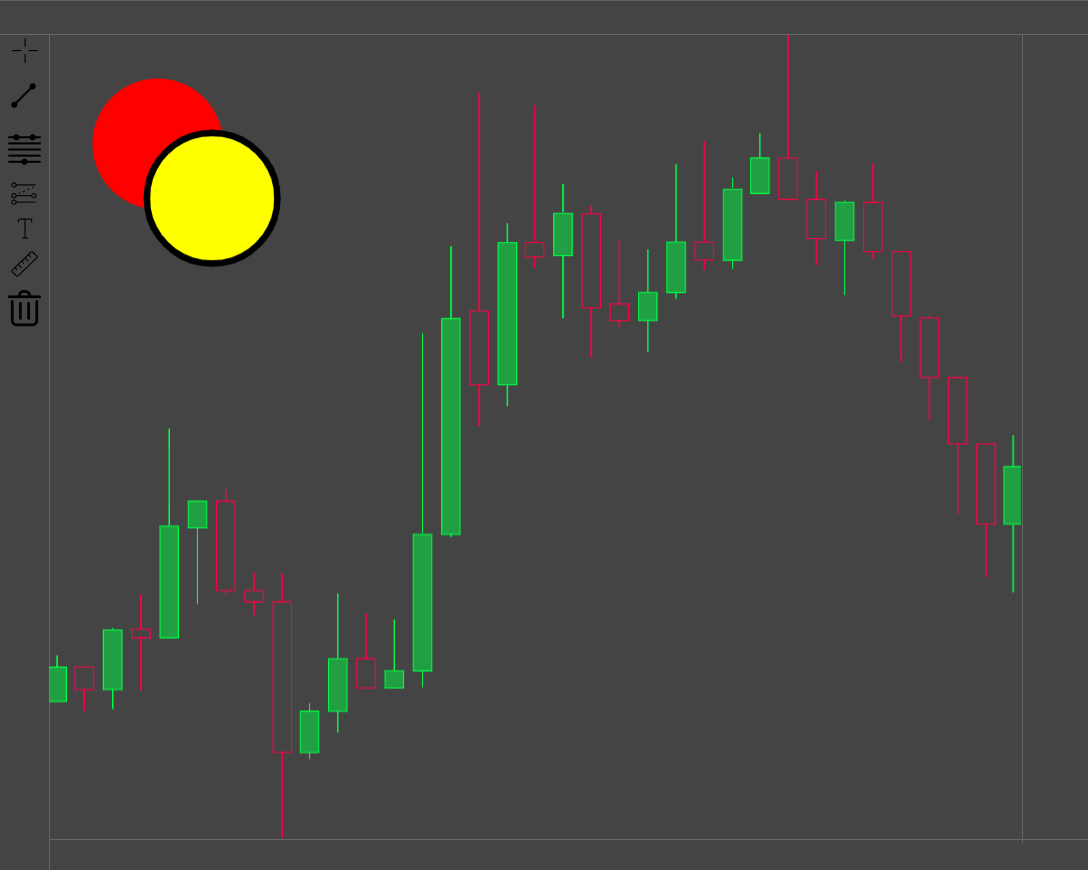
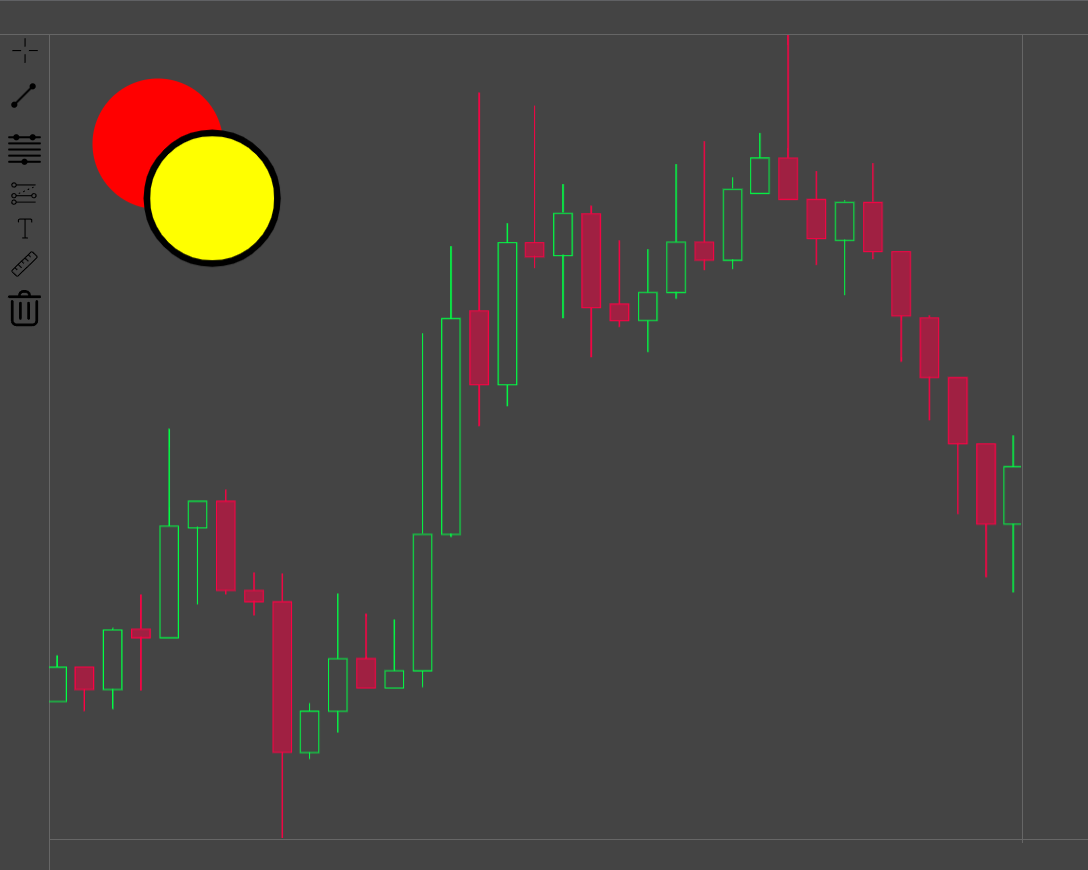
Along with that, the chart displays multiple candle types: solid, hollow, hollow up, hollow down, ohlc (sticks).

Area or line graph style is also planned to be implemented.
Posted Using LeoFinance Beta
0
0
0.000
0 comments