Programming My Own Trading Chart - Part 13
So after nailing the render queue and timeline (X Axis dates), I was still left with a problematic chart panning. After watching the values returned from the pointer (mouse) I could see that occasionally the incremental values were in the wrong direction. Hmmm... it must be the input controller class I thought.
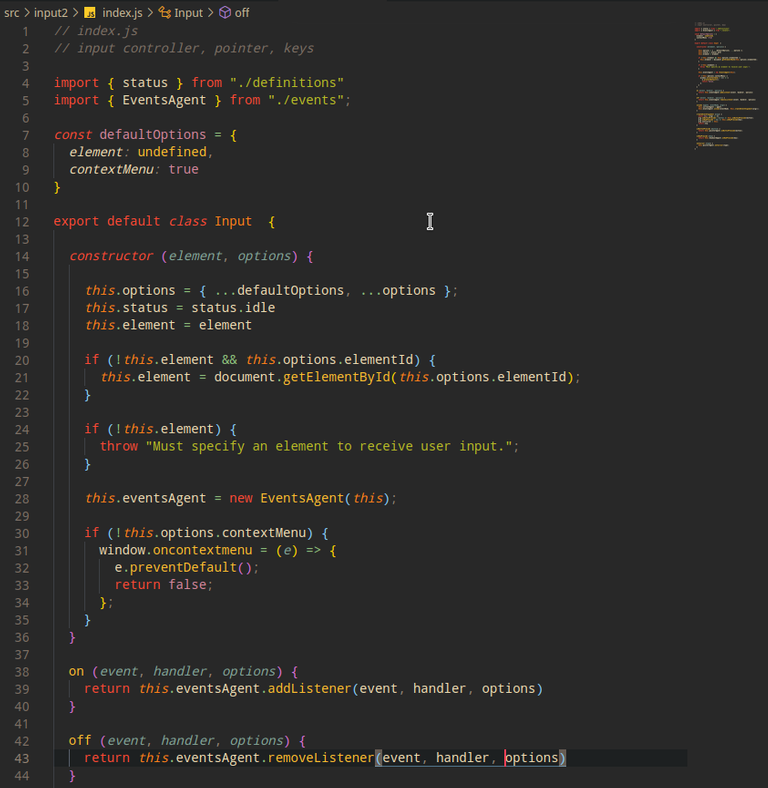
This meant, oh no!, yes, another rewrite, this time to the input controller. The previous version was somewhat out of date, and while supporting mouse and touch actions, it was not using the newer generic pointer events.
The initial results were favourable, resulting in a much smoother chart scroll on drag. The upshot was, I discovered the reason for the anomalies in the old controller, that being the way the synthetic drag event was constructed from standard pointer events, which sometimes resulted in some events handlers being executed out of order. Then with the event throttling applied on top, things easily became chaotic.
This was all an earlier attempt to achieve better performance. But with implementation of the render queue automatically dropping frames if it can't keep up, and hence not over-tax the browser / computer resources, these "fixes" were now redundant and merely causing problems of their own.
Building this trade chart has been such a learning curve. I've burnt a mountain of time because of not knowing the most optimal frame drawing solution. So I've been down many rabbit holes and many detours to arrive at a solution after doing some proper research.
The upside is, I rewrote the input controller, because I thought it might be the culprit, which it wasn't, but now I have a modern input controller that will work with ANY pointer that the browser recognizes, and thus will be future proofed.
So, mouse, touch, pen.. ect.
The scrolling performs smoothly now. I'm getting there, the chart is starting to behave more professionally now.
Posted Using LeoFinance Beta