Mathematics - Signals and Systems - Introduction
![]()
[Image1]
Introduction
Hey it's a me again @drifter1!
Today marks the beginning of a new Mathematics series about the branch of Signal Processing. Most students (including myself) are introduced into that topic through a course in "Signals and Systems", and thus this will be the name of the series. In this series I will be guided by MIT OpenCourseWare's course on Signals and Systems, as well as articles around the Internet.
This article will be a simple introduction to the world of Signal Processing...
So, without further ado, let's get straight into it!
Signals
First and foremost, what are signals?
Signals can be viewed as functions that are used for specific purposes. Those functions contain variables that change over short or even quite distinct "points in time". There occur strong similarities, but also important differences among variables that change over time or are sampled periodically, and so signals are split into two categories:
- Continuous-Time Signals - independent variable is changing continuously (time t)
- Discrete-Time Signals - independent variable is an integer (sample index n)
Continuous Time
How do we visualize a continuous-time signal?
The value of those signals can be plotted in a graph over time, because the signal has a value for any instance of time, and so for any value of the independent variable t.
For example, if x(t) is a continous-time signal, then its graph over time could be:
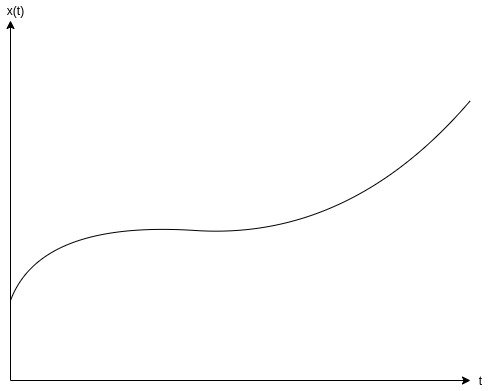
[Custom Figure using draw.io]
Discrete Time
How do we visualize a discrete-time signal?
The value of such signals is plotted in a graph over the sample count, with the samples taken at specific sampling intervals (in seconds). Each value in a discrete-time graph is visualized by a vertical line with a dot over it (a lollipop if you like to think of it that way).
For example, if x(t) gets converted into a discrete-time signal x[n], then its graph over the sample number n is:
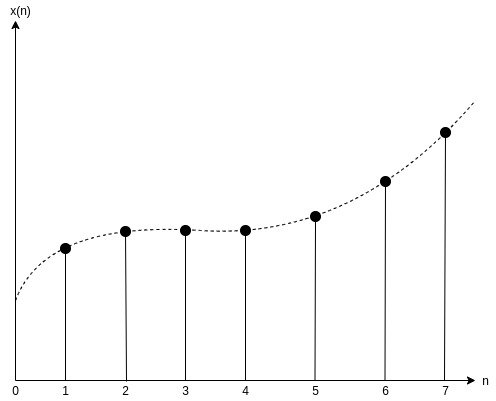
[Custom Figure using draw.io]
Systems
Systems can be viewed as functions that take in a signal, process it in some way, and output it back out. The input and output can be of continous-time and discrete-time.
Analog signals are continous signals that represent some physical measurement and digital signals are time-separated measurements and so discrete-time signals. Converting from analog to digital (A/D converter) can be viewed as a system that takes in a continous-time signal and outputs a discrete-time signal. Similarly the opposite, an digital to analog (D/A converter), can be viewed as a system that takes in a discrete-time signal and turns it into a continuous-time signal.
Systems can also be categorized into linear and non-linear, based on how time affects them. For the sake of simplicity this series will mostly be about LTI systems, which are linear non-time-invariant.
There are also differences in respect to how the systems operate on the signal. Systems can operate on the Time Domai or the Frequency Domain.
Time Domain
The Time Domain is what we covered 'til now. It shows how the value (or more specifically the amplitude) of the signal changes over time, be it continuously or at specific points in time (samples). So, both of the previous graphs are in the Time Domain.
Frequency Domain
The Frequency Domain has far more applications, and plots the amplitude over the frequency. In this domain, Fourier, Laplace and Z Transformations come into play.
For example, the following graphs plot the same continuous-time signal P over the Time and Frequency Domains:
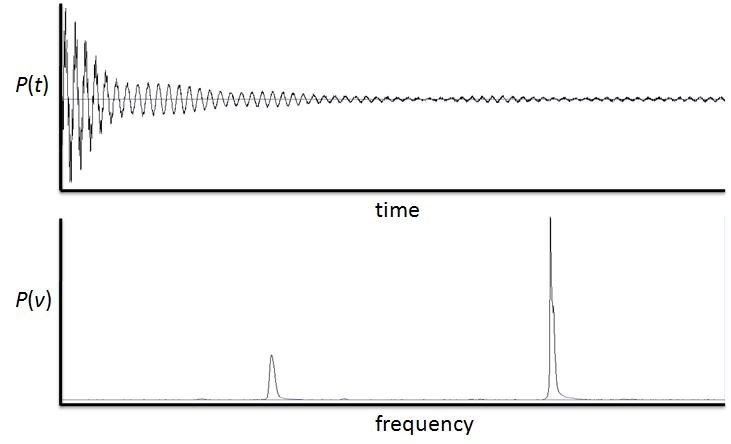
[Image 2]
RESOURCES:
References
- Alan Oppenheim. RES.6-007 Signals and Systems. Spring 2011. Massachusetts Institute of Technology: MIT OpenCourseWare, License: Creative Commons BY-NC-SA.
- https://www.open.edu/openlearn/science-maths-technology/electronic-applications/content-section-3.2
- https://www.guru99.com/analog-vs-digital.html#:~:text=An%20analog%20signal%20is%20a%20continuous%20signal%20that%20represents%20physical,are%20generated%20using%20digital%20modulation.&text=It%20uses%20a%20continuous%20range,and%201%20to%20represent%20information
Images
- https://commons.wikimedia.org/wiki/File:From_Continuous_To_Discrete_Fourier_Transform.gif
- https://commons.wikimedia.org/wiki/File:Time_domain_to_frequency_domain.jpg
Mathematical equations used in this article, where made using quicklatex.
Final words | Next up
And this is actually it for today's post!
Next time we will get more into Signals...
See Ya!

Keep on drifting!
Thanks for your contribution to the STEMsocial community. Feel free to join us on discord to get to know the rest of us!
Please consider supporting our funding proposal, approving our witness (@stem.witness) or delegating to the @stemsocial account (for some ROI).
Please consider using the STEMsocial app app and including @stemsocial as a beneficiary to get a stronger support.