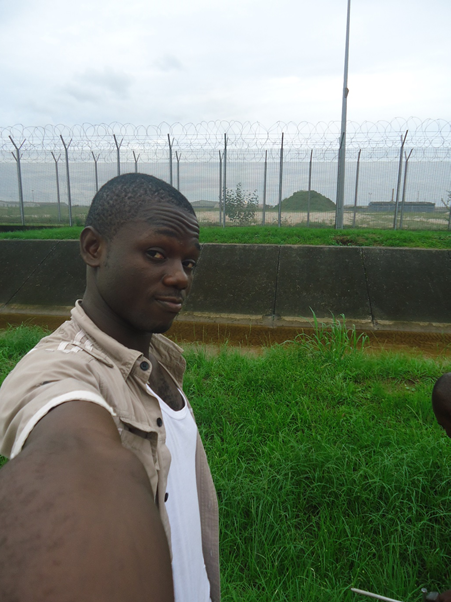
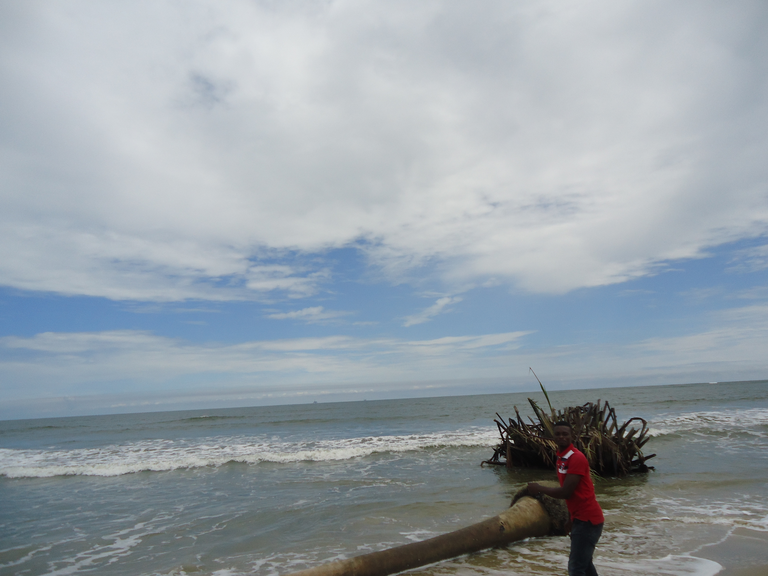
MY SECOND VISIT TO IBENO: THE COAST ZONE
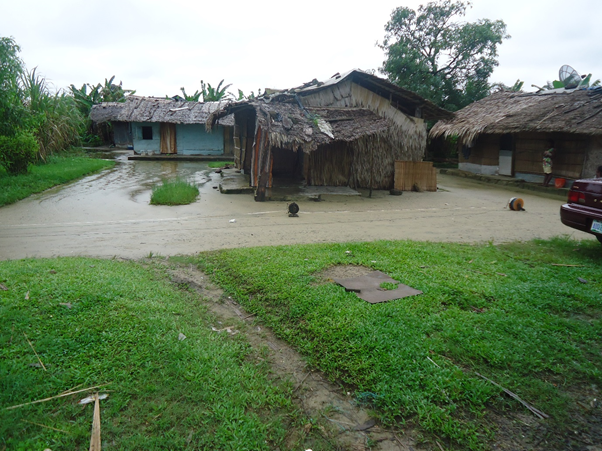
Still at Ibeno Local government area, Akwa Ibom state in Nigeria...talking about polluted water and our health status...in my last visit to Iben was aimed at getting water samples for laboratory analysis for the determination of physical and chemical quality of water and its suitability for various purposes like drinking, domestic, agricultural and industrial uses. It was fun though the rain could not let get through with everything...
Today was actually another day...continued from where we stopped yesterday...
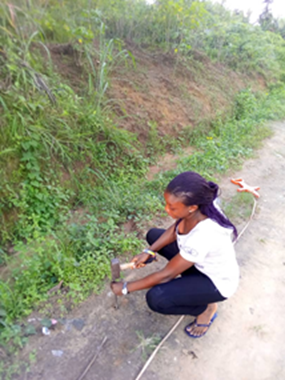
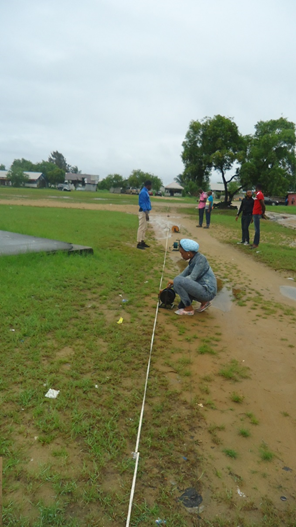
Today’s move was all about collection of data from electrical resistivity survey from different locations in the area using geophysical techniques (vertical electrical sounding and Electrical resistivity tomography) in determining subsurface tomography of Ibeno Local Government Area in Akwa Ibom State, Nigeria. This survey was actually carried out to access the level of incursion of saltwater into the fresh water system of the area.
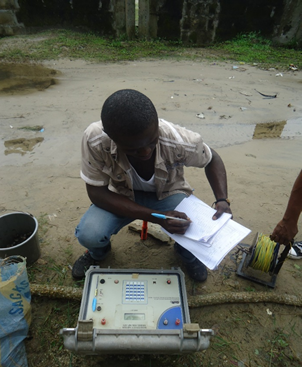
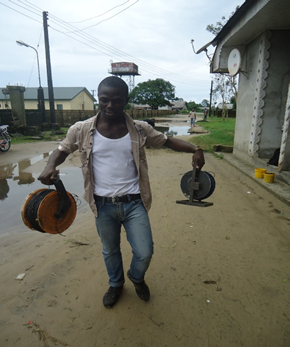
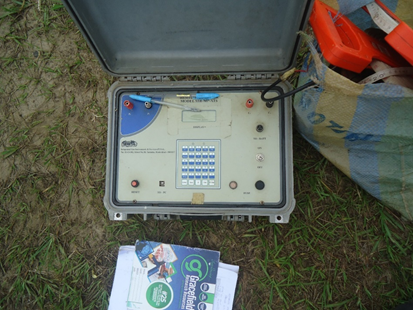
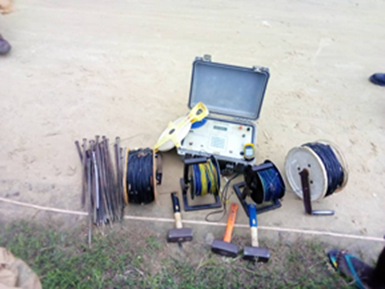
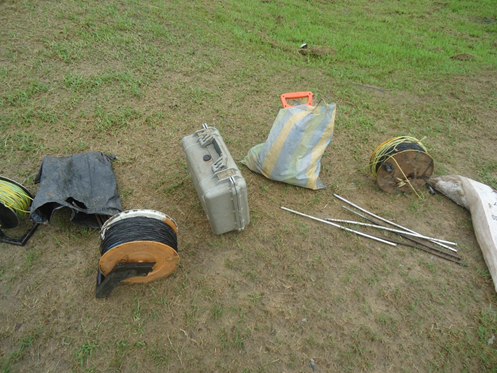
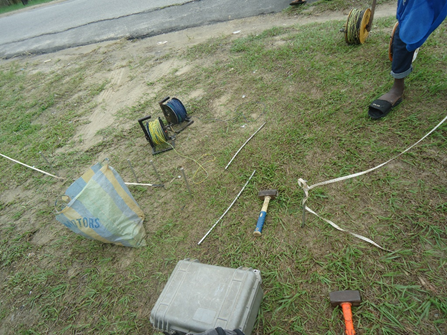
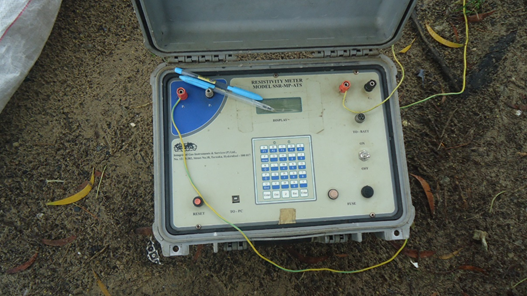
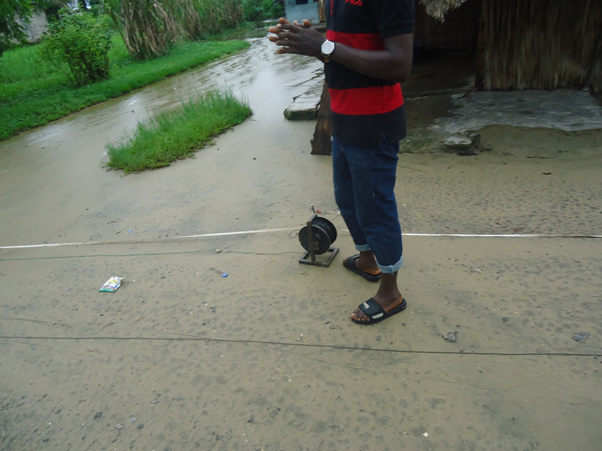
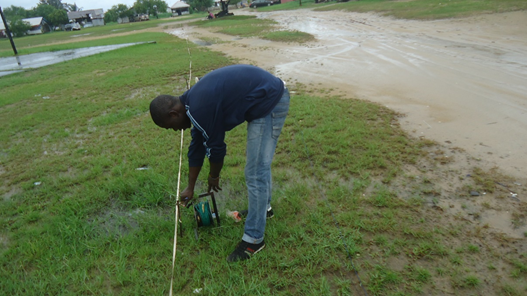
During the course of this survey, the following instruments were used for the survey which included: steel electrodes, resistivity meter (terrameter),
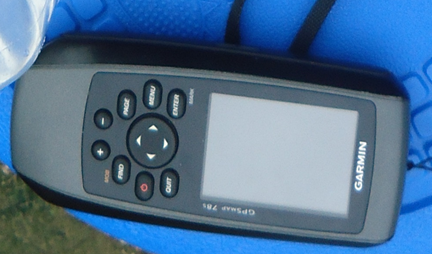
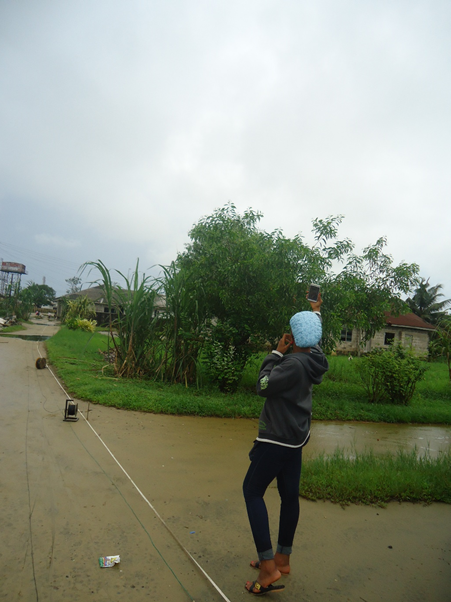
Geographic positioning system (GPS) was used to take coordinates of the ERT and VES points in the study area,
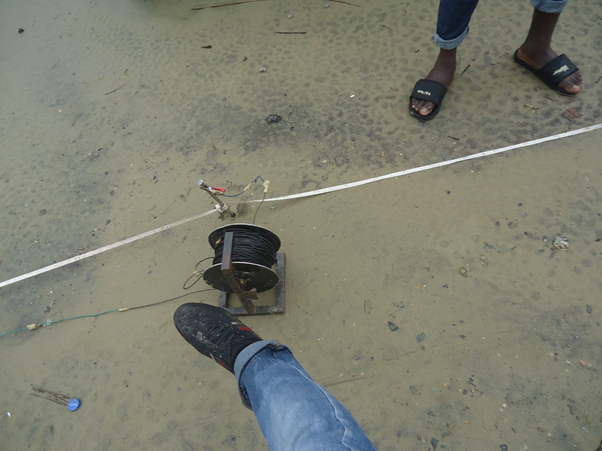
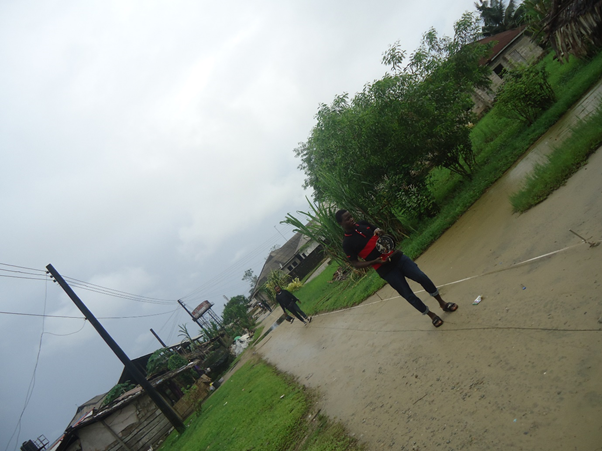
Measuring tape to measure the total distance of the ERT and VES survey and also to measure the spacing distance between the electrodes,
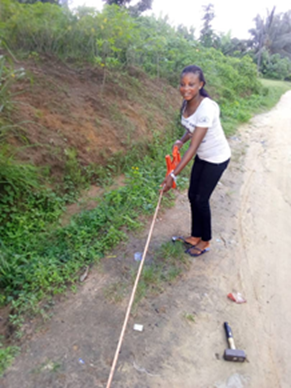
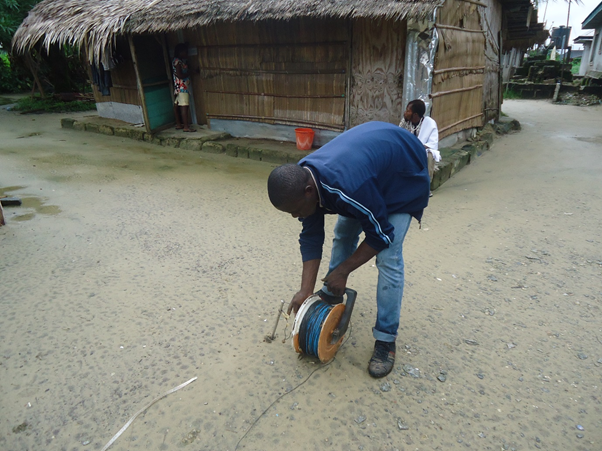
Hammer to pull or insert the electrodes in to the subsurface,
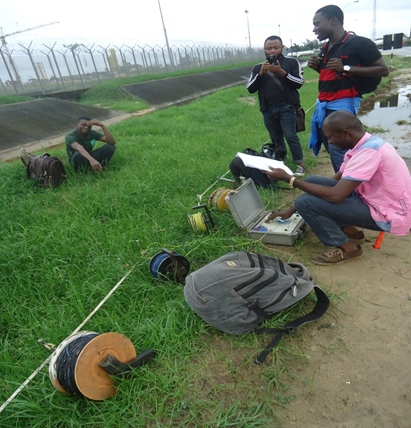
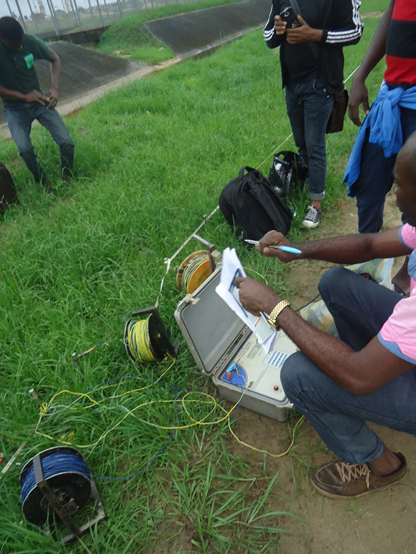
Field notebook to record the data.
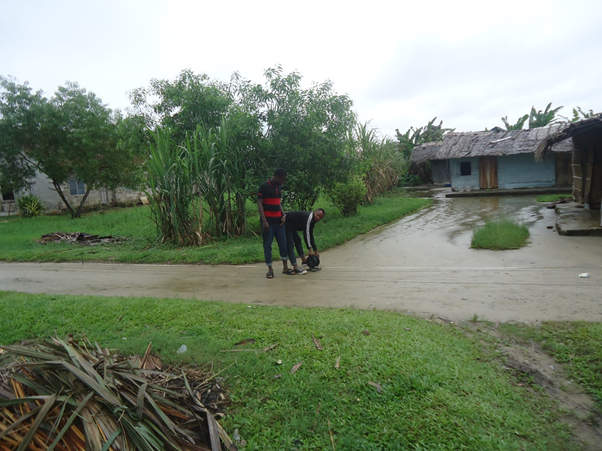
In the field, the total population for the survey was Ibeno urban, Ibeno, Akwa Ibom State with three vertical electrical sounding (VES) and four electrical resistivity tomography (ERT) carried out. Procedures carried out were as follows:
System of profiles for VES (vertical electrical sounding) and ERT (electrical resistivity tomography) was used and this was done along traverses in a systematic way by station occupation
A resistivity meter together with an electronic switching unit was used to automatically select the relevant four electrodes for each measurement.
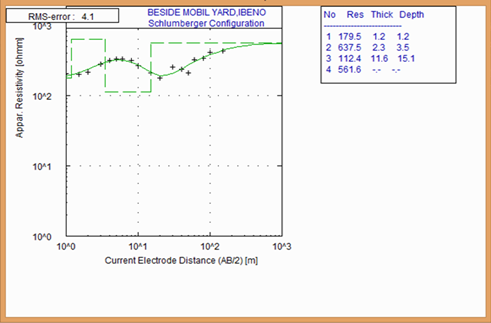
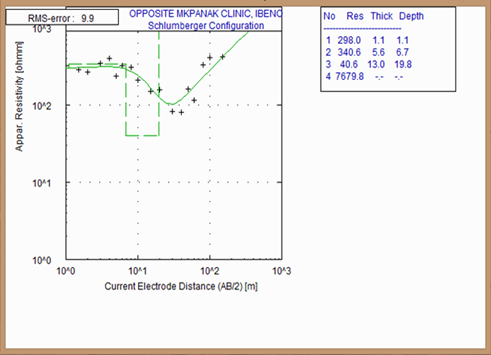
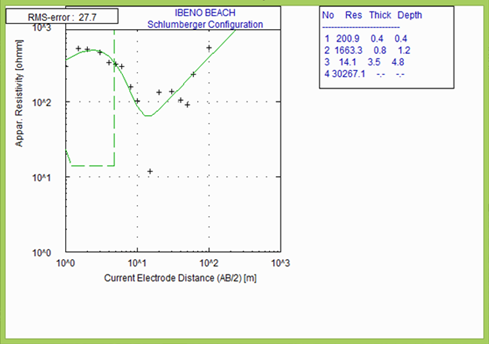
In this survey, the Schlumberger array was used for the Vertical Electrical Sounding (VES) method because it is moderately sensitive to both horizontal and vertical structures
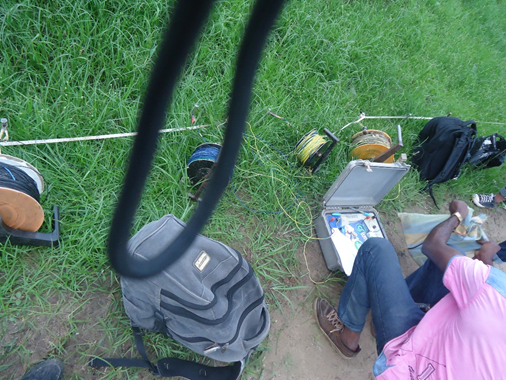
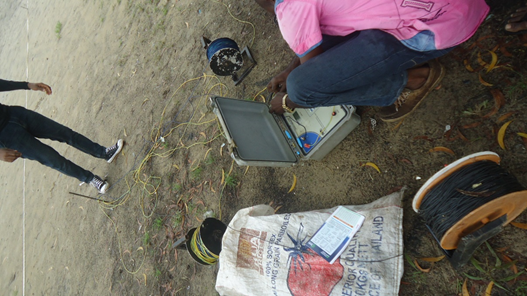
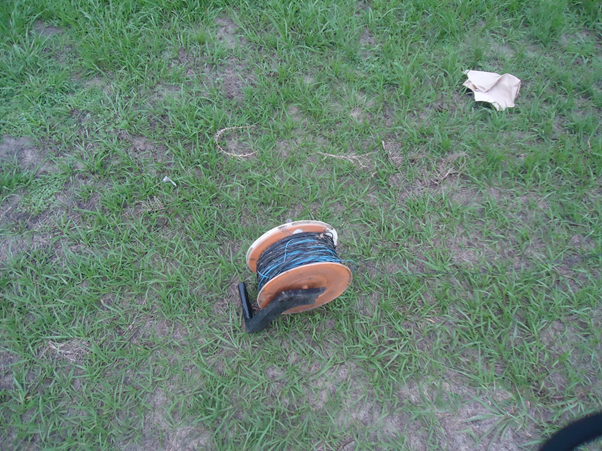
steel electrodes was connected through multicore cables to a switching panel which was placed in the middle of the profile. 2 pairs current and potential of cable reels were also used. The current and potential terminals from the switch panel were connected to the respective terminals of the Digital Resistivity Meter
The power source was connected to the resistivity meter and the meter was put ON and also prepared to record while the cables from the meter were also connected to the first four electrodes along the survey line for profiling, profiling done involved
Wenner array was used for the Electrical Resistivity Tomography (ERT) method because it is relatively sensitive to vertical changes in the subsurface resistivity below the centre of the array and it also has a moderate depth of investigation
A constant spacing between adjacent electrodes of 5m was used in the Electrical Resistivity Tomography (ERT). moving the whole array with constant spacing of 5m that is from 5m spacing and then expanded to 10m spacing, 15m, 20m, 25m, and 30m along the line of survey till the 150m spread was exhausted.
Problems encountered were the difficulty in moving cables from one point to another, and that made it so hectic although it was fun too.
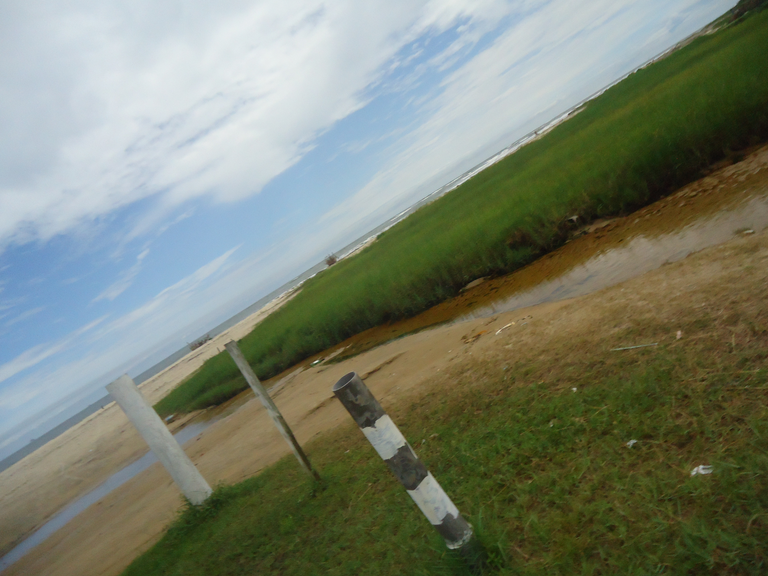
Readings on the resistivity meter were limited to shallow depth as there was no further increase of the electrodes. This was basically because of the nature of the beach. Resistance readings gotten from the resistivity meter were written down at every measuring point
After the field survey, the measured resistances were then converted to apparent resistivity values with the help of the geometrical factor of Wenner electrode array (2πaR) where R is the (resistance measured in the field otherwise known as the ground resistance) and “a” ( is the spacing between electrodes).
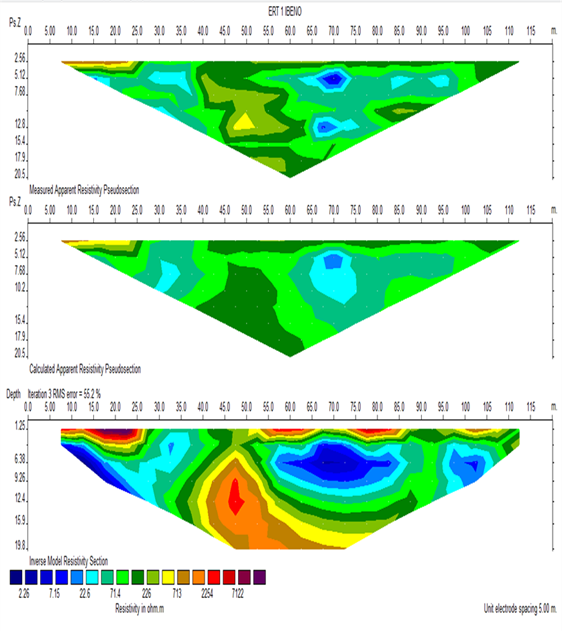
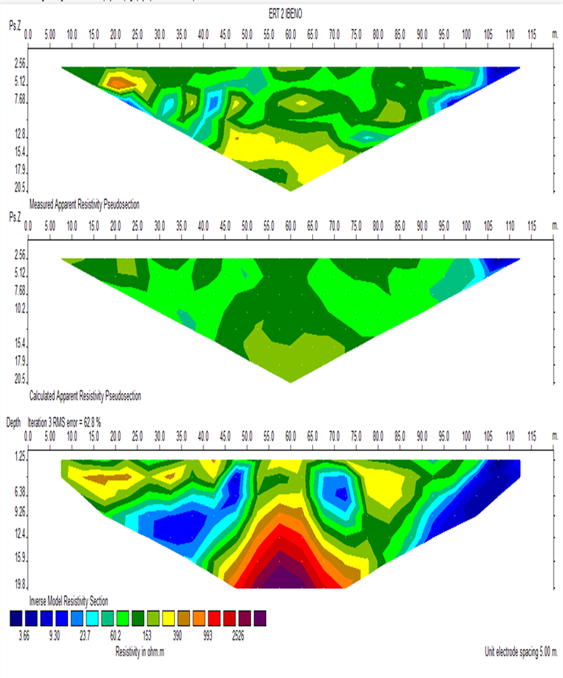
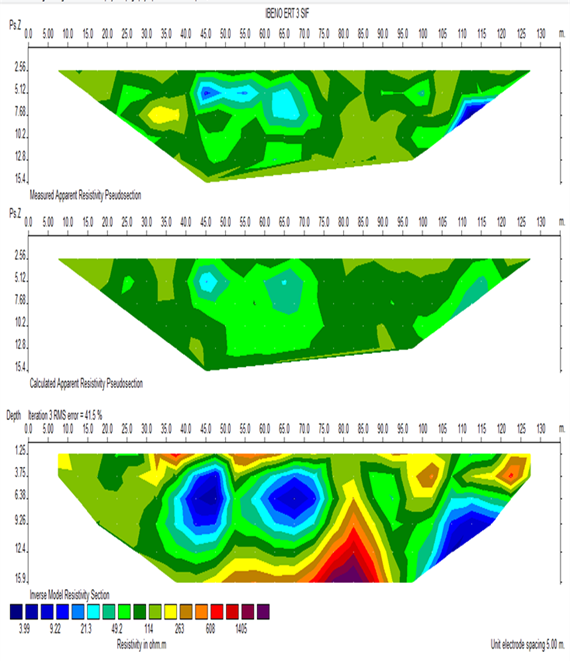
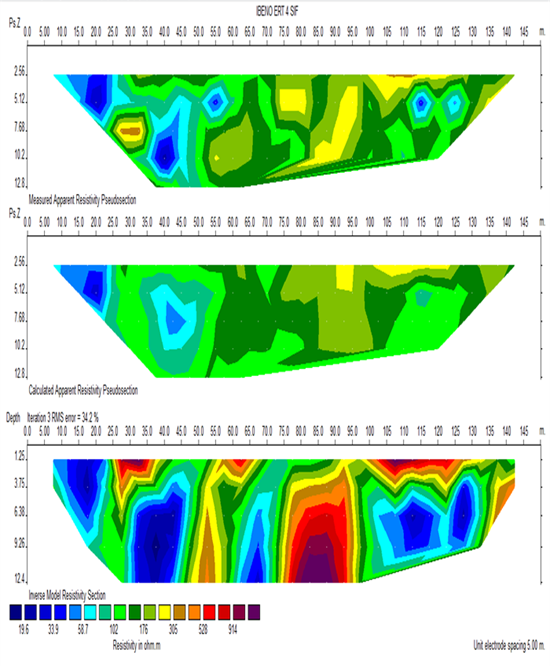
The data acquired were used to create 2D Electrical Resistivity tomography for the ERT using the RES2DINV software program. The pseudo-section reflects the true resistivity distribution along the profile and therefore was used as a base for qualitative interpretation.
For the Electrical Resistivity Tomography:
For the Vertical Electrical Sounding:
though it was stressful...we made it a day...