Explore
Curator's Pick
Login
Sign up
stem
stemsocial
hive-130906
neoxian
archon
nature
hive-196387
waivio
programming
steemstem
natureobserver
waiv
science
insect
palnet
ctp
ecency
proofofbrain
discovery-it
security
flower
vyb
technology
cent
amazingnature
photos
hive-111030
3speak
hive
python
hive-128780
scifiverse
hiveengine
math
physics
education
poll
electromagnetism
spanish
art
#rstats
Trending Posts
@algoswithamber
0
12 months ago
Ecency
R-Programming Tutorial : Labels, Titles, and Subtitles with ggplot2
Maybe you've heard the saying that a picture is worth a thousand words, but guess what? Words themselves are pretty important also! Especially when it comes to visualizing data…
@algoswithamber
0
12 months ago
STEMGeeks
GGPLOT Tutorial 3 - Changing Label Size, Shape, Font, Rotation, and Alignment
@algoswithamber
0
11 months ago
STEMGeeks
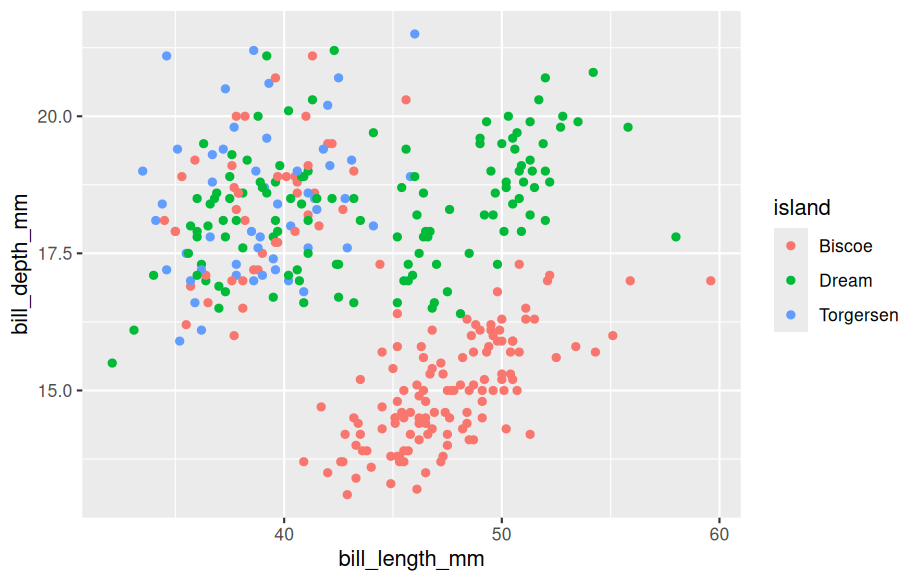
Quickly Change Plot Color Schemes With ggsci : R Tutorial 4
If you're anything like me, then you know it can be difficult to find color combinations that work well together. Thankfully, the R programming language has a powerful package…
@algoswithamber
0
11 months ago
STEMGeeks
Changing Plot Backgrounds in R - ggplot Tutorial 5!
Hey, everyone! Welcome back to the fifth tutorial in our ggplot series. In a previous tutorial, I showed you how to change the scatter plot point colors in the plots that you…
@algoswithamber
0
11 months ago
stem
Customizing Color Palette - ggplot Tutorial 6
In a previous post, we learned how to automatically set color palettes for our plots in R using the ggsci package. We got some phenomenal results, but what if we want to manually…
@algoswithamber
0
11 months ago
STEMGeeks
Make Better Boxplots!! - ggplot Tutorial 7
Box plots are a powerful statistical tool that graphically represent five essential characteristics of your data: the minimum value, the maximum value, and the first, second…
@algoswithamber
0
11 months ago
STEMGeeks
Additional Box Plot Customization Options - ggplot Tutorial 8
In a previous video, we learned how to create a basic box pot, but in today's video we are going to go over a ton of cool customization options. By the end of this video you will…
@algoswithamber
0
11 months ago
STEMGeeks
Adding Custom Labels on Box Plots - ggplot Tutorial 9
Suppose you just created a beautiful box plot in the R programming language, but now you want to add the mean, the median, or some other statistic to each of your box plots. How…
@algoswithamber
0
11 months ago
STEMGeeks
Customizing Box Plot Panel Background - ggplot Tutorial 10
Hey everyone, and welcome back to the final tutorial in the series on customizing box plots using the R programming language. So far we have learned how to create a basic box…
@algoswithamber
0
11 months ago
Education
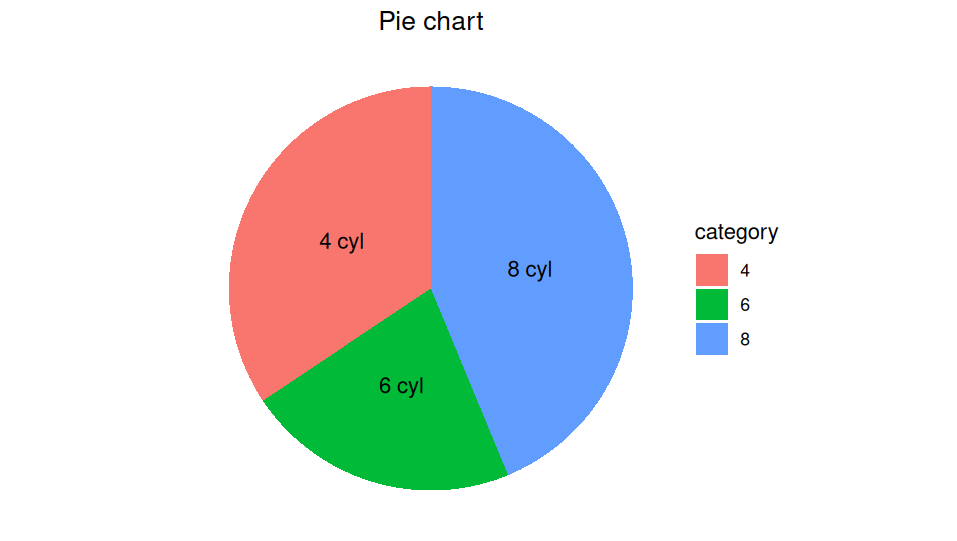
Perfecting Pie Charts in R🥧- ggplot Tutorial 11
Do you want to know something funny? The R programming language and the ggplot package are some of the most powerful data visualization software packages on the market, but there…
Menu
Explore
Curator's Pick
Trade
Trade STEM
Swap