Using real-time online preprocessed mouse tracking for lower storage and transmission costs (ending)
Result and discussion
Table 3 Example default mouse tracking data that can be seen in the database table. Column 1–3 are labels added using JavaScript, column 4 is the duration calculated from the difference between dates, and the rest of the columns are data retrieved from the DOM API
| ID | Name | Date 2019/3/01 | Duration | Left click | Right click | Middle click | Mouse X | Mouse Y | Scroll X | Scroll Y |
|---|---|---|---|---|---|---|---|---|---|---|
| 1 | Student 1 | 11:06:39 | 13.674 | False | False | False | 0 | 0 | 0 | 0 |
| 2 | Student 1 | 11:06:39 | 0.002 | False | False | False | 1197 | 317 | 0 | 0 |
| ... | ... | ... | ... | ... | ... | ... | ... | ... | ... | ... |
| 286511 | Student 23 | 14:44:09 | 0.002 | False | False | False | 1009 | 179 | 0 | 0 |
Table 4 Transmission server resource cost of three mouse tracking technique simulations. The first row are the mouse tracking method labels, the second row are the resource metric, and the first column are the statistical metrics
| Statistics | Default Mouse Tracking Simulation | ROI Tracking Simulation | Whole Page Tracking Simulation | ||||||
|---|---|---|---|---|---|---|---|---|---|
| CPU (%) | RAM (MB) | Data Rate (kB) | CPU (%) | RAM (MB) | Data Rate (kB) | CPU (%) | RAM (MB) | Data Rate (kB) | |
| Minimum | 0 | 2.88 | 0 | 0 | 1.75 | 0 | 0 | 1.58 | 0 |
| Maximum | 86 | 3.66 | 228.45 | 12 | 1.92 | 46.8 | 26 | 2.12 | 2.07 |
| Median | 3 | 3.29 | 5.62 | 0 | 1.86 | 0 | 0 | 2.07 | 0 |
| Average | 21.34 | 3.25 | 28.23 | 0.87 | 1.85 | 2.28 | 0.05 | 2.06 | 0.01 |
| Standard deviation | 29.09 | 0.25 | 36.8 | 1.24 | 0.06 | 5.05 | 0.46 | 0.04 | 0.08 |
Table 5 Example page tracking data that can be seen in the database table. Column 1, 2 are labels added using JavaScript, column 3 is the duration calculated from the difference between dates, and the rest of the columns are total value of data retrieved from the DOM API
| Name | Date 2019/3/01 | Duration (seconds) | Left clicks | Right clicks | Middle clicks | Mouse moves | Scrolls |
|---|---|---|---|---|---|---|---|
| Student 1 | 14:12:29 | 41 | 3 | 0 | 0 | 629 | 114 |
| Student 2 | 14:44:09 | 90 | 7 | 0 | 0 | 1176 | 137 |
| ... | ... | ... | ... | ... | ... | ... | ... |
| Student 22 | 11:55:14 | 2188 | 157 | 5 | 0 | 20912 | 6626 |
| Student 23 | 11:57:37 | 2236 | 323 | 0 | 0 | 17982 | 6930 |
Table 6 Example ROI tracking data that can be seen in the database table. Column 1 - 3 are labels added using JavaScript, column 4 is the duration calculated from the difference between dates, column 5 is the area manually labelled by the administrator and the rest of the columns are total value of data retrieved from the DOM API
| ID | Name | Date 2019/3/01 | Duration (second) | Area (x1,x2,y1,y2) | Left clicks | Right clicks | Middle clicks | Mouse moves | Scrolls |
|---|---|---|---|---|---|---|---|---|---|
| 1 | Student 1 | 11:06:39 | 14.148 | {“header”:[0,1920,0,64]} | 0 | 0 | 0 | 1 | 1 |
| 2 | Student 1 | 11:06:40 | 1.179 | {“quiz1”:[529,1900,291,570]} | 0 | 0 | 0 | 86 | 0 |
| ... | ... | ... | ... | ... | ... | ... | ... | ... | ... |
| 19062 | Student 23 | 14:44:09 | 0.002 | {“title”:[16,1904,150,270]} | 0 | 0 | 0 | 1 | 0 |
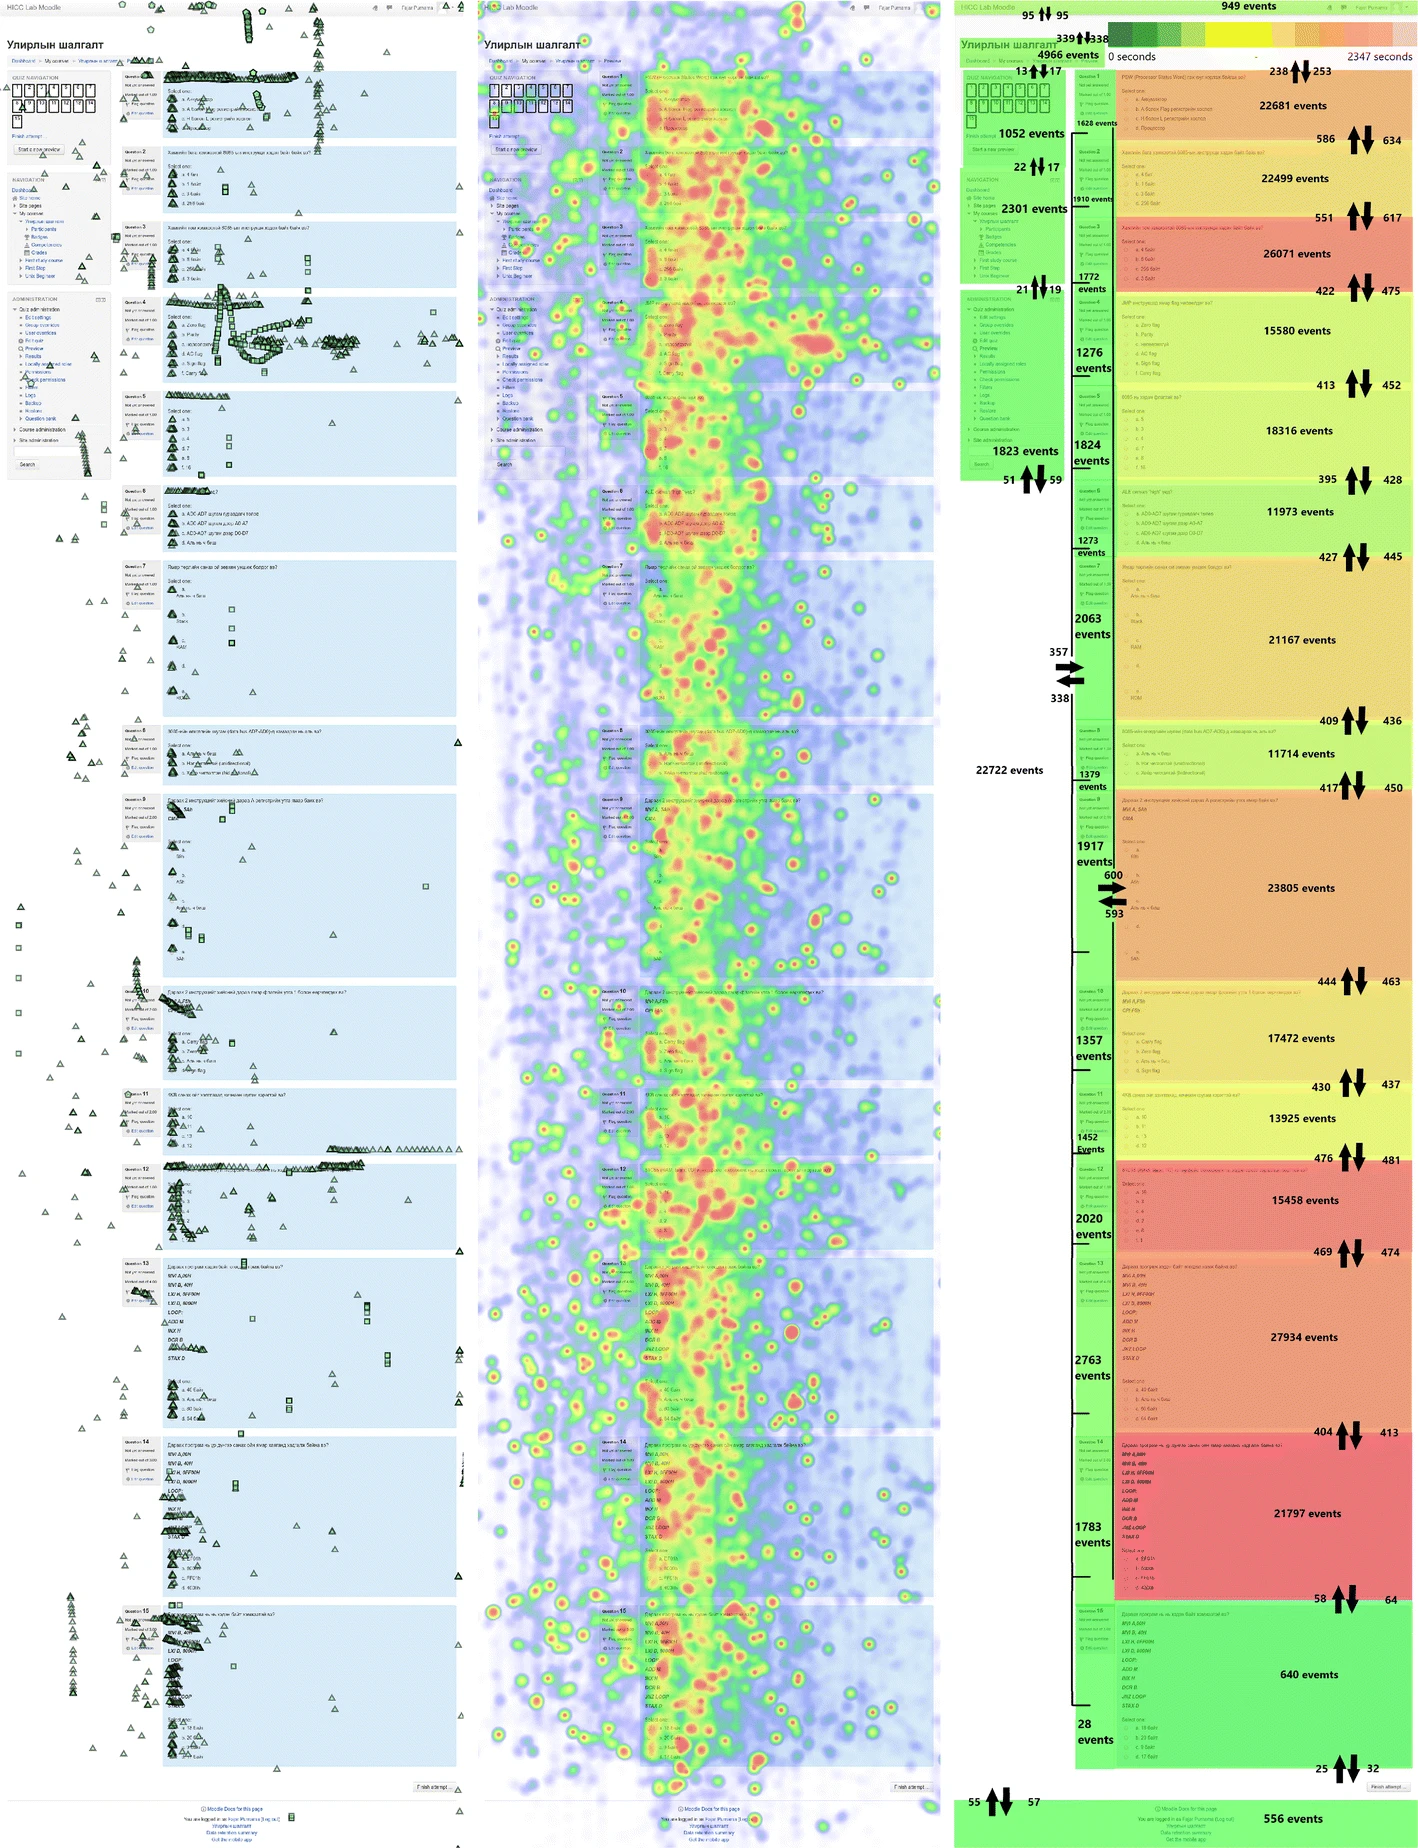
Fig. 7 Visualization of mouse tracking data. Default mouse tracking data can visualize exact points of location, the left image is click visualization and the middle image is a heatmap based on the duration the mouse cursor stays on each point, while ROI tracking can only visualize defined areas and show flows between areas shown on the right image
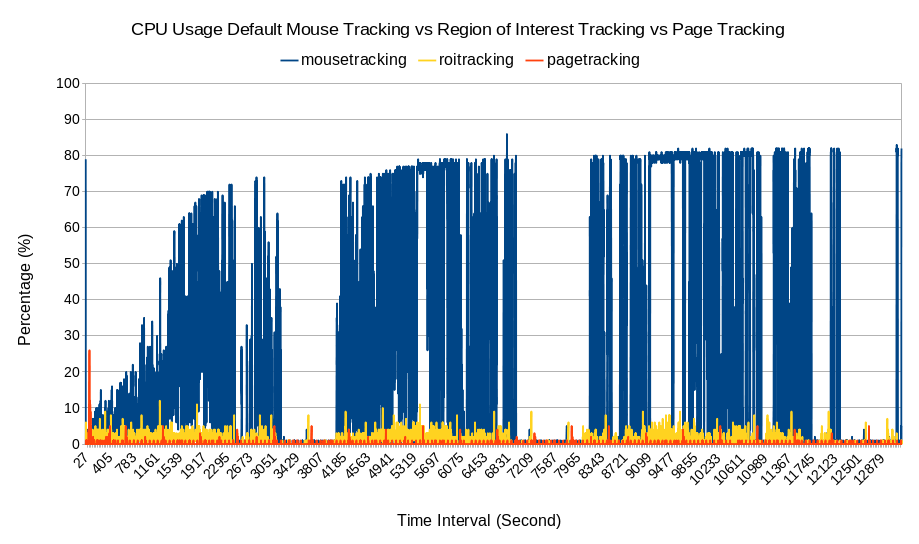
Fig. 8 CPU usage comparison between default mouse tracking, whole page tracking, and ROI tracking. The horizontal axis is the time interval. The vertical axis is the CPU usage in percentage
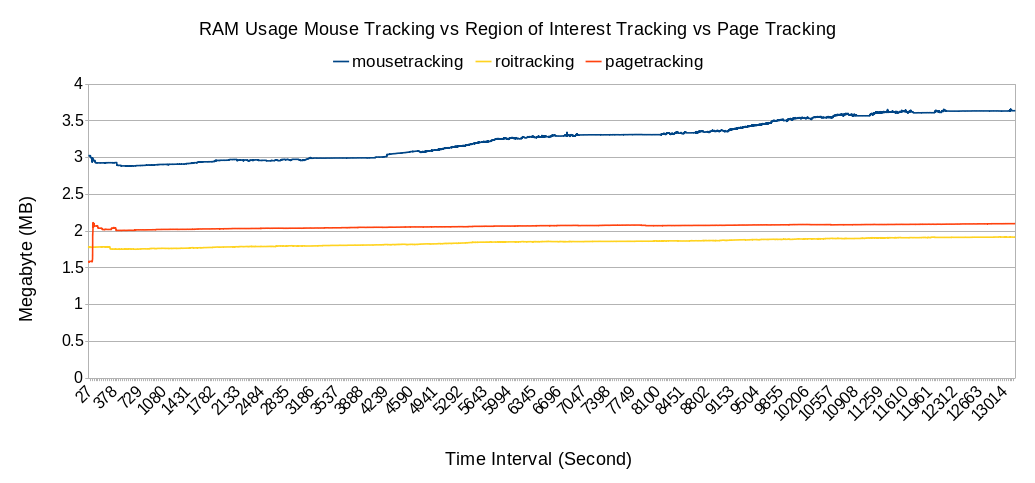
Fig. 9 RAM usage comparison between default mouse tracking, whole page tracking, and ROI tracking. The horizontal axis is the time interval. The vertical axis is the RAM usage in megabytes
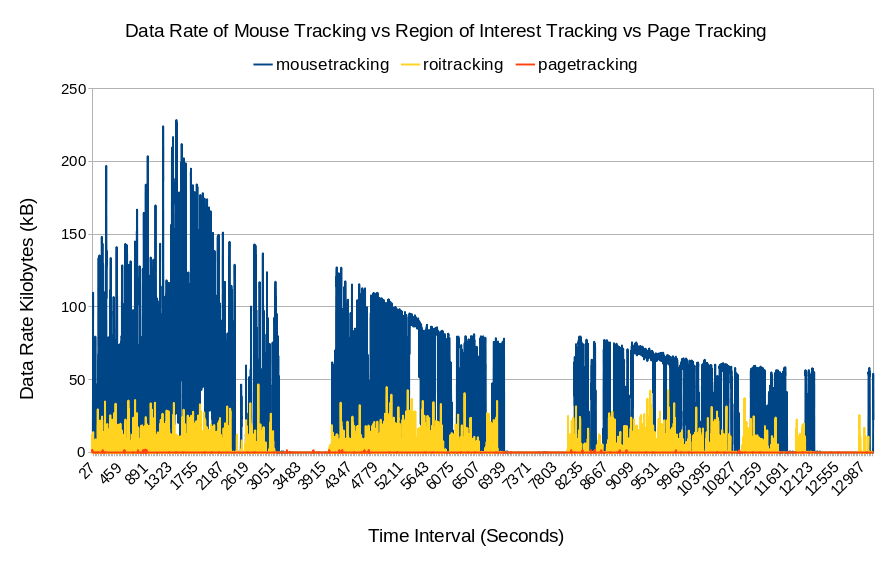
Fig. 10 Data rate comparison between default mouse tracking, whole page tracking, and ROI tracking.The horizontal axis is the time interval. The vertical axis is the data rate in kilobytes per second
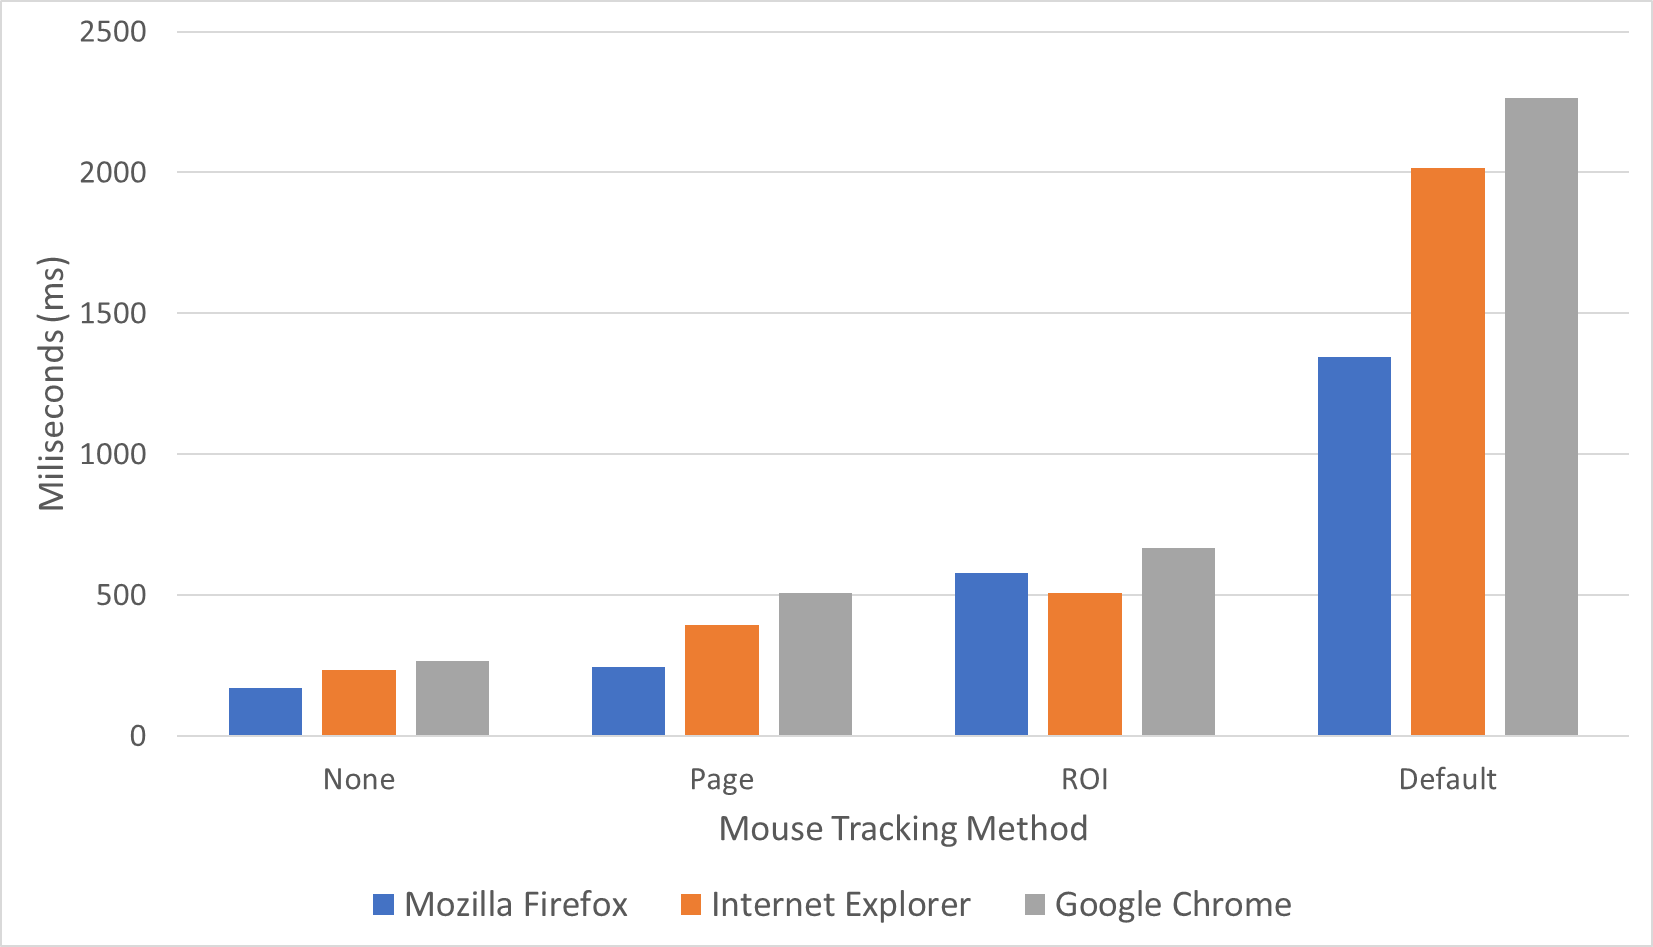
Fig. 11 The total script running time of three mouse tracking demo session by the author. The horizontal axis is the mouse tracking method. The data in order are from Mozila Firefox, Microsoft Edge, and Google Chrome. The vertical axis is the total running time in milliseconds. Among the three browsers Mozilla Firefox performs faster than Microsoft Edge and Internet Explore performs faster than Google Chrome for this work [60]
Default mouse tracking
It is well known that the advantage of default mouse tracking is the detailed and precise data it generates. An example is shown in Table 3. The exact x and y points of the locations of event occurrences, such as left clicks, right clicks, middle clicks, mouse movements, scrolls, zooms, and keyboard types, are recorded, including when and for how long each event occurs. Those geometrical data (x,y) make it possible to reproduce the mouse trajectory shown in Fig. 7, and adding the time information enables the trajectory’s replay.
The rumored disadvantage is the huge transmission and storage cost, and this seems to be true judging from Figs. 8, 9 and 10. For the 22 students in each session, the transmission resource cost statistics are shown in Table 4. The average data rate was 28 kilobytes per second (kBps) and was able to peak to 228 kBps. For the two sessions totalling 44 students, the data size was approximately 100 MB and Table 3 has 286511 rows. The CPU usage was hightly consumptive as well, while the RAM usage was not as consumptive. Even worse, mouse tracking is not a replacement for the existing logging method but rather an addition; in other words, it is expected to add an additional burden to the existing system if mouse tracking is implemented. These data were generated from a 2 1/2 h mouse tracking session; thus, imagine how much resource mouse tracking would consume if it were run on a university scale with thousands of students for 24 h daily. On the client the side, this method also shows the highest total JavaScript running in Fig. 11 among the other methods. It is suspected due to the large amount of HTTP Post to the server.
Webpage summarized mouse tracking
By omitting the geometrical data (x,y) and summarizing the numbers of events that occurred, the data became as small as possible, as shown in Figs. 8, 9, 10 (although they can be further reduced slightly by compression and removal of unnecessary characters and variables). The table was reduced to one row per webpage visit; in this case, Table 3 with 286511 rows was reduced to 26 rows, as shown in Table 5. As shown in Table 4, the data size was reduced from 100 MB to 16 kB. The average data rate was reduced from 28 kBps to 10 Bps. Although there is still RAM usage, CPU usage is slightly visible. Among the three mouse tracking methods mentioned in this work, this technique is the most advantageous in terms of resource cost. On the client the side, this method also shows the lowest total JavaScript running in Fig. 11 among the other methods. It is suspected due to the few amount of HTTP Post to the server.
However, the disadvantage compared to the three mouse tracking techniques is that it provides the poorest information that makes it impossible to create any visualizations, as shown in Fig. 7. The information tells only how many events (such as left clicks, right clicks, middle clicks, mouse movements, scrolls, zooms, and keyboard types) occurred and the length of time that the user spends on the webpage. Nevertheless, the information is richer than traditional logs, as shown in Table 5.
Region of interest mouse tracking
This technique is the best of the three, as the desired information is based on the analyst’s preferences, and there are lower resource costs than in the default mouse tracking shown in Figs. 8, 11. Analysts chooses the areas to be analyzed. In this case, the authors defined the following areas for the quiz session: header, title, menu, footer, and each question section. It can be seen in Fig. 7 that it is possible to create heatmaps of high activity areas, although it is not possible to create precise mouse trajectories as default mouse tracking, but it is possible to capture amounts of movement between areas. The duration is also based on each area. The data size is 5.4 MB with 19062 rows shown in Table 6. As shown in Table 4, the average data rate is 2.28 kBps and the average CPU and RAM usage are 0.87% and 1.85 MB which are lower than in default mouse tracking. Based on the algorithm of this method, the resource cost should be based on the number of defined areas, where the more areas, the larger the resource cost (note that default mouse tracking cost the largest because the webpage has been divided into the smallest possible areas, which are the x and y points of a webpage).
This technique is the best of the three, as the desired information is based on the analyst’s preferences, and there are lower resource costs than in the default mouse tracking shown in Figs. 8, 11. Analysts chooses the areas to be analyzed. In this case, the authors defined the following areas for the quiz session: header, title, menu, footer, and each question section. It can be seen in Fig. 7 that it is possible to create heatmaps of high activity areas, although it is not possible to create precise mouse trajectories as default mouse tracking, but it is possible to capture amounts of movement between areas. The duration is also based on each area. The data size is 5.4 MB with 19062 rows shown in Table 6. As shown in Table 4, the average data rate is 2.28 kBps and the average CPU and RAM usage are 0.87% and 1.85 MB which are lower than in default mouse tracking. Based on the algorithm of this method, the resource cost should be based on the number of defined areas, where the more areas, the larger the resource cost (note that default mouse tracking cost the largest because the webpage has been divided into the smallest possible areas, which are the x and y points of a webpage).
Conclusion and future work
Preprocessing mouse tracking data during real-time and online sessions helps reduce the storage and transmission costs and unexpectedly the JavaScript total running time on the client’s browser as well. The techniques presented in this work are whole page tracking and ROI tracking. Although the amount of reduced data is very dependent, there are fixed theories. The fixed theories are as follows: whole page tracking reduces the mouse tracking data into one row of tables per webpage visit, and ROI tracking reduces the data into one row of tables per area visit. Selecting the right technique can help reduce the storage and transmission costs while still obtaining the necessary data.
Although this concept works perfectly, but there are still problems with execution. Whole page tracking transmits the data only when the user leaves the page, and if the problems lie with the browser, there is currently no way to tell the user to wait before the transmission process finishes. There will definitely be cases where data are not fully transmitted. The problem for ROI tracking are that it cannot perform smart area definition and labelling. Normally, they are performed by humans. Therefore, one solution is to develop an artificial intelligence for this matter in the future.
Availability of data and materials
The datasets generated and/or analyzed during the current study are available in the Mendeley repository titled ’Data for: Implementation of Real-Time Online Mouse Tracking Case Study in a Small Online Quiz’ in ’Pre-processed Mouse Tracking Data’ directory [61]: Tables 3, 5, 6 data are available in file mouse_tracking_mongolia_anonymous.ods [62]. Figures 8, 9, 10 and Table 4 are based on files: cpurammousetracking.txt [63], cpurampagetracking.txt [64], cpuramroitracking.txt [65], mousetrackingsimulationpcapng [66], pagetrackingsimulationpcapng [67], roitrackingsimulationpcapng [68].
Abbreviations
- AdELEAdaptive: E-Learning via the eye tracking.AeLSEye tracking based adaptive and personalized e-learning systems.
- API: Application programming interface
- CPU: Central processing unit
- CSS: Cascading style sheets
- DOM: Document object model
- e5Learning: Enhanced exploitation of eyes for effective e-learning
- ESA: Eye tracking based emphatic software agen
- GB: Gigabyte
- GHz: Gigahertz
- HTML: Hyper Text Markup Language
- HTTP: Hyper text transfer protocol
- kBps: Kilobytes per second
- LMS: Learning management system
- MB: Megabyte
- MBps: Megabyte per second
- MVC: Model-view controller
- MVT: Model-view template
- NPM: Node package manager
- OGAMA: Open gaze and mouse analyzer
- POI: Point of interest.
- Protus: Programming tutoring system
- RAM: Random access memory
- ROI: Region of interest
- UI: User interface
- XML: Extensible Markup Language
References
- Wikipedia: Information age. https://en.wikipedia.org/wiki/Information_Age.
- Bluehost: Web analytics for beginners - presented by bluehost. https://youtu.be/PnVZ7_OA7Qo.
- Purnama F, Fungai A, Do TM, Siagian AHAM, Annas A, Susanto H, Hendarmawan Usagawa T, Nakano H. Introductory work on section based page view of web contents: towards the idea of how a page is viewed. In: 11th International Student Conference on Advanced Science and Technology (ICAST), p. 9–11 2016; Kumamoto University.
- Pernice KF-shaped pattern of reading on the web: misunderstood, but still relevant (even on mobile). Nielsen Norman Group. 2017.
- Holmqvist K, Wartenberg C. The role of local design factors for newspaper reading behaviour-an eye-tracking perspective. Lund Univ Cogn Stud. 2005;127:1–21.
- Lai M-L, Tsai M-J, Yang F-Y, Hsu C-Y, Liu T-C, Lee SW-Y, Lee M-H, Chiou G-L, Liang J-C, Tsai C-C. A review of using eyetracking technology in exploring learning from 2000 to 2012. Edu Res Rev. 2013;10:90–115.
- Cooke L. Is the mouse a “poor man’s eye tracker”? In: Annual Conference-Society for Technical Communication, 2006;53:p. 252
- Barrios VMG, Gütl C, Preis AM, Andrews K, Pivec M, Mödritscher F, Trummer C. Adele: A framework for adaptive e-learning through eye tracking. Proceedings of IKNOW. 2004;609–616.
- Zushi M, Miyazaki Y, Norizuki K. Web application for recording learners’ mouse trajectories and retrieving their study logs for data analysis. Knowl Manag E-Learn. 2012;4(1):37.
- Drusch G, Bastien J, Dinet J. From gaze plots to eye fxation patterns using a clustering method based on hausdorf distances. In: Proceedings of the 23rd Conference on l’Interaction Homme-Machine; 2011. p. 1. https://doi.org/10.1145/2044354.2044356. ACM
- Huang J, White RW, Dumais S. No clicks, no problem: using cursor movements to understand and improve search. In: Proceedings of the SIGCHI Conference on Human Factors in Computing Systems; 2011. p. 1225–1234. ACM.
- Manson SM, Kne L, Dyke KR, Shannon J, Eria S. Using eye-tracking and mouse metrics to test usability of web mapping navigation. Cartogr Geogr Inform Sci. 2012;39(1):48–60. https://doi.org/10.1559/1523040639148.
- Hsu T-C, Chang S-C, Liu N-C. Peer assessment of webpage design: behavioral sequential analysis based on eye tracking evidence. J Edu Technol Soc. 2018;21(2):305–21.
- Arroyo E, Selker T, Wei W. Usability tool for analysis of web designs using mouse tracks. In: CHI’06 extended abstracts on human factors in computing systems; 2006. p. 484–489 . https://doi.org/10.1145/1125451.1125557. ACM.
- Navalpakkam V, Churchill E. Mouse tracking: measuring and predicting users’ experience of web-based content. In: Proceedings of the SIGCHI Conference on Human Factors in Computing Systems; 2012. p. 2963–2972. https://doi.org/10.1145/2207676.2208705. ACM
- Rodden K, Fu X, Aula A, Spiro I. Eye-mouse coordination patterns on web search results pages. In: CHI’08 Extended Abstracts on Human Factors in Computing Systems; 2008. p. 2997–3002. ACM.
- Hariri RH, Fredericks EM, Bowers KM. Uncertainty in big data analytics: survey, opportunities, and challenges. J Big Data. 2019;6(1):44. https://doi.org/10.1186/s40537-019-0206-3.
- Barrachina AD, O’Driscoll A. A big data methodology for categorising technical support requests using hadoop and mahout. J Big Data. 2014;1(1):1. https://doi.org/10.1186/2196-1115-1-1.
- Rayner K. Eye movements in reading and information processing: 20 years of research. Psychol Bull. 1998;124(3):372.
- Mueller F, Lockerd A. Cheese: tracking mouse movement activity on websites, a tool for user modeling. In: CHI’01 Extended Abstracts on Human Factors in Computing Systems. 2001. p. 279–280. https://doi.org/10.1145/634067.634233. ACM
- Sungkur RK, Antoaroo MA, Beeharry A. Eye tracking system for enhanced learning experiences. Edu Inform Technol. 2016;21(6):1785–806. https://doi.org/10.1007/s10639-015-9418-0.
- Zheng C, Usagawa T. A rapid webcam-based eye tracking method for human computer interaction. In: 2018 International Conference on Control, Automation and Information Sciences (ICCAIS). 2018. p. 133–136. https://doi.org/10.1109/ICCAIS.2018.8570532. IEEE
- Pivec M, Trummer C, Pripf J. Eye-tracking adaptable e-learning and content authoring support. Informatica. 2006;30(1).
- Wang H, Chignell M, Ishizuka M. Empathic tutoring software agents using real-time eye tracking. In: Proceedings of the 2006 Symposium on Eye Tracking Research & Applications, 2006:73–78. https://doi.org/10.1145/1117309.1117346. ACM.
- Calvi C, Porta M, Sacchi D. e5learning, an e-learning environment based on eye tracking. In: Advanced Learning Technologies, 2008. ICALT’08. Eighth IEEE International Conference On. 2008.p. 376–380. https://doi.org/10.1109/ICALT.2008.35. IEEE.
- Wei H, Moldovan A-N, Muntean C. Sensing learner interest through eye tracking. Technology. 2009;22:23.
- Ivanović M, Klašnja-Milićević A, Ivković J, Porta M. Integration of eye tracking technologies and methods in an e-learning system. In: Proceedings of the 8th Balkan Conference in Informatics. 2017. p. 29. https://doi.org/10.1145/3136273.3136278. ACM.
- Rodrigues M, Gonçalves S, Carneiro D, Novais P, Fdez-Riverola F. Keystrokes and clicks: measuring stress on e-learning students. In: Management Intelligent Systems. Springer. 2013. p. 119–126. https://doi.org/10.1007/978-3-319-00569-0_15.
- Salmeron-Majadas S, Santos OC, Boticario JG. An evaluation of mouse and keyboard interaction indicators towards non-intrusive and low cost afective modeling in an educational context. Procedia Comput Sci. 2014;35:691–700. https://doi.org/10.1016/j.procs.2014.08.151.
- Harrati N, Bouchrika I, Tari A, Ladjailia A. Exploring user satisfaction for e-learning systems via usage-based metrics and system usability scale analysis. Comput Hum Behav. 2016;61:463–71. https://doi.org/10.1016/j.chb.2016.03.051.
- Purnama F, Sukhbaatar O, Choimaa L, Usagawa T. Implementation of real-time online mouse tracking on overseas quiz session from server administrator point of view. Educ Inform Technol. 2020;. https://doi.org/10.1007/s10639-020-10141-3.
- Purnama F. 0fajarpurnama0/Real-Time-Online-Mouse-Tracking-Animation. https://doi.org/10.5281/zenodo.2589338. https://github.com/0fajarpurnama0/Real-Time-Online-Mouse-Tracking-Animation
- Voßkühler A, Nordmeier V, Kuchinke L, Jacobs AM. Ogama (open gaze and mouse analyzer): open-source software designed to analyze eye and mouse movements in slideshow study designs. Behav Res Methods. 2008;40(4):1150–62. https://doi.org/10.3758/BRM.40.4.1150.
- Kieslich PJ, Henninger F. Mousetrap: an integrated, open-source mouse-tracking package. Behav Res Methods. 2017;49(5):1652–67. https://doi.org/10.3758/s13428-017-0900-z.
- Haije EG. Top 15 heatmapping tools you might want to try. https://mopinion.com/heatmapping-tools-you-might-want-to-try/
- Wood L, Le Hors A, Apparao V, Byrne S, Champion M, Isaacs S, Jacobs I, Nicol G, Robie J, Sutor R et al. Document object model (dom) level 1 specifcation. W3C Recomm. 1998;1
- Pixley T et al. Document object model (dom) level 2 events specifcation. W3C recommendation, November 2000
- Leiva LA, Huang J. Building a better mousetrap: compressing mouse cursor activity for web analytics. Inform Process Manag. 2015;51(2):114–29.
- Usagawa T, et al. Efectiveness of e-learning experience through online quizzes: a case study of myanmar students. Int J Emerg Technol Learn. 2018;13(12):157–76. https://doi.org/10.3991/ijet.v13i12.9114.
- Adekitan AI, Abolade J, Shobayo O. Data mining approach for predicting the daily internet data trafc of a smart university. J Big Data. 2019;6(1):11. https://doi.org/10.1186/s40537-019-0176-5.
- Bughin J. Big data, big bang? J Big Data. 2016;3(1):2. https://doi.org/10.1186/s40537-015-0014-3.
- Husain SS, Kalinin A, Truong A, Dinov ID. Socr data dashboard: an integrated big data archive mashing medicare, labor, census and econometric information. J Big Data. 2015;2(1):13. https://doi.org/10.1186/s40537-015-0018-z.
- Ahmad AK, Jafar A, Aljoumaa K. Customer churn prediction in telecom using machine learning in big data platform. J Big Data. 2019;6(1):28. https://doi.org/10.1186/s40537-019-0191-6.
- Sohangir S, Wang D, Pomeranets A, Khoshgoftaar TM. Big data: deep learning for fnancial sentiment analysis. J Big Data. 2018;5(1):3. https://doi.org/10.1186/s40537-017-0111-6.
- Dash S, Shakyawar SK, Sharma M, Kaushik S. Big data in healthcare: management, analysis and future prospects. J Big Data. 2019;6(1):54. https://doi.org/10.1186/s40537-019-0217-0.
- Bibri SE. On the sustainability of smart and smarter cities in the era of big data: an interdisciplinary and transdisciplinary literature review. J Big Data. 2019;6(1):25. https://doi.org/10.1186/s40537-019-0182-7.
- Rheem H, Verma V, Becker DV. Use of mouse-tracking method to measure cognitive load. Proceedings of the Human Factors and Ergonomics Society Annual Meeting. 2018;62:1982–6. https://doi.org/10.1177/1541931218621449. SAGE Publications Sage CA: Los Angeles
- Li L-Y, Tsai C-C. Accessing online learning material: quantitative behavior patterns and their efects on motivation and learning performance. Comput Educ. 2017;114:286–97.
- Koh KH, Fouh E, Farghally MF, Shahin H, Shafer CA. Experience: learner analytics data quality for an etextbook system. J Data Inform Qual. 2018;9(2):10. https://doi.org/10.1145/3148240.
- Purnama F, Fungai A, Usagawa T. Demonstration on extending the pageview feature to page section based: towards identifying reading patterns of users. In: 7th International Conference on Science and Engineering. Yangon Technological University. 2016. p. 304–307
- Ornbo G. Sams teach yourself node. Js in 24 h: sams teac your node 24 h. Indianapolis: Sams Publishing; 2012.
- Contributors V. What is V8? https://v8.dev
- StrongLoop, IBM. Other expressjs.com contributors: express, a fast, unopinionated, minimalist web framework for Node.js. https://expressjs.com
- Microsoft: JavaScript that scales. https://www.typescriptlang.org
- Django. The web framework for perfectionists with deadlines. https://www.djangoproject.com
- Hansson DH. Working with JavaScript in rails. https://guides.rubyonrails.org/v4.1/working_with_javascript_in_rails.html
- Laravel. The PHP framework for web artisans. https://laravel.com
- Facebook: synthetic event. https://reactjs.org
- Google: one framework. Mobile and Desktop. https://angular.io
- u-double-u: SPEED-BATTLE statistics and browser comparison: Windows NT 10.0. http://www.speed-battle.com/statistics_e.php
- Purnama F, Sukhbaatar O, Choimaa L, Usagawa T. Data for: implementation of real-time online mouse tracking case study in a small online quiz [Pre-processed Mouse Tracking Data/]. Mendeley Data, v3. 2020;. https://doi.org/10.17632/vznyfcx9xk.3.
- Purnama F, Sukhbaatar O, Choimaa L. Data for: implementation of real-time online mouse tracking case study in a small online quiz [Pre-processed Mouse Tracking Data/mouse_tracking_mongolia_anonymous.ods]. Mendeley Data, v2. 2020;. https://doi.org/10.17632/vznyfcx9xk.2.
- Purnama F, Sukhbaatar O, Choimaa L, Usagawa T. Data for: implementation of real-time online mouse tracking case study in a small online quiz [Pre-processed Mouse Tracking Data/cpu-ram-mousetracking.txt]. Mendeley Data, v2. 2020;. https://doi.org/10.17632/vznyfcx9xk.2.
- Purnama F, Sukhbaatar O, Choimaa L, Usagawa T. Data for: implementation of real-time online mouse tracking case study in a small online quiz [Pre-processed Mouse Tracking Data/cpu-ram-pagetracking.txt]. Mendeley Data, v2. 2020;. https://doi.org/10.17632/vznyfcx9xk.2.
- Purnama F, Sukhbaatar O, Choimaa L, Usagawa T. Data for: implementation of real-time online mouse tracking case study in a small online quiz [Preprocessed Mouse Tracking Data/cpu-ram-roitracking.txt]. Mendeley Data, v2. 2020;. https://doi.org/10.17632/vznyfcx9xk.2.
- Purnama F, Sukhbaatar O, Choimaa L, Usagawa T. Data for: implementation of real-time online mouse tracking case study in a small online quiz [Pre-processed Mouse Tracking Data/mousetracking-simulation.pcapng].Mendeley Data, v2. 2020; https://doi.org/10.17632/vznyfcx9xk.2.
- Purnama F, Sukhbaatar O, Choimaa L, Usagawa T. Data for: Implementation of Real-Time Online Mouse Tracking Case Study in a Small Online Quiz [Pre-processed Mouse Tracking Data/pagetracking-simulation.pcapng]. Mendeley Data, v2. https://doi.org/10.17632/vznyfcx9xk.2
- Purnama F, Sukhbaatar O, Choimaa L, Usagawa T. Data for: implementation of real-time online mouse tracking case study in a small online quiz [Preprocessed Mouse Tracking Data/roitrackingsimulation.pcapng]. Mendeley Data, v2. https://doi.org/10.17632/vznyfcx9xk.2
Acknowledgements
The authors would like to express their deepest gratitude to Otgontsetseg Sukhbaatar, Lodoiravsal Choimaa, and their students for participating in the mouse tracking quiz session. This manuscript has been proofread by Springer Nature Author Services.
Funding
Part of this work was supported by JSPS KAKENHI Grant-in-Aid for Scientific Research 19K1225100 and 15H02795.
Author information
Fajar Purnama and Tsuyoshi Usagawa are contributed equally to this work
Affiliations
Graduate School of Science and Technology, Kumamoto University, 2 Chome-39-1, Kurokami, Chuo Ward, Kumamoto, 860-8555, Japan Fajar Purnama & Tsuyoshi Usagawa
Contributions
Both the authors have participated since the beginning of the work. The main author wrote the manuscript, and the co-author revised the manuscript. Both authors read and approved the final manuscript.
Authors’ information
FP is currently a doctoral student at Graduate School of Science and Technology, Kumamoto University. His research area is in the field of educational technology. TU joined Kumamoto University in 1983 right after he received an M.E. degree from Tohoku University. In 1988, he received a Dr. Eng. from Tohoku University. Since 2004 he has been a professor, and he is a member of the IEEE, ASA, ASJ, INCE/J, JSET, and JSAI. He is interested in e-learning contents and systems, and acoustic signal processing.
Corresponding author
Correspondence to Fajar Purnama.
Ethics declarations
Competing interests
The authors declare that they have no competing interests.
Additional information
Publisher's Note
Springer Nature remains neutral with regard to jurisdictional claims in published maps and institutional affiliations.
Mirror
- https://www.publish0x.com/0fajarpurnama0/using-real-time-online-preprocessed-mouse-tracking-for-lower-xpjnqmd?a=4oeEw0Yb0B&tid=hive
- https://0fajarpurnama0.github.io/doctoral/2020/06/01/preprocess-realtime-online-mouse-tracking-big-data
- https://medium.com/@0fajarpurnama0/using-real-time-online-preprocessed-mouse-tracking-for-lower-storage-and-transmission-costs-8d5b39dbe699
- https://hicc.cs.kumamoto-u.ac.jp/~fajar/doctoral/preprocess-realtime-online-mouse-tracking-big-data
- https://0fajarpurnama0.tumblr.com/post/619737085175332865/using-real-time-online-preprocessed-mouse-tracking
- https://0darkking0.blogspot.com/2020/06/using-real-time-online-preprocessed.html
- https://0fajarpurnama0.cloudaccess.host/index.php/uncategorised/47-using-real-time-online-preprocessed-mouse-tracking-for-lower-storage-and-transmission-costs
- http://0fajarpurnama0.weebly.com/blog/using-real-time-online-preprocessed-mouse-tracking-for-lower-storage-and-transmission-costs
- https://0fajarpurnama0.wixsite.com/0fajarpurnama0/post/using-real-time-online-preprocessed-mouse-tracking-for-lower-storage-and-transmission-costs
Congratulations @fajar.purnama! You have completed the following achievement on the Hive blockchain and have been rewarded with new badge(s) :
You can view your badges on your board And compare to others on the Ranking
If you no longer want to receive notifications, reply to this comment with the word
STOPDo not miss the last post from @hivebuzz:
Support the HiveBuzz project. Vote for our proposal!