Implementation of real-time online mouse tracking on overseas quiz session From server administrator point of view (beginning pre-print)
Note
If you just want to see the mouse tracking demonstration, it is available of most of my blogs that I can write JavaScript in, and the source code is on Github.
The original article is copyright under © Springer Nature Switzerland AG, Part of Springer Nature:
- Authors are Fajar Purnama (me), Otgontsetseg Sukhbaatar, Lodoiravsal Choimaa, and Tsuyoshi Usagawa.
- Title of the article is Implementation of real-time online mouse tracking on overseas quiz session From server administrator point of view.
- Published in Education and Information Technologies, Online First, Page 1-22, 6 March 2020, DOI is 10.1007/s10639-020-10141-3.
- Available at https://link.springer.com/article/10.1007/s10639-020-10141-3.
This is Author's pre-print which is the submitted version or before the peer review process. The copyright was transferred from Fajar Purnama to Springer Science+Business Media, LLC, part of Springer Nature and stated in the copyright transfer that "Author(s) retain the right to make the pre-print available on their own personal, self-maintained website. Springer not only encourages pre-print sharing, but even allow to license it as creative commons, therefore I license this post as customized CC-BY-SA where you are also allowed to sell my contents but with a condition that you must mention that the free and open version is available here. In summary, the mention must contain the keyword "free" and "open" and the location such as the link to this content.
As I am the author, I can say that there is significant difference between before and after peer review version. Springer is kind enough to allow sharing of the authors' accepted version (AAM) 12 months after publication which will be 6 March 2021. However, we can open it faster if you are interested.
Springer offers open access/CC-BY at a price where for this article, it costs €2170, $2750 or £1,870. For example, anyone can freely republish my previous article because it is open access. You are able to donate in cryptocurrency (includes BAT and bittube), paypal, alipay, JavaScript mining, etc, and I will apply for open access once threshold is reached where I will store the donation in a crypto wallet and I will show the balance on a webpage.
I do highly recommend to contact me before donating where you can find my social media links on my donation page but with technology today, I cannot stop you from donating so make sure to contact me so that I can list you on the donator list. Beware of scams, my recommendation is to contact me and book or delay your donation. Once enough people are interested, I will contact you back on the same exact window. If there's a comment section here, you can book your donation in the comment
Abstract
Mouse tracking serves as an alternative to eye tracking in measuring the learning process in education because of its affordability. Moreover, mouse tracking does not require extra hardware, as in the case of eye tracking, because it is a feature in personal computers by default. Therefore, it is possible to implement mouse tracking in a massive open scale. However, mouse tracking has only been implemented in a laboratory setting to date, ostensibly because of the associated extremely high running costs. Nonetheless, there is no available data to support the claim of high resource costs, which has resulted in much speculation among implementers. In general, the implementation of mouse tracking in a non-laboratory environment is still rare. Therefore, the authors developed an application to investigate real-time mouse tracking online. It was implemented on the Moodle learning management system and tested on an online quiz session accessed abroad. Additionally, the application can handle tracking on mobile devices. In this work, the main resources that include CPU, network, RAM, and storage costs were measured when mouse tracking was used. These results can serve as a reference for network and server administrators during future implementation of this technique. It was determined that the characteristics of mouse activities were dynamic in that occasional surges and lulls were observed. If mouse tracking data are not aggregated and transmitted as a single data package, then mouse tracking can be implemented on a large scale.
Introduction
With the recent advances in technology, including the Internet, information can be searched and published with few restrictions. With the advancement in information communication technology (ICT), more activities are being conducted online. Individuals no longer spend hours staring at computer screens after work or class; instead, they often use their mobile devices to stay online irrespective of the time or their physical location. (Dentzel, 2013). Unlike in the past where individuals were limited to local newspapers, televisions, and textbooks, people can now easily search and choose the information they want using advanced search engines such as Bing, DuckDuckGo, Google, and Yahoo. In the case of social networking services (SNS) such as Facebook, Instagram, Line, and Twitter, individuals can get the latest news, interact with one another, open discussions, and share information. Users can enjoy entertainment such as viewing photographs, listening to music, and watching videos using services such as Dailymotion, Metacafe, and Youtube. In addition, video games are also available. Shopping is also facilitated by online merchants such as Aliexpress and Amazon, where individuals can order items and have them delivered. All of these online activities can be performed using a computer device connected to the Internet.
Education has also benefitted from the Internet and courses can be delivered blended (Paturusi et al., 2012) or fully online (Wen and Rosé, 2014). A variety of learning and teaching activities can be performed outside the classroom, for example, the reading of learning material, discrete discussion in forums, submission of assignments, and the performance of exercises (Linawati et al., 2017). This greatly reduces the burden on both students and teachers. The number of higher education institutions that provides online education is increasing, and it is only a matter of time before primary and secondary schools (Sopu et al., 2016) follow this model. Implementing an online course is currently much easier than in the past because of the advent of learning management systems (LMS) where most processes are automated (Kakasevski et al., 2008) without the need for advanced knowledge on computers and web programming (Chourishi et al., 2011); only computer literacy is a prerequisite. The next step after implementing online courses is the implementation of massive open online courses (MOOC) (Drake et al., 2015). Unlike regular online courses, everyone can join MOOC, which is not limited to students of certain institutions.
With the option of numerous online activities, many studies have become interested in analyzing these activities in an area known as online analytics. Online analytics records who, where, and when associated with online activities. The most popular metrics are total traffic, source traffic, bounce rate (the rate of people immediately leaving the page after visiting), and conversion rate (whether the page fulfills its purpose) (Bluehost, 2016). Whether it is a public website or an online course, the concept is almost the same. On a public website, the number of page views, comments, ratings, image views, videos played, and items bought are recorded. Based on page views only, a variety of analyses can be performed. A page view can predict a user’s demographic (Hu et al., 2007), characterize an audience in terms of preference for news, multimedia, games, or adult content (Kumar and Tomkins, 2010). It can also predict whether a user is at risk on visiting malicious websites (Canali et al., 2014). Page views also provide hints on how to improve a website’s design, for example moving popular webpage links to the header (Khan et al., 2018). There are already many web analytics software available such as Google Analytics, Open Web Analytics, Piwik, and Cloudflare (spa, 2019). In online courses, logins, learning materials viewed, discussions, assignments submissions, quizzes attempt, and grades are recorded (moo, 2016). They can reveal for example a student’s level of activity (Nandi et al., 2011), how difficult the quizzes are for students (Nakano et al., 2005; Usagawa et al., 2006), and even identify failing students (Fungai and Usagawa, 2016). Usually, these data are used to measure the learning performance of students (Wen and Rosé, 2014).
Although those popular metrics can measure learning performance, there is a limit when it comes to measuring the actual learning process (Zushi et al., 2012). As such, the what, when, and where can be measured in detail, but not the how (Purnama et al., 2016a). To obtain more detailed measurements, it is necessary to record the time spent viewing a page (Li and Tsai, 2017). To obtain detailed information, the time spent viewing each section of a page can be recorded (Koh et al., 2018). One of the most common approaches is to divide a page into subpages (Lee et al., 2009) or to insert tracker codes into sections of the page (Purnama et al., 2016b). More powerful approaches involve eye-tracking (Pernice, 2017) and mouse tracking (Henrie et al., 2015; Koh et al., 2018), which can provide more information than just time spent viewing particular sections.
Eye tracking is arguably one of the most accurate methods for recording the viewing activity of users, but the financial cost is very high, thereby confining the technology to lab environments (Lai et al., 2013). Although mouse tracking is not as accurate, the financial cost is low in comparison. No additional devices are needed to perform mouse tracking, which can be implemented by anyone who has a computer. Most people own computers and with the increasing availability of the Internet, it is possible to perform massive scale mouse tracking implementation (Huang et al., 2011). Therefore, mouse tracking can be implemented outside of the laboratory in places such as classrooms, online learning, and websites. Recently, web mouse tracking software such as Mouseflow, ClickTale, ClickHeat, and Sessioncam has emerged (NT, 2015).
Unfortunately, another obstacle must be overcome before widespread implementation of mouse tracking can be achieved. This is related to the resource cost, especially for personal implementation. It is rumored that the resource cost for maintaining mouse tracking (eye tracking as well) is notoriously high, and therefore classified as Big Data (Sin and Muthu, 2015). However, the rumors were not confirmed. Furthermore, mouse tracking resource cost was never discussed in detail. Leiva and Huang (2015) state that a mouse swipe from left to right can generate hundreds of cursor coordinates and a mouse activity over a minute can generate 1 MB (megabyte) of data. That is the only information related to mouse tracking resource cost that was presented in their article. Discussions on these matters are very few, which has been unhelpful to implementers. Therefore, this work investigates the popular resource costs of mouse tracking including a computer processing unit (CPU), data rate, random access memory (RAM), and storage. A real-time online mouse tracking application was developed that can be implemented on any website. In this case, it was demonstrated on a quiz session on Moodle LMS. The source code is available on Github (Authors, 2019a). The implementation and resource measurement took place for three events: solo measurements in a laboratory, local testing by five people of a quiz session in a laboratory, and an overseas quiz session by students of classroom size in Mongolia, accessing a server in Japan.
This article is divided into six chapters. The first chapter is the introduction that includes background information on online activities and popular analytics, mouse tracking, and the problem of mouse tracking implementation as previously described. The second chapter is the literature review in which the results of several interesting studies in the field of eye tracking and mouse tracking are presented. Mainly, this chapter shows that there are promising results, which have generated interest and excitement, in these fields. The last part of this chapter discusses the state-of-the-art of this work. The third chapter is the system overview that discusses the real-time online mouse tracking application, developed as a part of this work, and mainly considers its operation and features. The fourth chapter is the experiment and implementation that explains the hardware and tools used, subjects, and the procedures of the experiment and their implementation. The fifth chapter presents the results and discussion on the mouse tracking data that was collected, sample analysis, and the resource costs from both calculated and profiled measurements. The sixth chapter is the conclusion, which summarizes the main findings.
Literature Review
Eye Tracking
Rayner (1998) reviewed many articles regarding eye movements spanning from 1971–1998 and claimed that eye tracking technologies existed since then. The most fundamental aspect of eye movements are fixation and saccade, where fixation is the process of fixing the gaze to a certain region of interest (ROI), and saccade is the process of moving the gaze to another ROI. However, it is up to the examiner to interpret eye movements, for example, eye movements can provide information about the user’s attention, interest, and state of mind. Eye tracking has been researched in the field of pattern recognition whether in a non-digital environment (Holmqvist and Wartenberg, 2005; Holsanova et al., 2006) or digital environment (Hyönä et al., 2002; Liu, 2005; Duggan and Payne, 2011; Jarodzka et al., 2017), search engine result page (SERP) (Rodden and Fu, 2007; Rodden et al., 2008; Huang et al., 2011, 2012), web evaluation and usability (Ehmke and Wilson, 2007; Buscher et al., 2009; Tzafilkou and Protogeros, 2017; Hsu et al., 2018), and visual search (Rayner, 2009; Dragunova et al., 2017).
In the category of learning, Lai et al. (2013) reviewed eye movement research in seven themes including pattern of information processing, effects of instructional design, reexamination of existing theories, individual differences, effects of learning strategies, patterns of decision making, and conceptual development. They concluded that the eye-tracking method provides a promising channel for educational researchers to connect learning outcomes to cognitive processes. Many educational researchers gained interest in the application of eye tracking in the process of learning and teaching, especially in online learning, which can make up for the lack of emotional connection between students and teachers (Cantoni et al., 2012). For example, eye tracking can capture signs of comprehension difficulties, cognitive stress, or tiredness of students during online learning, which a good teacher is able to perform during face-to-face learning.
In e-learning, eye tracking has been integrated into the online framework where the eye tracking hardware captures eye movement on the client, transmits the eye movement data to the server, then processes the data for direct analysis or to implement interactivity. Finally, the data are kept in storage.
- One of the earliest eye tracking implementation research in e-learning and online learning was Adaptive E-Learning via the Eye Tracking (AdELE) framework (Barrios et al. 2004; Pivec et al. 2006). The framework provides adaptive, integrated, and real-time eye tracking during e-learning processes. Real-time eye tracking can yield spontaneous interaction or interactivity in students. For example, it can detect tiredness and instruct the user to take a break.
- Wang et al. (2006) integrated eye tracking to an emphatic software agent (ESA) in online education. Eye tracking captures the state of awareness of the learners and responds accordingly. For example, when the learner views a topic and interest is detected, the ESA provides positive feedback. When the learner looks away often, the ESA queries the learner on their level of interest.
- Calvi et al. (2008) developed e5Learning (enhanced exploitation of eyes for effective e-learning) which is a system that consists of three main components: (1) monitoring of accessed screen, areas/history recorder where the author can set the ROI to capture the extent of gazing, (2) contextual content generator whereby a certain content is visible after the user spends a certain amount of time on an ROI, (3) emotion recognizer.
- Wei et al. (2009) integrated eye tracking into traditional Adaptive and Personalized e-Learning Systems (AeLS). Usually, the user’s learning profile is generated based on questionnaires. In eye tracking based AeLS, eye tracking is used to capture the interest of users to generate the customized learning profiles.
- Ivanović et al. (2017) integrated eye tracking into Programming Tutoring System (Protus) which is an intelligent system that can adapt content based on the learning style of the user. Similar to the work of Wei et al. (2009), the learning styles of the users are usually determined via questionnaires. In this case, eye tracking is utilized to identify the users’ learning styles.
Other than being integrated into the online learning framework, eye tracking is often utilized without adaptability and interactivity, simply as a tool to analyze specific characteristics of the learners and to perform post actions based on this analysis (Rakoczi and Pohl, 2012; Lupu and Ungureanu, 2013). Examples of utilizations include obtaining the cognitive (Eger, 2018) and emotional state of the users (Cantoni et al., 2012), evaluation of instructional design (Jarodzka and Brand-Gruwel, 2017; Yang et al., 2018) and user interface design (UID) (Ramakrisnan et al., 2012; Chivu et al., 2018), pattern recognition (Alhasan et al., 2018; Parikh and Kalva, 2018), strategic patterns (Tsai et al., 2012; Busjahn et al., 2014), etc.
Until now, eye tracking has yet to be implemented on a large scale because of hardware limitations. Almost all eye tracking articles cited herein are based on experiments in laboratory environments where separate and usually expensive eye tracking hardware is utilized. Most of these articles express confidence in the eventual reduction in cost and affordability of eye tracking hardware and the expectation that eye tracking will be implemented on a large scale in the future. In recent years, few researchers have attempted to fulfill these expectations, for example, Sungkur et al. (2016) and Zheng and Usagawa (2018) developed eye tracking in web cameras. As almost all modern laptops are equipped with a web camera, and most people including students own laptops, eye tracking in a web camera is a key aspect in the quest for large-scale implementation.
Mouse Tracking
Although most researchers prefer eye-tracking data, many mouse tracking articles have noted that mouse tracking is a viable alternative because eye tracking technology is too expensive and inconvenient (Cooke, 2006). There are investigators who have attempted to correlate mouse tracking to eye tracking by utilizing exploratory studies (Rodden et al., 2008), correlation analysis (Chen et al., 2001; Rodden et al., 2008; Voßkühler et al., 2008; Liebling and Dumais, 2014; Demšar and Çöltekin, 2017), or prediction (Guo and Agichtein, 2010; Johnson et al., 2012; Huang et al., 2012; Navalpakkam and Churchill, 2012) to demonstrate the inaccuracy involved in correlation mouse tracking data to eye tracking data. In contrast, there is also active research that treats mouse tracking data independently (Navalpakkam and Churchill, 2012). There are also other rare studies that attempt to direct the eye gaze to the mouse cursor by restricting the user’s field of vision, thereby coupling the mouse tracking data with the eye tracking data (Tarasewich et al., 2005; Lagun and Agichtein, 2011; Maruya et al., 2015; Kim et al., 2017). Similar to eye tracking, mouse tracking is also conducted in the area of pattern recognition, search engine result page (SERP) (Rodden and Fu, 2007; Rodden et al., 2008; Guo and Agichtein, 2008; Huang et al., 2011, 2012; Lagun et al., 2014; Arapakis and Leiva, 2016), web evaluation and usability (Arroyo et al., 2006; Navalpakkam and Churchill, 2012; Manson et al., 2012), and education.
In the field of education, recent articles emphasize the need to record the time spent on a learning activity to obtain the user’s behavior patterns (Li and Tsai, 2017). Koh et al. (2018) emphasize the need to record the time spent on a particular section of a learning activity because the time spent on an entire page does not reflect the actual learning time given that the time spent on different sections varies. The authors further stated that mouse trajectories and scrolling can be used to determine the time spent on a particular section, although the capability of mouse tracking is more than simply being able to determine the time spent on a particular section. Mouse tracking can be used record the trajectories, velocities, and many other variables of the mouse’s cursor that can be used to measure many things including cognitive load (Rheem et al., 2018). However, the data generated by mouse tracking can be overwhelming to examine, although this is no longer a major problem because there are many data mining and visualization applications that can be used to extract meaningful information from the data of the users (Poon et al., 2017).
The earliest article on mouse tracking implementation was presented by Mueller and Lockerd (2001), whereas in e-learning, the earliest article was presented around the year 2012.
- Zushi et al. (2012) implemented a web application that can record mouse trajectories for an English jumbled-word question where the learners are asked to match the jumbled-words with the appropriate Japanese translation. Their contributions were: (1) recording mouse events including durations, coordinates, and events, (2) recording the events specifically for their system including English words activated, English words selected into a group, and drag & drop, (3) replay and visualizations of mouse trajectories and events, and (4) interpretation of the mouse data and statistical analysis such as correlation analysis and clustering. In the end, they achieved their objective of analyzing the learning process whereas other systems were only able to analyze the learning outcome.
- Rodrigues et al. (2013) also emphasize the learning process and non-intrusive data gathering, but their research focused on the identification of the stress levels of students in e-learning. They implemented mouse and keyboard tracking in Moodle where they captured the click accuracy, click duration, amount of movement, mouse movement, mouse clicks, and keyboard strokes. They attempted to create a controlled experiment where one group was set to be normal, while the other group was set to be stressed. In the end, they obtained mouse and keyboard profile comparisons for the stressed and non-stressed users and established that stressed users exhibited a drastic increase in all actions including key down, key up, mouse down, mouse up, mouse wheel, and mouse movement.
- A similar study was performed by Salmeron-Majadas et al. (2014) but with different indicators including affective states (degree of valence, for example pleasure versus displeasure and degree of arousal for example high versus low activation) and behavior changes using the Self-Assessment-Manikin scale. Their article also stated that mouse and keyboard tracking methods are non-intrusive and low cost. Their objective was to generate automatic affective states and behavior change identifier from mouse and keyboard logs by exploiting machine learning.
- Harrati et al. (2016) also utilize mouse and keyboard tracking on Moodle, although their purpose was not to measure the learning process but to measure the usability of Moodle, whether it is easy to use or not. They stated that using the System Usability Scale (SUS) was insufficient for measuring the usability of Moodle. Therefore, they added the number of clicks, task duration, cursor distance, and completion rate to their measurements. The authors collected mouse and keyboard data of lecturers as they performed tasks on Moodle including login, visiting course section, visiting module upload section, and uploading a module.
As shown in the preceding, there are many interesting works on mouse tracking; however, very few have investigated the implementation and resource costs associated with the process, which has caused implementers to doubt the feasibility of large-scale implementation. Huang et al. (2011) conducted a massive scale mouse tracking on Microsoft’s Bing search engine. By reducing the amount of mouse trajectories recorded their massive scale experiment succeeded. However, they only discussed the data analysis afterward and neglected to consider the resource costs. Leiva and Huang (2015) and Martín-Albo et al. (2016) addressed the issue but their discussion quickly shifted to the solution, which is primarily based on compression methods. To date, there are no articles, except this, that consider the resource costs of mouse tracking implementation.
Real-time Online Mouse Tracking System Overview
Framework
The mouse tracking application developed by the authors was designed to run online and in real-time. Online means that the mouse tracking is run remotely via the Internet where the client runs the mouse tracking application when browsing a webpage and the associated data is sent to the server. Real-time means that the mouse tracking data is continuously sent by the client to the server during the mouse tracking process. Overall, this can be seen in the real-time online mouse tracking framework on Fig. 1.
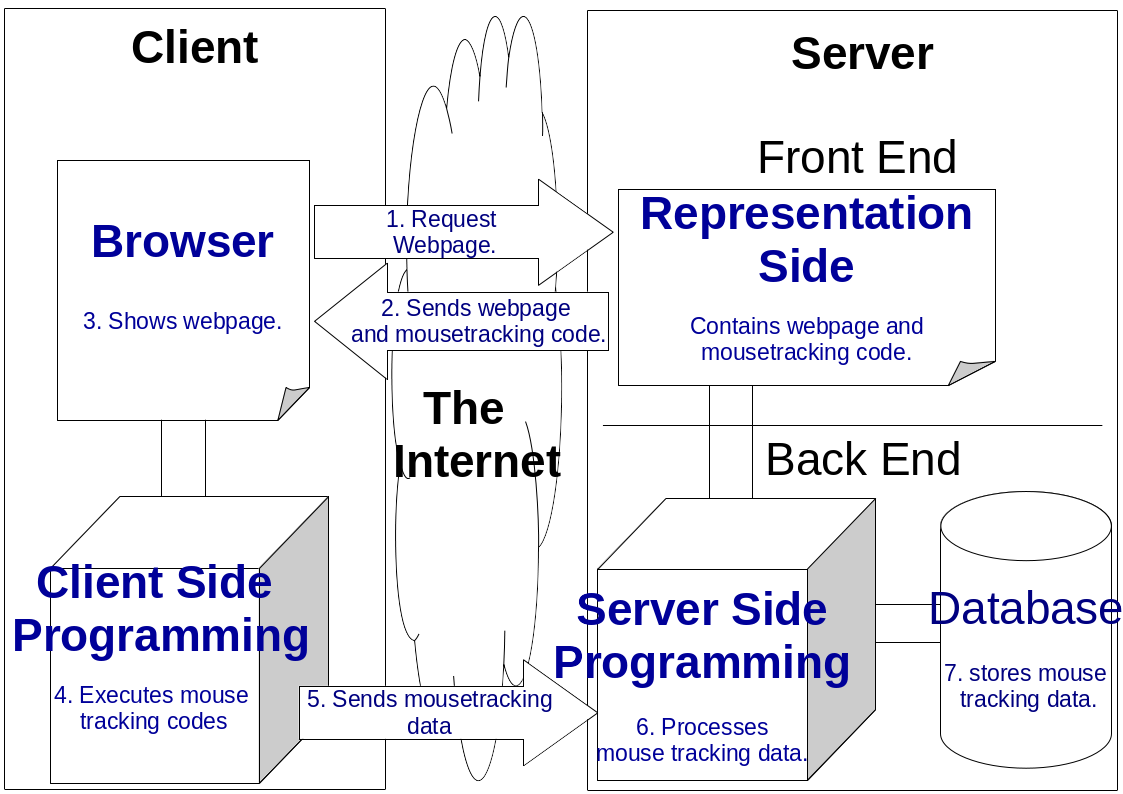
Fig. 1. Real-time Online Mouse Tracking Framework. The Framework is divided into two sides where one side is the client and the other side is the server. The client and the server are connected via the Internet. The server contains the front end, which is usually the representation side of the website, and back end where background processing and data storing occurs. There is a browser on the client equipped with client-side programming. The arrow presents the direction of the processes and the number presents the order of the processes
The mouse tracking process is illustrated on Fig. 1. Firstly, the client requests the webpage from the server. Secondly, the server sends the webpage mainly in Hypertext Markup Language (HTML) and Cascading Style Sheets (CSS) embedded with the mouse tracking code written in client-side programming language. The client-side programming language used in this work is jQuery, which is a JavaScript (JS) library designed to simplify HTML Document Object Model (DOM) tree traversal and manipulation, as well as event handling, CSS animation, and Asynchronous JS and XML (Ajax) (jsf, 2019). Thirdly, the client’s browser views the retrieved webpage (HTML and CSS). Fourthly, the client’s browser executes the mouse tracking code. The clients actually have full control over the mouse tracking process because the programming is client-side based. However, they are usually unaware of this because the mouse tracking runs in the background. They would have to thoroughly inspect the background area to control the mouse tracking process. However, most clients do not attempt to perform this task. This is the reason why mouse tracking is considered non-intrusive. Fifthly, the mouse tracking code contains post methods to transmit the data to the server. The author designed the mouse tracking code to transmit data on each event (clicks, moves, scrolls, etc.) immediately (real-time). Sixthly, the server using server-side programming language receives the post data and connects to the database. In this work, the server-side programming language used is Hypertext Preprocessor (PHP) because Moodle and most other LMS are written in PHP. Finally, the mouse tracking data is stored on the database in form of Structured Query Language (SQL).
Application
The mouse tracking application developed as part of this work is a standalone application that can be implemented either on the server or on the client. In the case of the former, the mouse tracking code is incorporated into the webpage. A webpage mainly contains HTML, CSS, and JS. A more direct approach is to inject the mouse tracking code in the JS code. Another approach is to create a plugin for a certain content management system (CMS) or LMS. In this work, a Moodle mouse tracking plugin was developed, which can be in the form of an admin plugin, theme plugin, or a block plugin shown as shown in Fig. 2. A theme plugin usually applies to entire Moodle pages managed by the administrator while a block plugin applies to selected pages usually managed by managers and teachers.
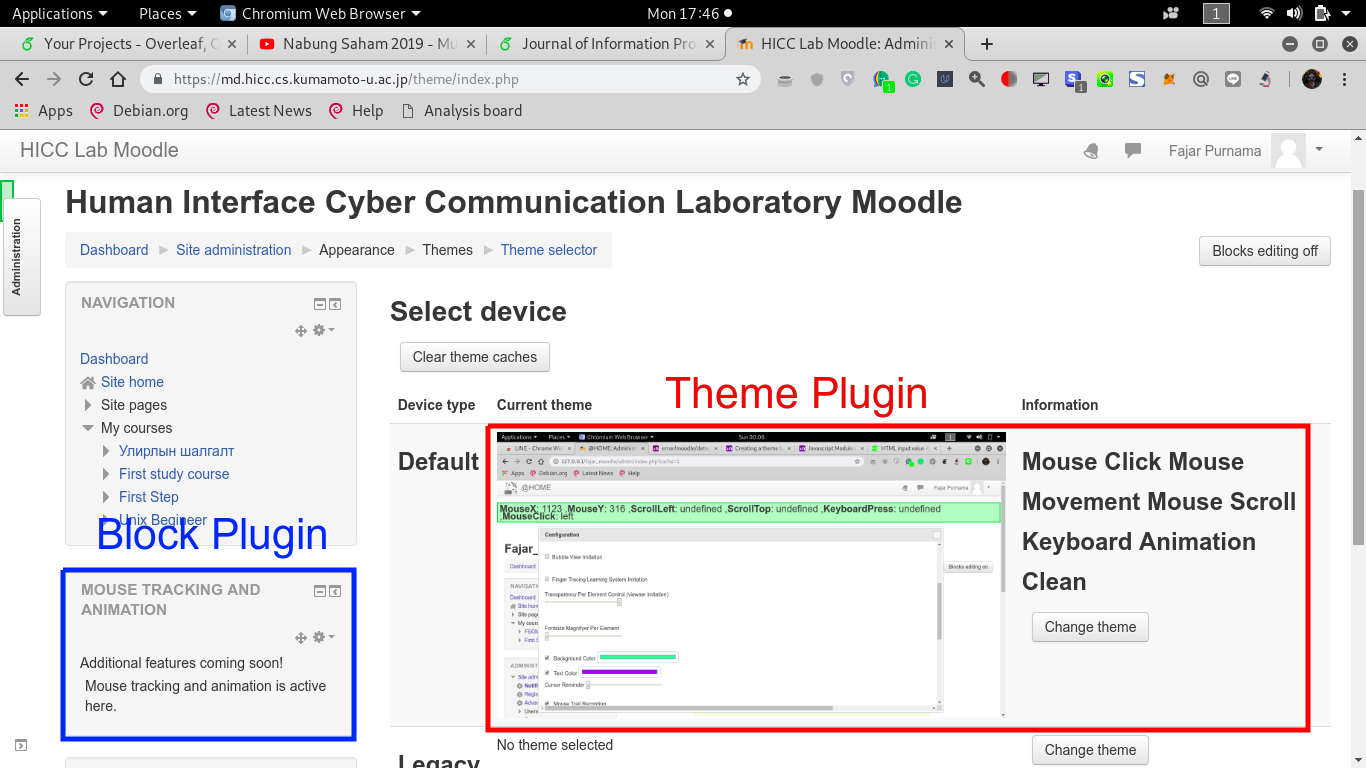
Fig. 2. Mouse Tracking Plugin on Moodle. The figure shows examples of mouse tracking implemented as a block plugin (in blue) and theme plugin (in red).
The mouse tracking Moodle plugin was implemented on the authors’ laboratory server, which can be accessed on https://md.hicc.cs.kumamoto-u.ac.jp. The authors planned to publish the Moodle plugin on Moodle’s website in the future. To implement the application on the client, the mouse tracking code is incorporated into the browser’s code. This can be achieved by direct insertion or plugin installation. Fig. 3 shows a mouse tracking browser extension installed on Google’s Chrome Browser. The authors plan to publish the extension in Chrome stores and other online stores.
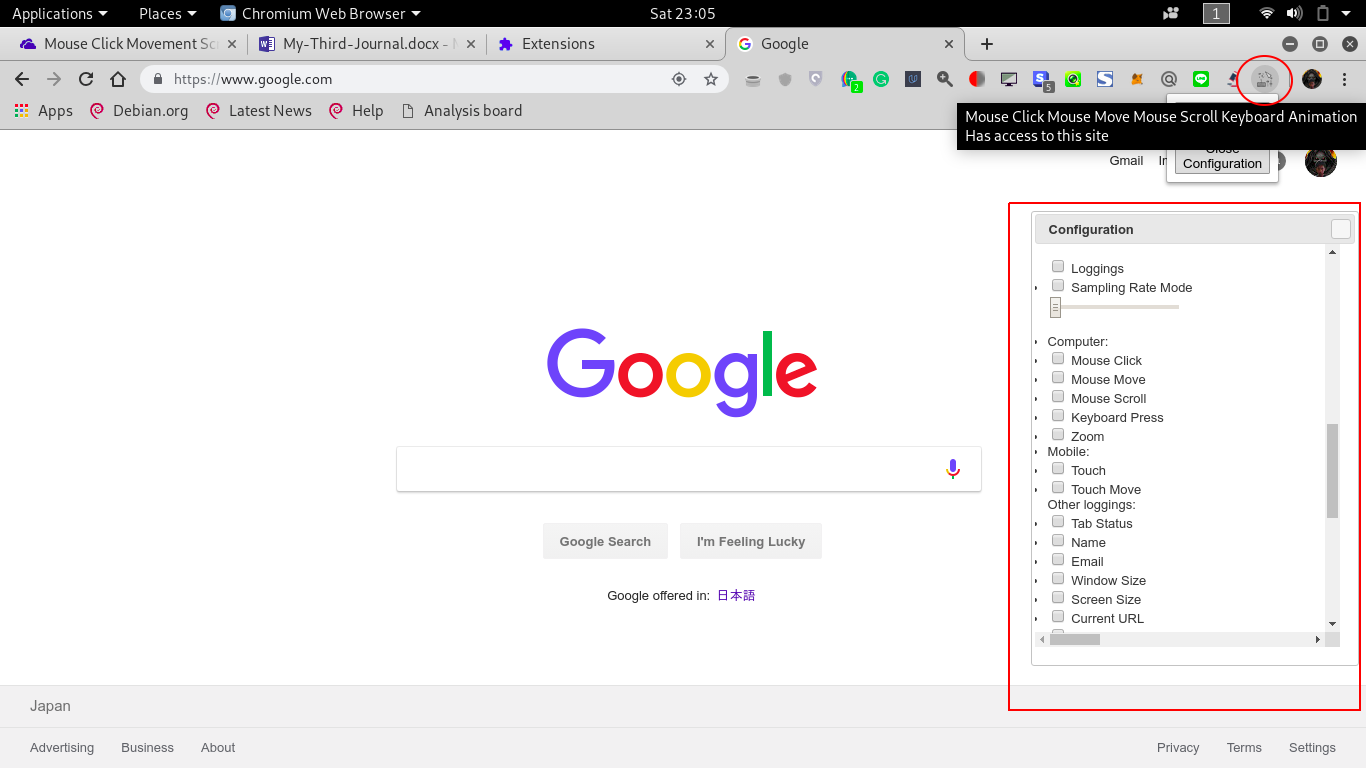
Fig. 3. Mouse Tracking Chrome extension. The mouse tracking extension is visible on the extension bar. The user can open the configuration window by clicking the icon and config. the events (clicks, moves, scrolls) to record.
Implementation on a server is more efficient because the mouse tracking code is only installed on the server, whereas implementation on the client requires installation on each client. However, server implementation limits the mouse tracking process to the server’s website only. The authors were able to identify users as they visited or left the website but were unable to perform tracking once the users left the website. In comparison, client implementation facilitates the recording of every detail of the browser activity of users, including mouse tracking on all visited websites.
Features
In this section, the main features of the real-time online mouse tracking application are reviewed in detail. The guide for writing the code is available on jQuery’s website (jsf, 2019). Tracking is divided into the main event logging and other information loggings. A simple keyboard logging was also implemented. For mobile devices, a mouse is rarely used, therefore tracking of scrolls, touches, and zooms is preferred. Fig. 4 shows a demonstration of the loggings that are available online (Authors, 2019a).
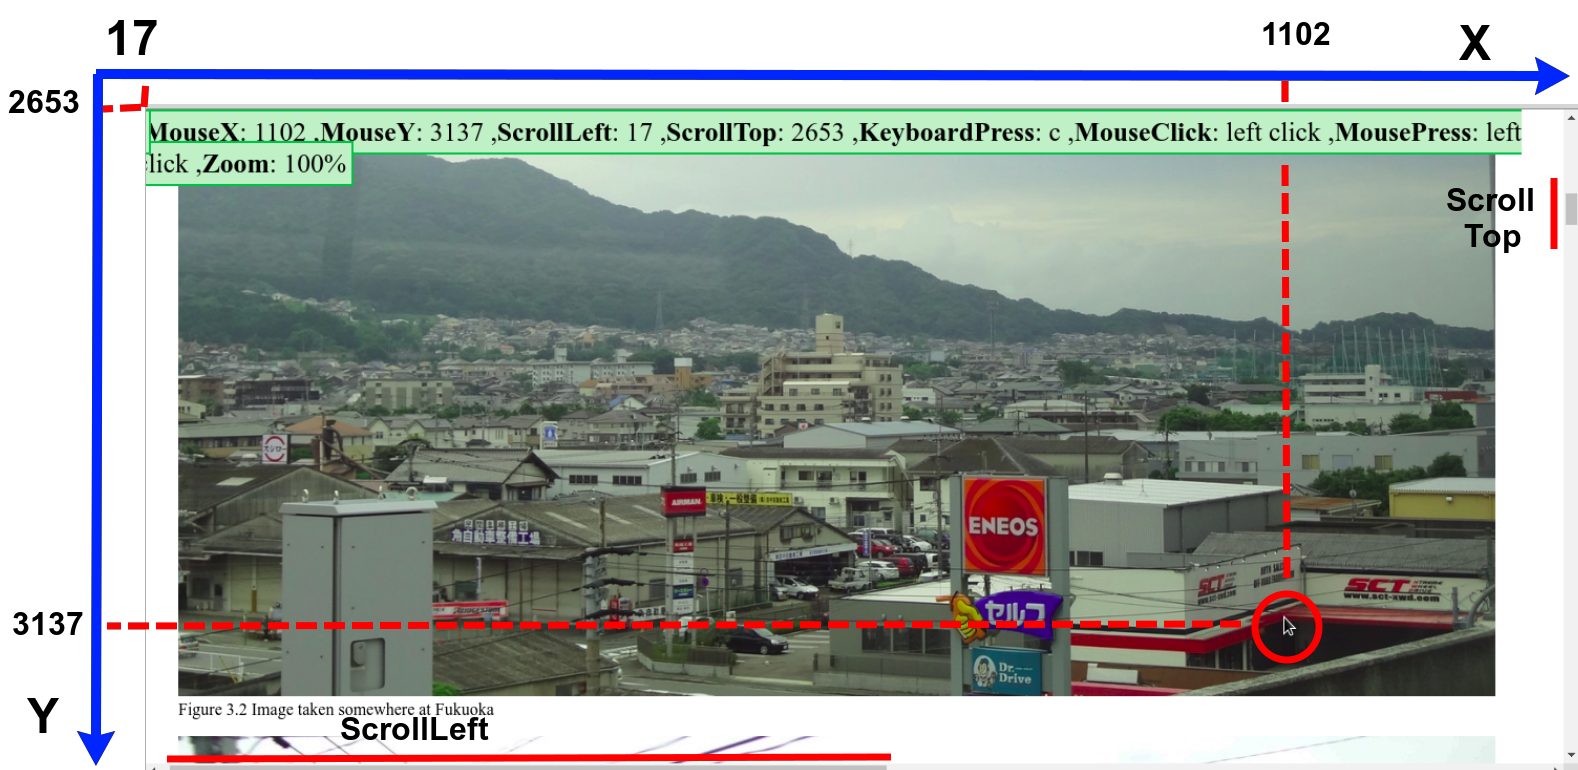
Fig. 4. Mouse tracking demonstration. MouseX shows “1102,” which is the horizontal axis value of the mouse cursor position, while MouseY shows “3137,” which is the vertical axis value. ScrollLeft shows “17,” which is the horizontal axis value of the horizontal scroll bar position, while ScrollTop shows “2653,” which is the vertical axis value of the vertical scroll bar position. KeyboardPress shows “c,” which was pressed. MouseClick shows “left click,” which was pressed. Zoom showed “100%,” which is the default. It should be noted that all the coordinates are relative to the entire document and not the screen or the window. It is also seen that the top vertical value axis of the image is not zero. The zero value is still far above where scrolling up is necessary.
Event Loggings
- Mouse Click; The recording of mouse clicks acquires data on the depression and release of the mouse buttons, along with the coordinate of the occurrence in pixels. The events can be left, middle, and/or right click. Before the recording of mouse trajectories, mouse click recordings were practiced. Currently, the recording of mouse clicks is still more popular than mouse trajectories.
- Mouse Move; Mouse move is the same as mouse trajectories. The recording of mouse moves acquires data on the coordinate (horizontal axis and vertical axis) of the mouse cursor in pixels. Mouse move can also be combined with mouse press, which results in mouse drag. Among other event loggings, mouse move consumes the highest resource.
- Scroll; The recording of scrolls acquires data on the current topmost and left most scroll position in pixels. Some users do not frequently move the mouse cursor but move the scroll often, in which case the scroll data is more valuable than the mouse movement data. This is particularly true for users of mobile devices where there is no mouse cursor, fewer touches, and a greater reliance on scrolling.
- Keyboard press; The recording of keyboard press acquires data on the buttons pressed by the users. Like mouse click, keyboard press recordings were practiced before mouse trajectory recordings. Currently, keyboard recordings are more popular than mouse trajectory recordings. However, keyboard press recordings are notorious for misuse and malicious activities such as password thief. As such, extra care regarding privacy must be exercised when implementing keyboard press recordings; for example, the non-implementation of keyboard press recordings on login pages.
- Zoom; The recording of zoom acquires data on the long-shot or close-up activity of users as a percentage value. The formula is the window dimension divided by the screen dimension (explained in other loggings: sections) multiplied by one hundred percent. Users usually utilize zooming when an element is too big or too small. In addition, zooming is most frequently used on mobile devices.
- Touch; The recording of touch acquires the press and release data of the touch screen, along with the coordinate of the occurrence. The events can be touched, untouched, and interrupted. Touch recordings are exclusively for touch devices; mostly mobile devices. A demonstration is shown in Fig. 5.
- Touch Move; The recording of touch move acquires data on movement during the touch event along with the coordinate of the occurrence. It is the same as touch drag because the movement can only be recorded when the user touches the touch screen. In addition, touch move occurs mostly during the dragging of an object.
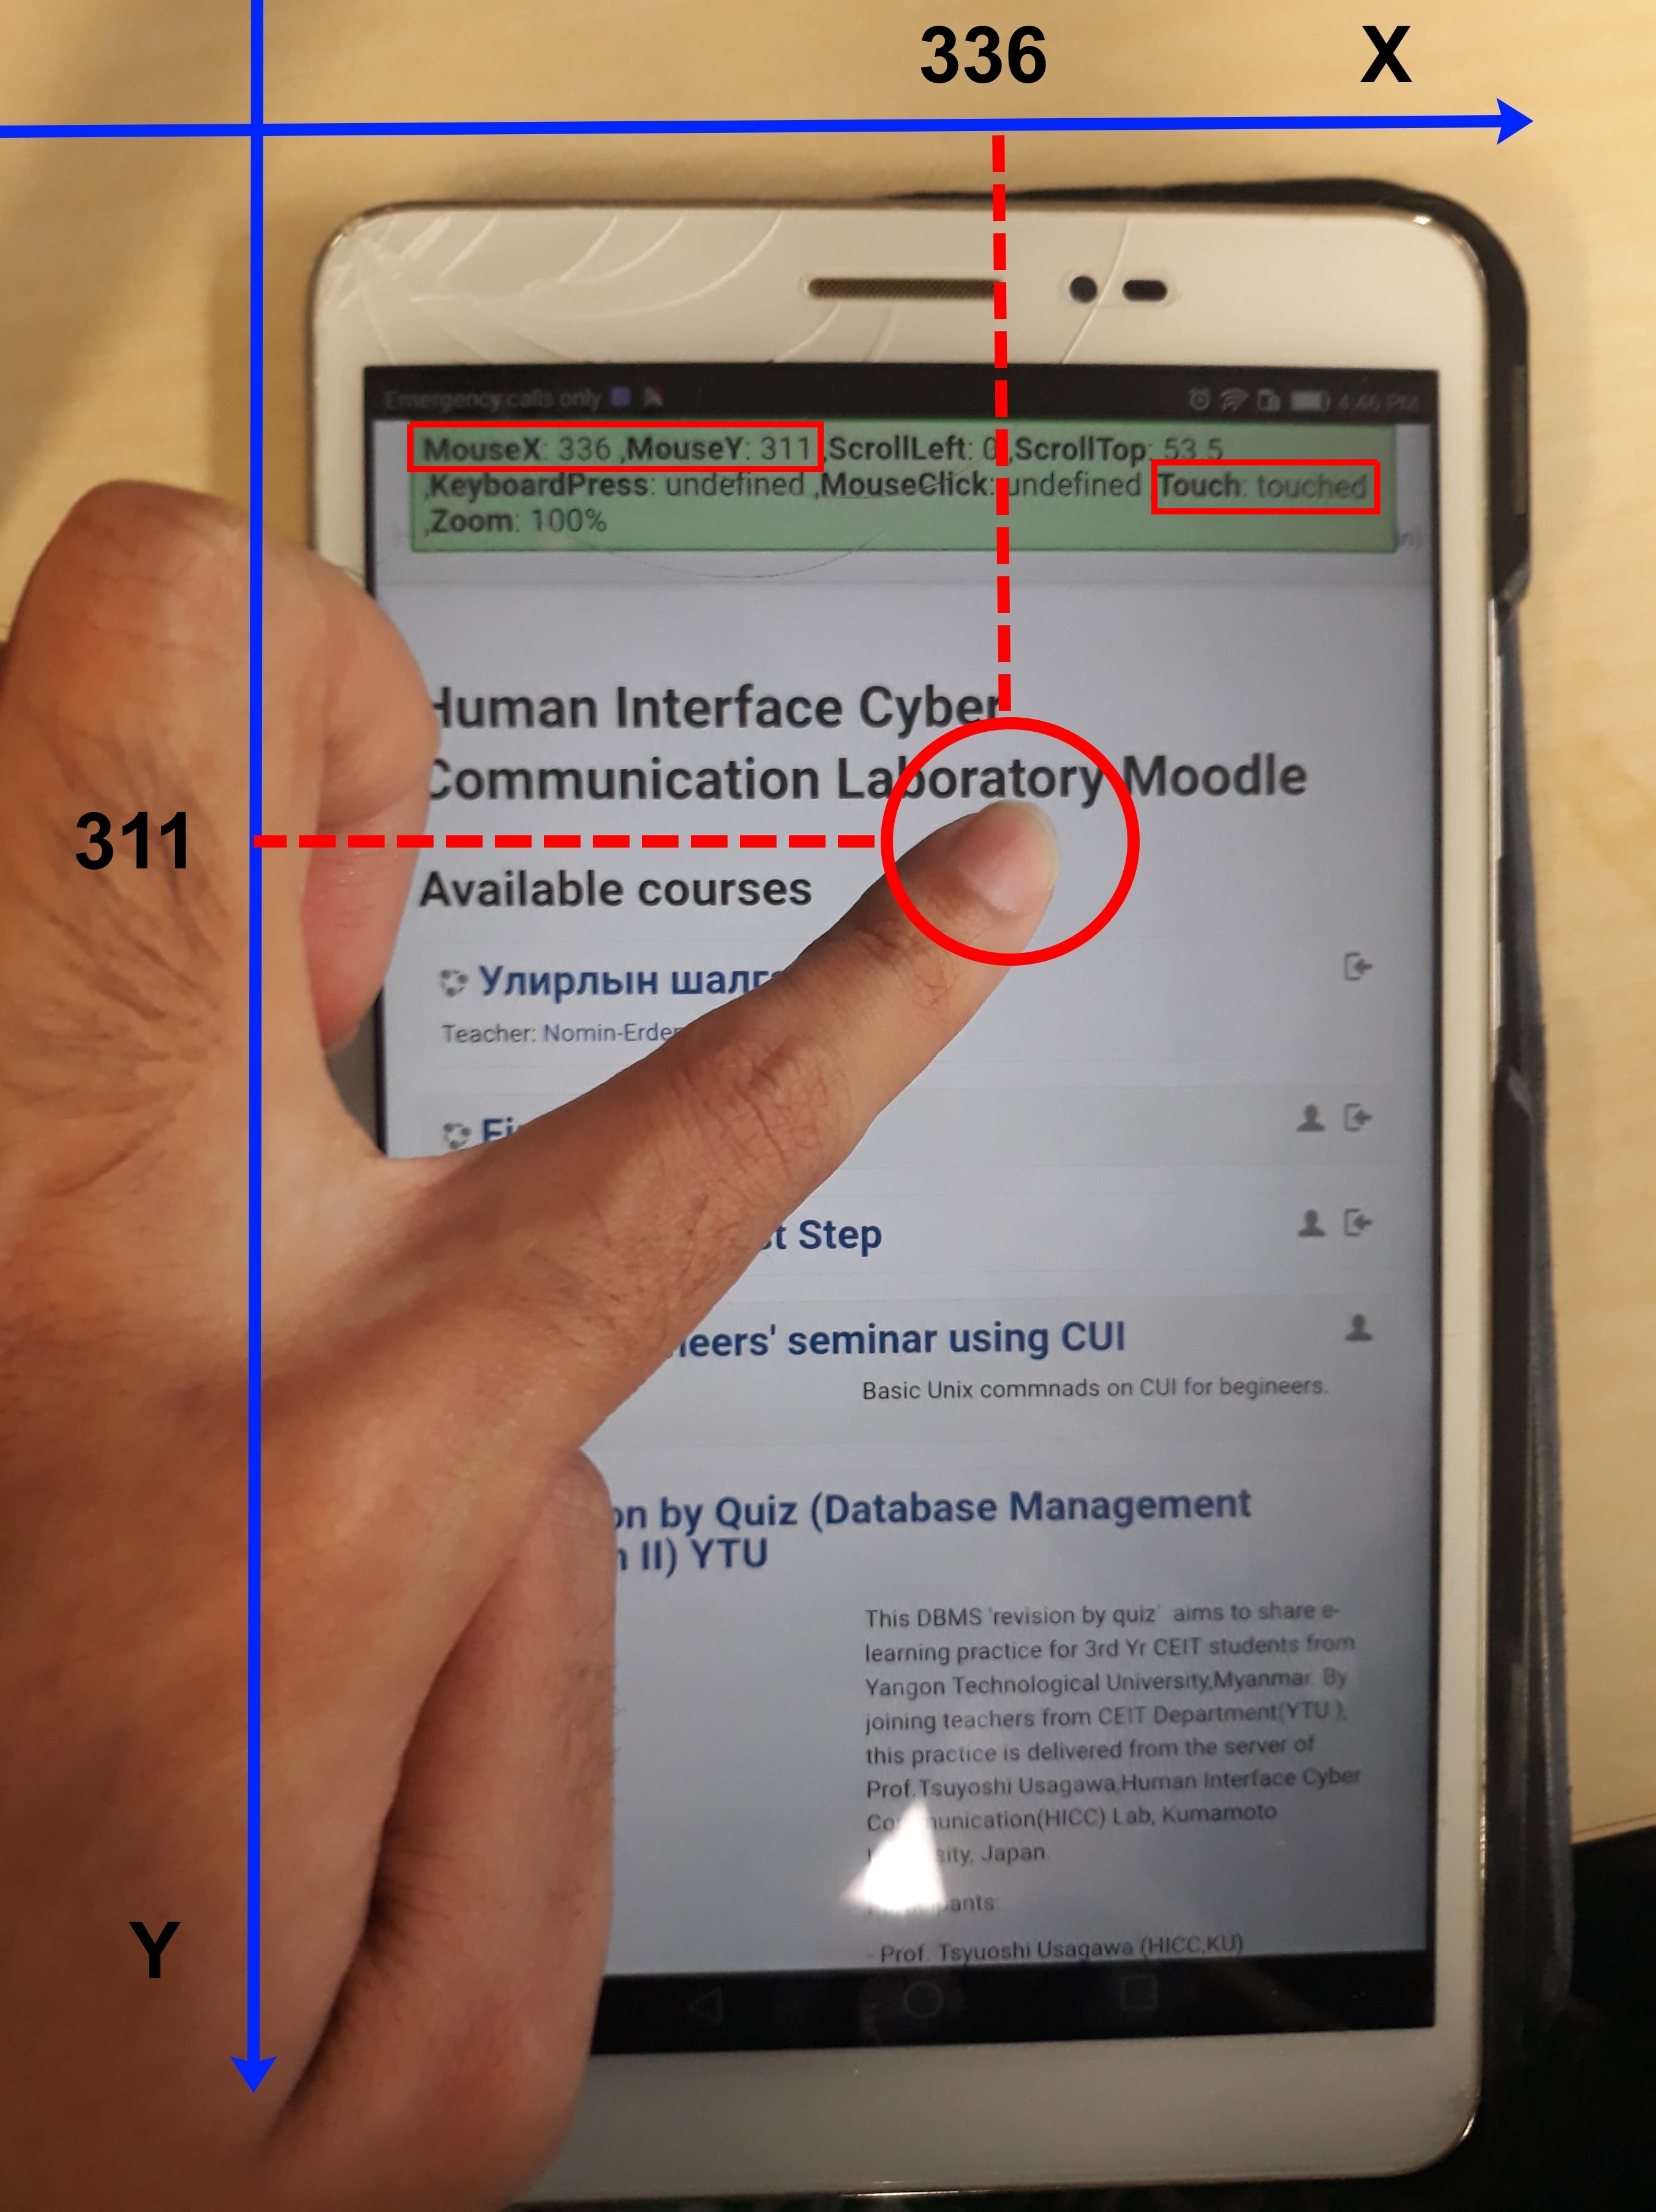
Fig. 5. Tracking demonstration on a mobile device. Although touch was not shown in Fig. 4, in this figure, touch showed “touched” where a finger was in contact with the screen. The coordinate of the touch is shown on MouseX and MouseY as “336” and “311,” respectively
Other Loggings
- Tab Status; The tab status shows whether the user is actively viewing the tab or not. It is identified by either mouse cursor position, touch, and focus whether they occur inside or outside of the tab. In Li and Tsai (2017)’s article, their traditional recording system cannot identify whether the users are active on the tab or not. However, this was possible in this investigation because mouse tracking was utilized.
- Name; The users have the option of providing their names or remaining anonymous.
- Email; The users have the option of providing their emails or remaining anonymous.
- Screen Size; The screen size returns the height and width size of the monitor in units of pixels.
- Window Size; The window size returns the height and width size of the applications (not the monitor, which is the screen) in pixels. The application in this case, is the browser. When the window size is larger than the screen size, this means that the user has zoomed in, and conversely, when the window size is smaller than the screen size, this means that the user has zoomed.
- Current Uniform Resource Locator (URL); The current URL returns the web address of the tab, i.e., the webpage that the user is currently opening.
- Internet Protocol (IP) Address; The IP Address returns the public IP address used by the user.
- Date; The date returns the day, month, year, and time of the occurrence of an event.
- Duration; The duration returns the length of time for the event. It is calculated as the date difference between the current event and the previous event.
Other Features
- Sampling Rate; The unit of recordings is events per time or in this case, it is the number of events generated per seconds. By default, the maximum number of events (clicks, moves, scrolls, etc.) per seconds depends on the capability of the users and the computer hardware. However, the frequency of the recording may be too high for either the client or the server. Therefore, this feature is designed to limit the number of events per seconds, which can reduce the resource costs of the tracking.
- Data to File; The data are sent from the client to the server through the post method and the server stores the data in specific formats such as .csv, .json, and .txt.
- Data to Database; The data is sent from the client to the server using the post method and the server stores the data in a database such as MySQL, Oracle, PostgreSQL, and MongoDB.
- User Control Menu; Shows a configuration menu, which allows the user to control the recording process. It allows them to choose which loggings to record.
- Demo Bar; Shows a demo bar that illustrates the operation of the real-time online mouse tracking application, which is represented by the green sticky header bar that shows the mouse positions, mouse scrolls, keyboard types, and zooms in Fig. 4 and Fig. 5.
Experiment and Implementation
The real-time online mouse tracking application was installed on the author’s Moodle server. Three mouse tracking experiments were performed during which the clients participated in a ten-question quiz session on the server. The resource costs were then measured. The data rate of the network was measured using a tool called Wireshark. The default values for the CPU, RAM, and storage monitoring are available from the server’s operating system (OS) which is Ubuntu 18.04 LTS server. The server is equipped with an Intel(R) Core(TM) i7-6800K CPU @ 3.40GHz (with SSE4.2) CPU, 32 GB of DDR4 RAM, 10 TB of hard drive, and an allocated 2 MBps network.
P2P Experiment
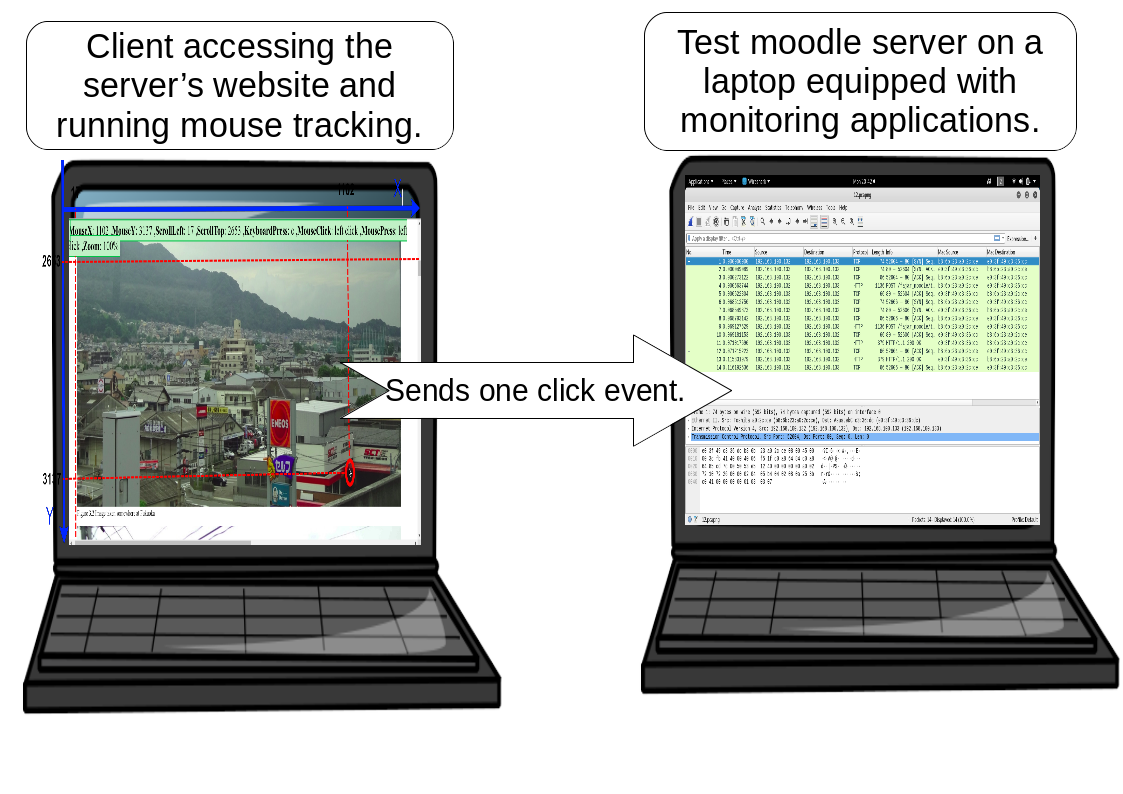
Fig. 6. P2P real-time mouse tracking experiment. The right laptop has a Moodle server installed with mouse tracking codes, while the left laptop has Ubuntu Desktop OS installed. The role of the latter is to access the Moodle server on the right laptop using a browser and perform one click. The right laptop received the click event and stored it on the database while measuring the network cost of the click event.
The first experiment was point-to-point (P2P) as illustrated in Fig. 6 where one client accessed the server directly without using the Internet. In this experiment, a laptop was directly connected to the server on an isolated P2P network to obtain clean data. The empirical data rate of one event (single click) was measured. As clean data were obtained, it was possible to derive a theoretical mouse tracking data rate. The other resource costs were not measured because the authors did not possess the necessary hardware, software, and knowledge to measure such small events.
Local Experiment
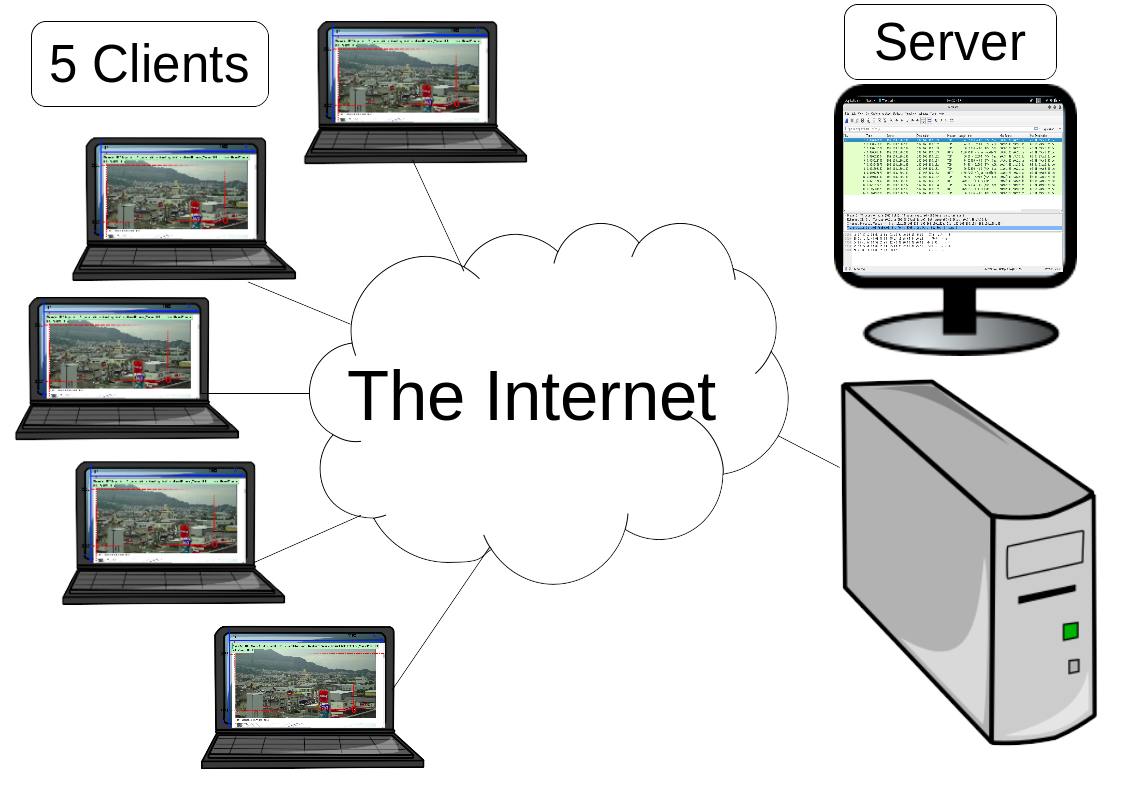
Fig. 7. Local real-time online mouse tracking experiment. Five clients accessed the Moodle server from the Internet and participated in ten-question quiz sessions while mouse and keyboard activities were recorded. The Moodle server also measured the resource costs.
The second experiment was a local experiment illustrated in Fig. 7 where five clients accessed the server through the Internet. This experiment was conducted inside the author’s laboratory. Five lab members including the main author tested the mouse tracking application and answered 10 questions during the quiz session. A resource costs profile of the five users was generated. There were no limits to the number of events per second that the clients were allowed to produce.
Overseas Implementation
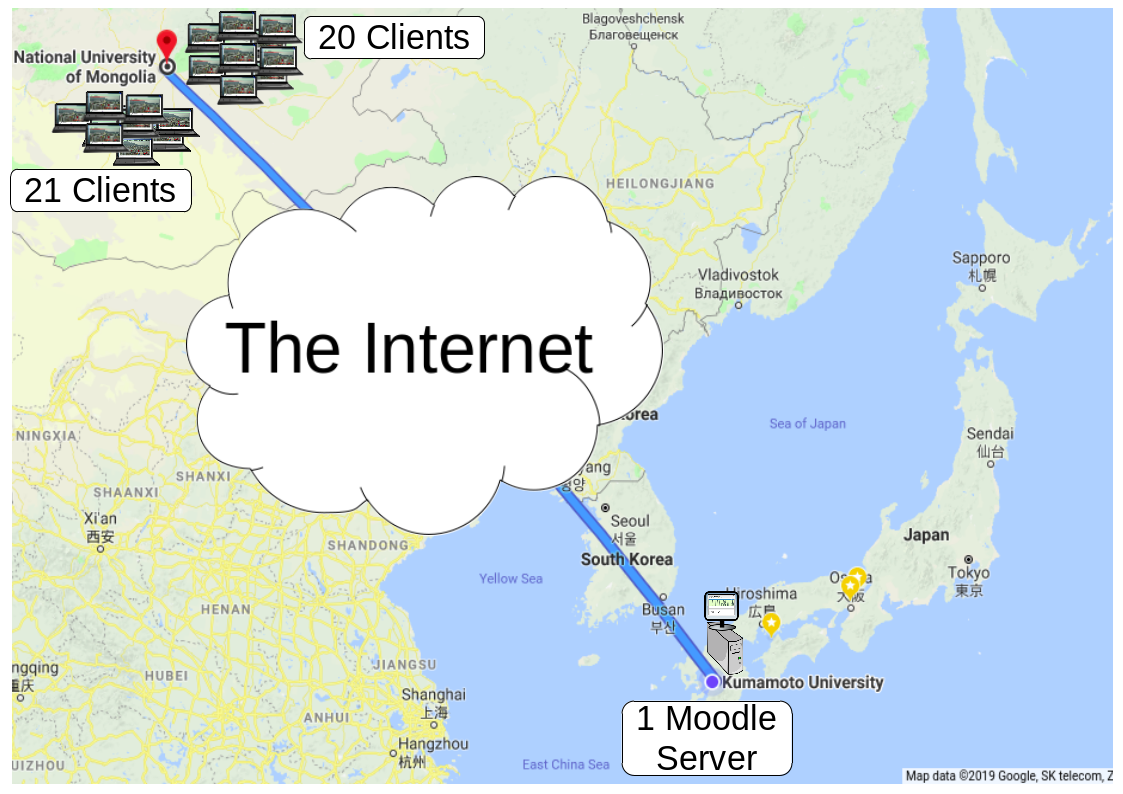
Fig. 8. Overseas real-time online mouse tracking implementation. Forty-four clients from the National University of Mongolia, separated into two groups, accessed the Moodle server at Kumamoto University in turns through the Internet and participated in a ten-question quiz session while mouse and keyboard activities were recorded. The Moodle server also measured the resource costs.
The third experiment was an overseas implementation illustrated on Fig. 8 where 44 clients in Mongolia accessed the server in Japan. Unlike the previous experiment, this was a real implementation where students from the School of Engineering and Applied Science, National University of Mongolia participated in a real quiz session on the server in the Human Interface Cyber Communication Laboratory, Kumamoto University. In this case, there was also no limitation in terms of events per second on the clients. Apart from determining the resource costs profile for the real quiz session, useful mouse tracking data was obtained. Although this work discusses the mouse tracking data and demonstrates some simple analysis, further analyses are out of the scope of this investigation.
Result and Discussion
Theoretical Calculation from P2P Empirical Data
Table 1. The resource cost of one event posted to the server. The rows before the last row are the types of information, and the last row shows the data rate of the submitted post (Purnama et al. 2020)
| NO | ✓ | ✓ | ✓ | ✓ | ✓ | ✓ | ✓ | ✓ | ✓ | ✓ | ✓ | ✓ |
|---|---|---|---|---|---|---|---|---|---|---|---|---|
| ID | ✓ | ✓ | ✓ | ✓ | ✓ | ✓ | ✓ | ✓ | ✓ | ✓ | ✓ | ✓ |
| Name | ✓ | ✓ | ✓ | ✓ | ✓ | ✓ | ✓ | ✓ | ✓ | ✓ | ✓ | ✓ |
| ✓ | ✓ | ✓ | ✓ | ✓ | ✓ | ✓ | ✓ | ✓ | ✓ | ✓ | ✓ | |
| X | ✓ | ✓ | ✓ | ✓ | ✓ | ✓ | ✓ | ✓ | ✓ | ✓ | ✓ | ✓ |
| Y | ✓ | ✓ | ✓ | ✓ | ✓ | ✓ | ✓ | ✓ | ✓ | ✓ | ✓ | ✓ |
| leftclick | ✓ | ✓ | ✓ | ✓ | ✓ | ✓ | ✓ | ✓ | ✓ | ✓ | ✓ | ✓ |
| rightclick | ✓ | ✓ | ✓ | ✓ | ✓ | ✓ | ✓ | ✓ | ✓ | ✓ | ✓ | ✓ |
| middleclick | ✓ | ✓ | ✓ | ✓ | ✓ | ✓ | ✓ | ✓ | ✓ | ✓ | ✓ | ✓ |
| keyboardtype | ✓ | ✓ | ✓ | ✓ | ✓ | ✓ | ✓ | ✓ | ✓ | ✓ | ✓ | |
| scrollx | ✓ | ✓ | ✓ | ✓ | ✓ | ✓ | ✓ | ✓ | ✓ | ✓ | ||
| scrolly | ✓ | ✓ | ✓ | ✓ | ✓ | ✓ | ✓ | ✓ | ✓ | ✓ | ||
| zoom | ✓ | ✓ | ✓ | ✓ | ✓ | ✓ | ✓ | ✓ | ✓ | |||
| touch | ✓ | ✓ | ✓ | ✓ | ✓ | ✓ | ✓ | ✓ | ||||
| touchmove | ✓ | ✓ | ✓ | ✓ | ✓ | ✓ | ✓ | |||||
| tab | ✓ | ✓ | ✓ | ✓ | ✓ | ✓ | ||||||
| duration | ✓ | ✓ | ✓ | ✓ | ✓ | |||||||
| date | ✓ | ✓ | ✓ | ✓ | ||||||||
| content_url | ✓ | ✓ | ✓ | |||||||||
| windowsheight | ✓ | ✓ | ||||||||||
| windowswidth | ✓ | ✓ | ||||||||||
| screenheight | ✓ | |||||||||||
| screenwidth | ✓ | |||||||||||
| Data rate (kB) | 3.11 | 3.14 | 3.14 | 3.2 | 3.2 | 3.22 | 3.25 | 3.29 | 3.43 | 3.56 | 3.64 | 3.72 |
Table 1 shows the resource cost of the authors’ real-time online mouse tracking application for one event on the server, for a variety of information. This data applies to the P2P experiment in which the client performed one click on the Moodle server where mouse tracking was activated. As more information was included in the event, the data rate increased. The data rate revealed an increase of approximately 12 bytes when new information was added. This behavior is expected because an increase in the amount of information results in an increase in the post data size. For example, in Table 1 there was a significant increase in the data rate when the variable “date” and “content_url” were included because they contain more characters compared to other variables. The authors also attempt to measuring CPU and RAM activity but the change was negligibly small. Although the result is limited to this application only, similar results are expected for other existing applications.
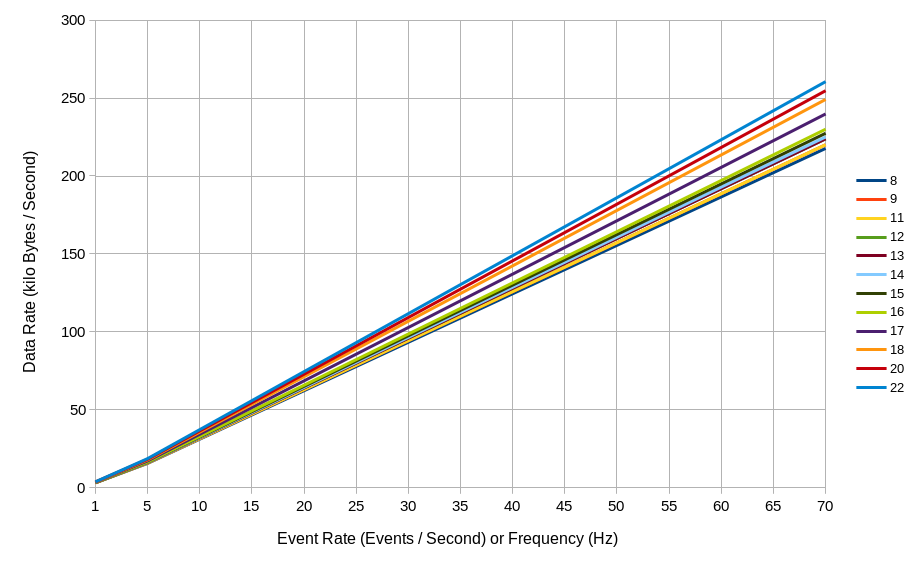
Fig. 9. A plot of data rate generated by a user based on the events generated per second. The horizontal axis represents the events per second or frequency in hertz and the vertical axis represents the data rate in kilobytes per second. The different colored lines represent the number of variables included (refer to Table 1).
The addition of new data does not appear to significantly increase the data rate; however, this addition will be consequential as the number of users increases, especially when they perform many activities. The rate of mouse tracking activities is measured in events per second or frequency in hertz (Hz). Although the frequency of mouse movement and scrolling is high, usually, the rate does not exceed 70 events per second or 70 Hz (Rheem et al., 2018). Based on the empirical data obtained from Table 1, it is possible to estimate the data rate of the soon to be implemented mouse tracking. The first step in this process is to determine the number of events generated by users per second. Then the data rate is identified in Fig. 9 and multiplied by the number of users. The results revealed that it is possible for 1 MB of data to be generated from mouse activity in one minute (Leiva and Huang, 2015). From Fig. 9, when a user constantly generates five events per second (5 Hz), the data generated can reach 1 MB in approximately one minute.
As previously stated, the real-time online mouse tracking application has a feature to limit the maximum number of events per second generated by a user. This can be set after allocating the network bandwidth of the mouse tracking process. Assuming that data are recorded for all available variables in mouse tracking if there are 22 users, and the network allocated to mouse tracking is 2 megabytes per second (MBps), the mouse tracking application should be limited to 25 events per seconds. However, this calculation is not realistic and is only relevant for measuring the worst-case scenario, whereby smooth implementation and not optimal resource usage is intended. This is because the events generated per second by users are dynamic and not static. For example, there are instances when the mouse cursor is not moved as the user stops scrolling to read. Likewise, there are instances when users move the mouse cursor and scroll to search for information. There are also occasions when users drag and drop objects during interactive activities. Consequently, users do not generate a fixed number of events per second.
Profile Measurement from Local Experiment
Table 2. The resource cost for local experiments and overseas implementation of the server. CPU usage in percentage, RAM usage in megabytes, and data rate in kilobytes were measured for both experiments. From the measurements, statistical metrics were derived including the minimum, maximum, median, average, and standard deviation.
| Statistical | Local Mouse Tracking Experiment | Overseas Mouse Tracking Implementation | ||||
|---|---|---|---|---|---|---|
| Metrics | CPU (%) | RAM (MB) | Data Rate (kB) | CPU (%) | RAM (MB) | Data Rate (kB) |
| Minimum | 0 | 1576.07 | 543 | 0 | 1080.09 | 416 |
| Maximum | 18 | 1850.83 | 312990 | 22 | 2417.06 | 837632 |
| Median | 9.79 | 1746.82 | 47846.5 | 10.42 | 2025.87 | 115992 |
| Average | 10 | 1767.74 | 51302.77 | 22 | 2106.62 | 104525.91 |
| Standard Deviation | 1.42 | 66.05 | 25959 | 4.84 | 272.13 | 71029.98 |
To obtain more realistic data and to perform reliable calculation, profile measurements should be acquired. The main question that is considered in profile measurement is “how often do users move their mouse and scroll?” The profile measurement used in this work is resource monitoring during local mouse tracking processes by five users followed by statistical analysis on the time series data. Although the data required is the average events per second during the mouse tracking processes, it is more convenient to immediately measure the average resource costs.
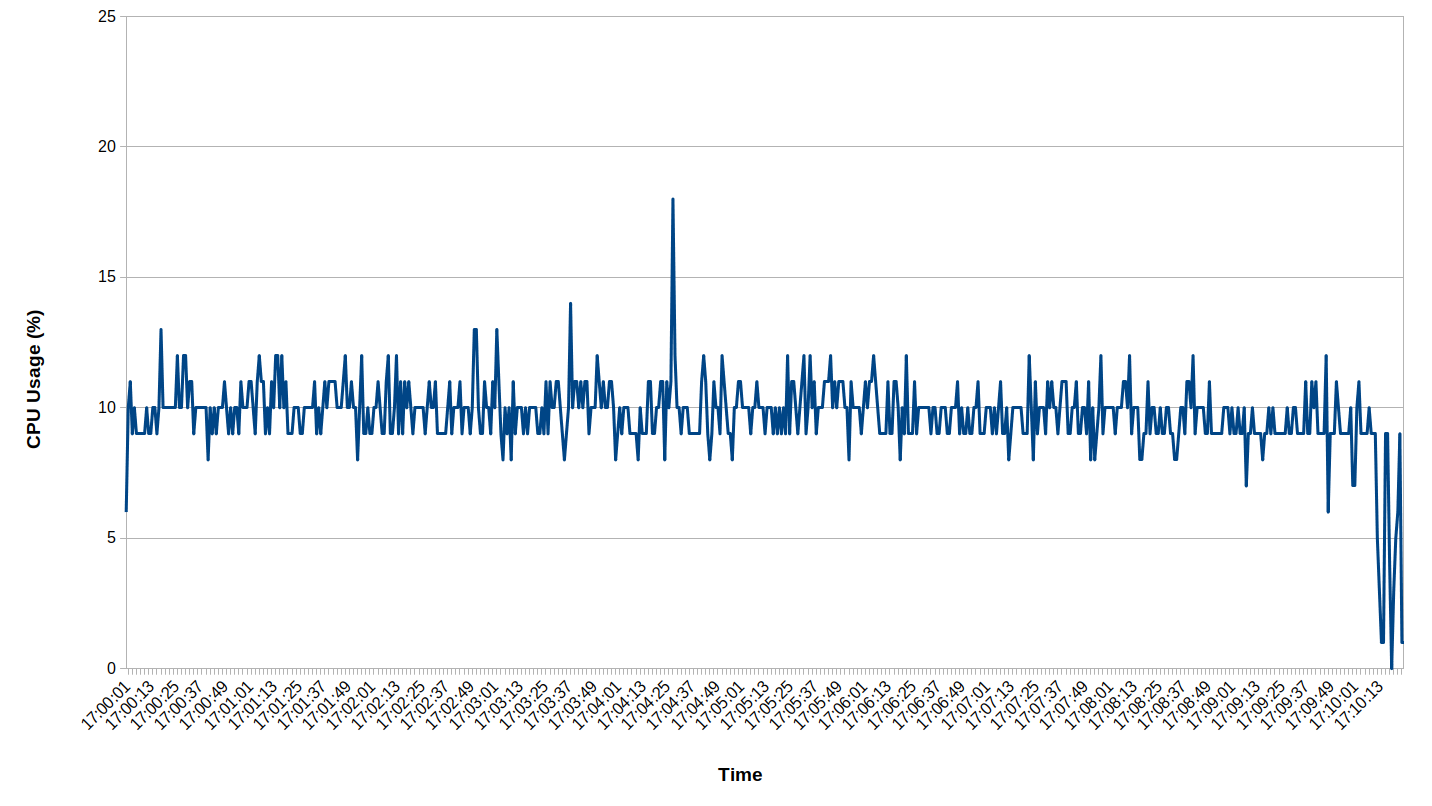
Fig. 10. CPU usage time series during local mouse tracking experiment by five users. The horizontal axis is the time of day and vertical axis is the CPU usage percentage.
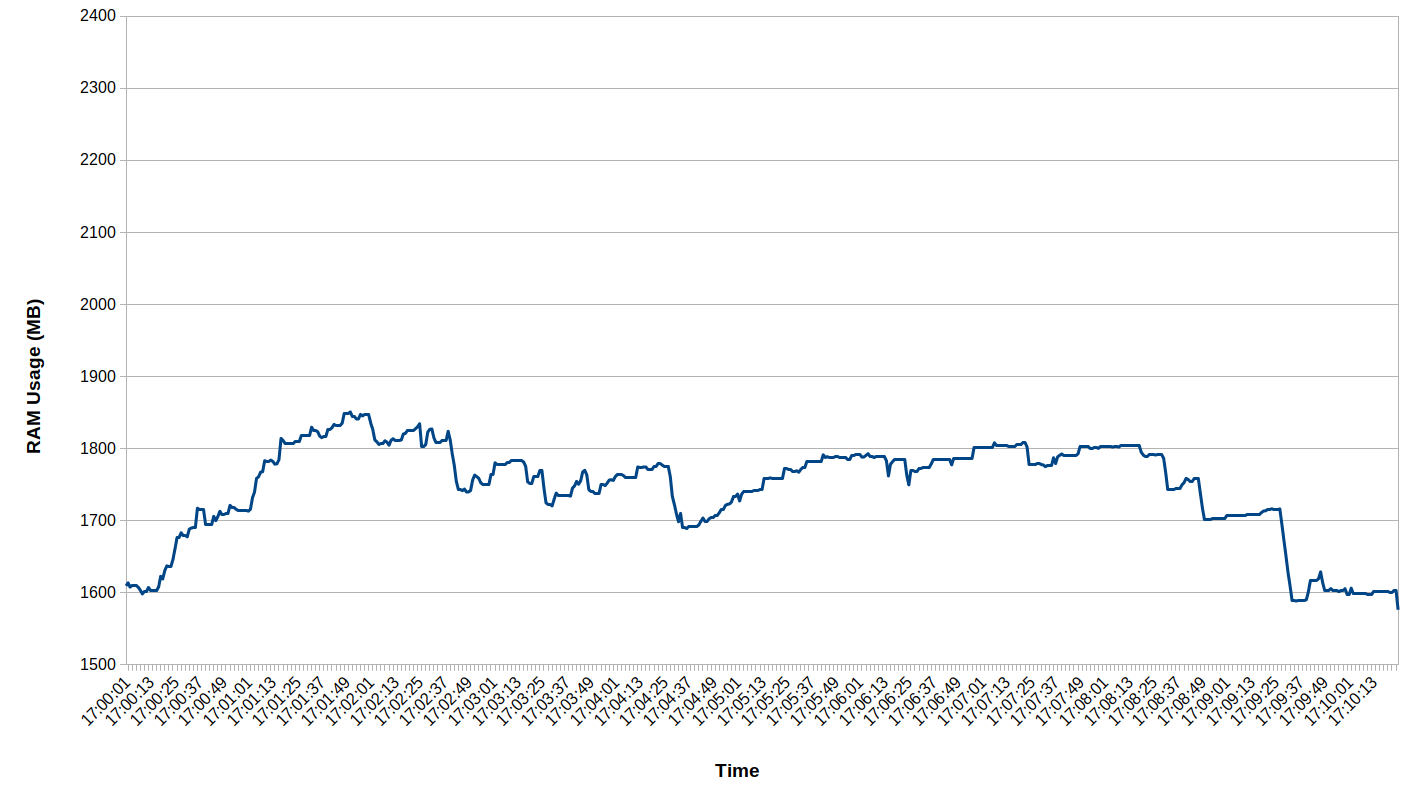
Fig. 11. RAM usage time-series during local mouse tracking experiment with five users. The horizontal axis is the time of day and vertical axis is the RAM usage in megabytes.
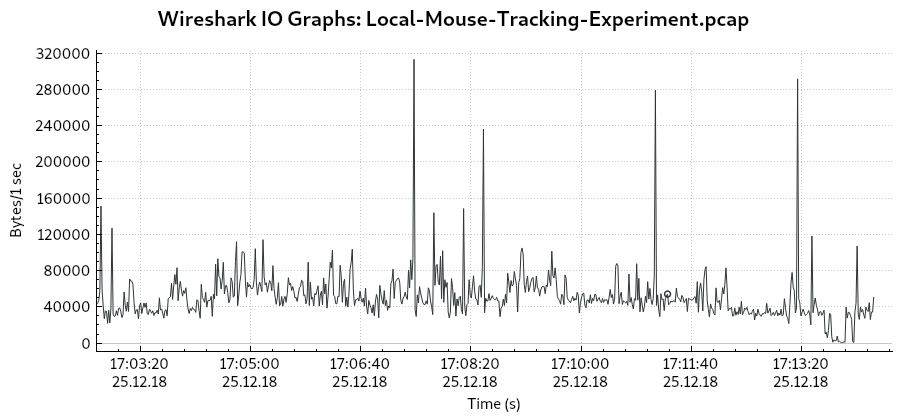
Fig. 12. Data rate during local mouse tracking experiment for five users. The horizontal axis is the time of day and the vertical axis is the data rate in bytes per second.
Unlike the P2P experiments, the local experiment measures not only the mouse tracking but also all the other processes, which includes accessing the Moodle page and answering 10 questions. During this experiment, the CPU percentage Fig. 10, the RAM usage Fig. 11, and the data rate Fig. 12 were rarely zero, indicating that idle activity was uncommon. For the local experiment with five users, the CPU percentage usage was an average of 10%, the RAM usage was an average of 1.7 GB, and the data rate was an average of 51 kB. This indicates that there was a reserve capacity for more users. It should be noted that the initial CPU percentage and RAM usage by the OS were 0% and 1.4 GB, respectively.
An interesting result is shown in Fig. 12 for the data rate. During the quiz session at approximately 17:02:40-17:14:20 (11 minutes and 40 seconds, or 700 seconds), a table size of 6.1 MB with approximately 16287 rows (equivalent to 16287 events) and 17 columns were generated (note that the number of columns is less than the number of introduced variables in Table 1 because during this time, tracking for mobile device had not been developed. In addition, the total data transmission may not be equal to the size of the stored data on the database because of other factors such as the transmission methods, unoptimized application, and other factors apart from mouse tracking such as data transmitted when loading Moodle pages). Interestingly, the average events per second (16287 events divided by 700 seconds) was 23 or 23 Hz. If this data is plotted on Fig. 9, a result 78 kBps is obtained which is not far from the actual measurement of 51 kBps in Table 2.
Can a single mouse swipe produce hundreds of mouse coordinates (Leiva and Huang, 2015)? The answer is “yes,” is we examine the spikes in Fig. 12. The highest spike occurred between 17:07:28-17:07:29 when 98 queries per second were received by the database. If plotted in Fig. 9, the result of 335 kBps is obtained which is close to the actual measurement where the maximum data rate from Table 2 is 312 kBps (unfortunately, name and email identification was not available at the time. Therefore, the identity of the users and the number of them who performed a large number of events is unknown). This shows that the speculation seems to be justified in the case where users are able to generate a high number of events per second momentarily. In other words, more than one user can perform many activities; mainly, simultaneous mouse moves and scrolls. The upper spikes are very large, as Table 2 indicates that the difference between median and maximum is large compared to the difference between median and minimum. Moreover, the spikes indicate that a very high level of activities only occurs momentarily and not constantly. Network and server administrators observed that mouse activities potentially generate a large amount of data. However, there was concern that this high level of activity is constant. The presented results clearly demonstrate that high-level mouse activity is mostly temporary.