Playing with Graphs & Functions (in Python)
H
ello there!!
Functions are very interesting aren't they?!!
Patterns occur in nature in various forms, some obvious, some not so much...
Some of them can be described using a field of mathematics called: Group Theory which takes an abstract mode of description of patterns, while others can simply be described using a mathematical function.
What do we mean by a pattern?
Well, if we are given a part of the object, we should be able to complete the object or describe the removed part, then the object should be called a pattern. To do this we may use symmetries in the object, or we may try to model it using a mathematical function. (That's my understanding of it! 😄 ), ...and well Wikipedia describes it as follows:A pattern is a regularity in the world, in human-made design, or in abstract ideas. As such, the elements of a pattern repeat in a predictable manner. A geometric pattern is a kind of pattern formed of geometric shapes and typically repeated like a wallpaper design.
| Pattern | Illustration | Type |
|---|---|---|
| Snow Flake | 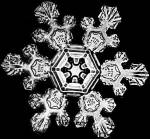 | Six-fold symmetry, can be modelled using abstract algebra Dihedral Groups |
| Chirping of Forest Crickets | Can be modelled approximately as a step function of this type:  | |
| The buzz of a bee | The sound of a single bee can be modelled as a function which would look like: 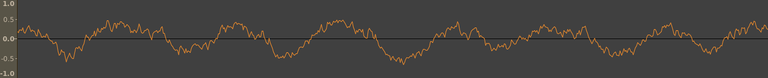 which is approximately a sin function, or rather a sin function who's amplitude itself is varying as a sin function. which is approximately a sin function, or rather a sin function who's amplitude itself is varying as a sin function. | |
| Fibonnaci spiral in Sunflower | 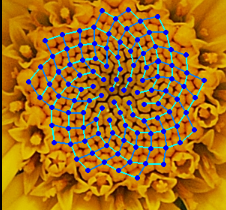 | This spiral follows the fibonacci series. |
| Fractal pattern in Romanesco Broccoli | 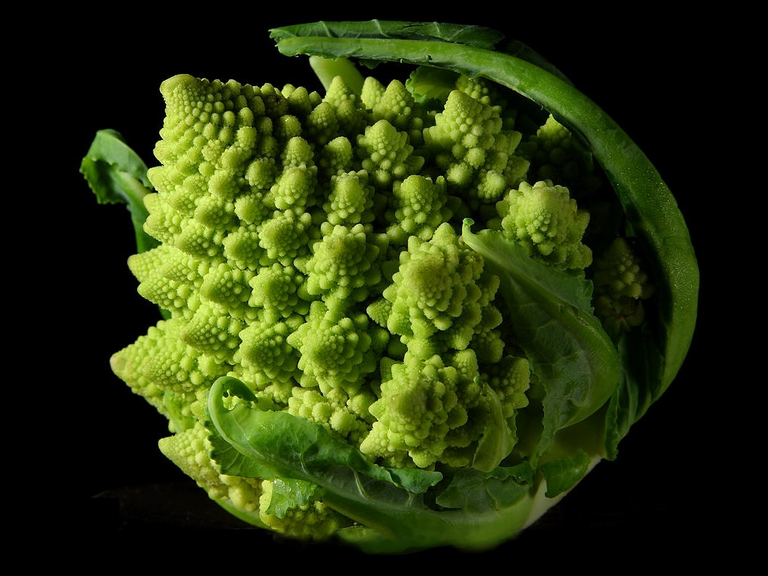 | In layman's language, fractals are patterns which remain the same even when broken down into equal segments. Another example of a fractal pattern: Broken Ship Fractal |
Sound itself provides pretty interesting examples of harmonic functions (sin, cosine and their variants) leading to beats etc...
In this article we'll not go into the Abstract Algebra or Group Theoretical description, not even into fractals, rather we'll delve into the more tangible patterns which can be represented/modelled by a mathematical function.
Trigonometry is probably for most of us, our childhood math kryptonite! But trignometric functions find applications nearly everywhere.
Modelling sound waves is one such use....
Trigonometric Functions
Here, we'll plot trigonometric functions from x = -2π to 2π.
I am also putting the python code to generate the curve, so you can try it on your own PC.
| Function | Plot | Matplotlib Code |
|---|---|---|
| sin(x) | 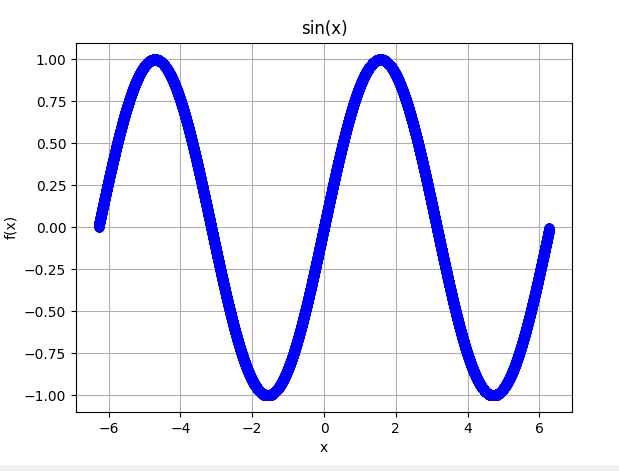 | 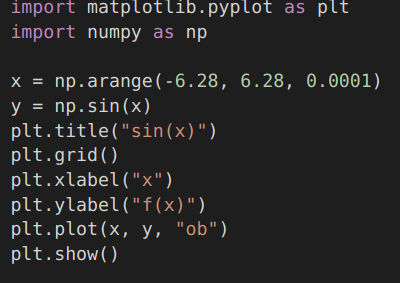 |
| cos(x): a sin function lagging in phase by π/2. | (graph will be similar to the one above, just shifted by a phase of π/2) | |
| cosec(x) = 1/sin(x) | 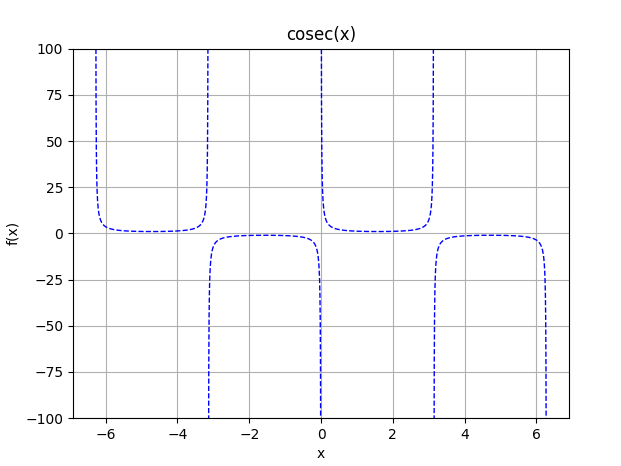 | 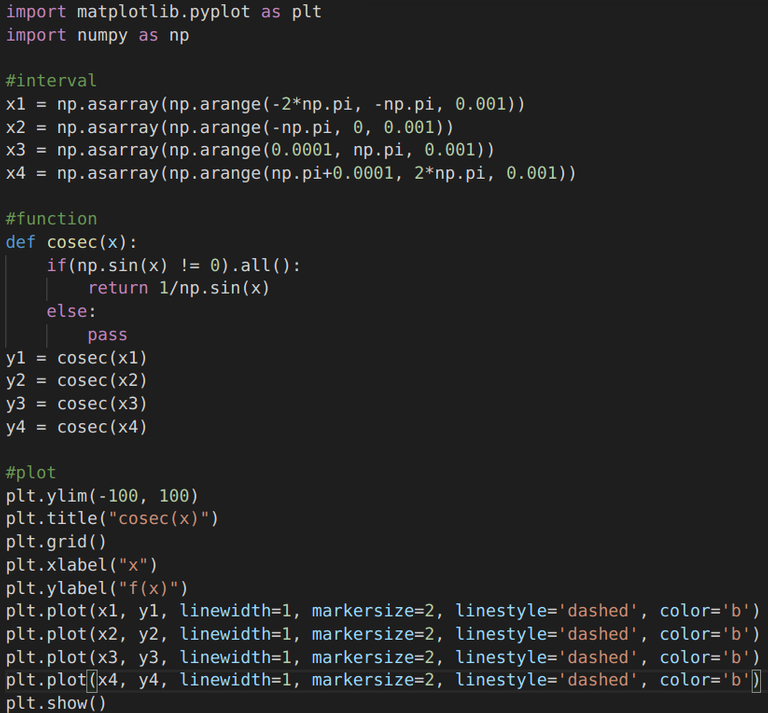 |
| sec(x) = 1/cos(x) | (Graph again will be similar to the one for cosec, only shifted by a phase of π/2) | |
| tan(x) = sin(x)/cos(x) | 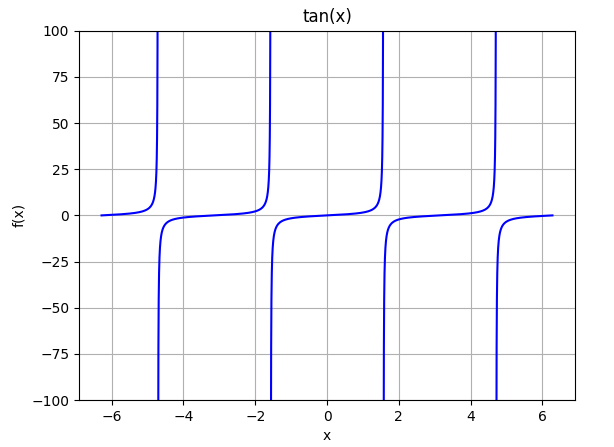 | 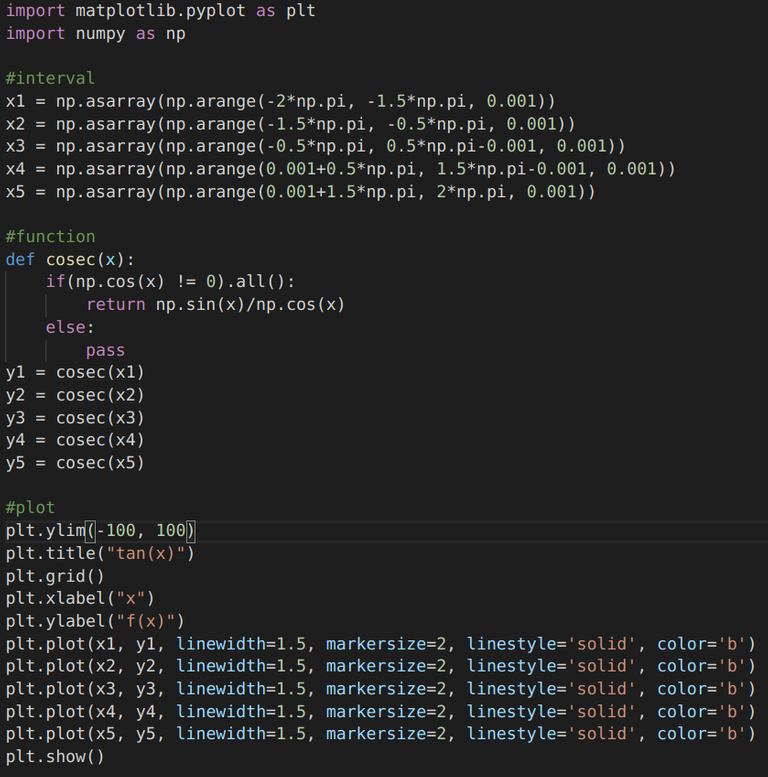 |
| cot(x) | (Graph will be the same as the one above, but will be shifted by a phase of π/2) |
Hyperbolic Functions
Wikipedia says: In mathematics, hyperbolic functions are analogs of the ordinary trigonometric functions defined for the hyperbola rather than on the circle: just as the points (cos t, sin t) form a circle with a unit radius, the points (cosh t, sinh t) form the right half of the equilateral hyperbola.
| Function | Plot | Matplotlib Code |
|---|---|---|
| sinh(x) | 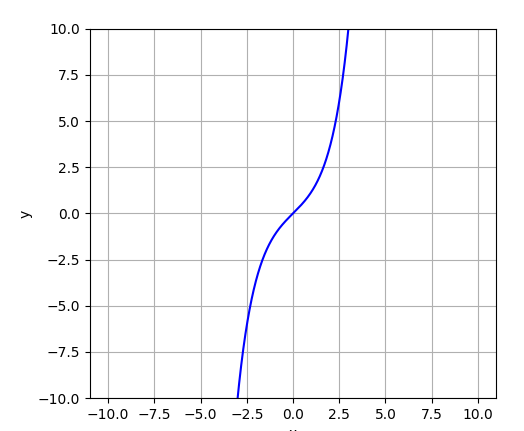 | 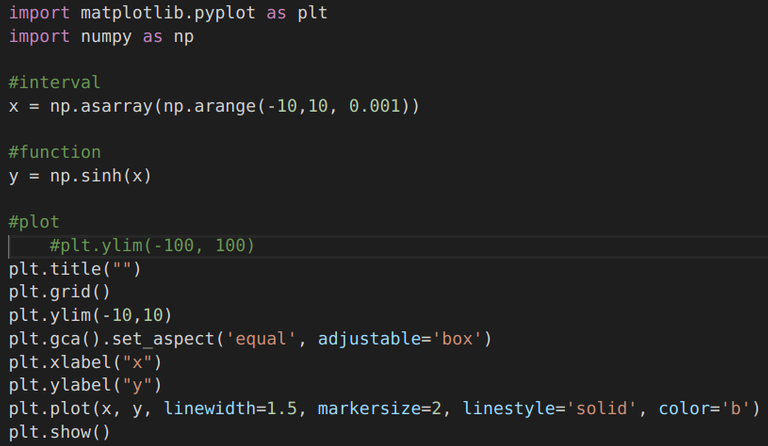 |
| cosh(x) | 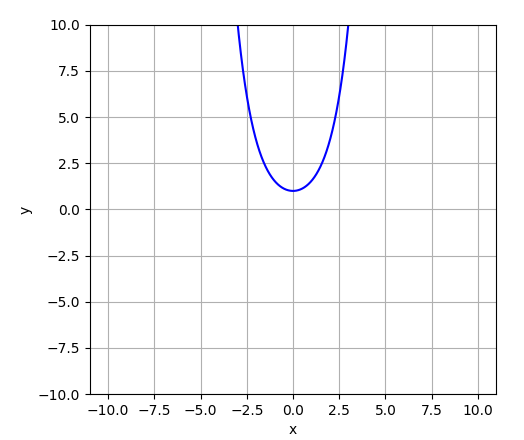 | (Code remains the same, we just replace sinh(x) with cosh(x)) |
| tanh(x) | 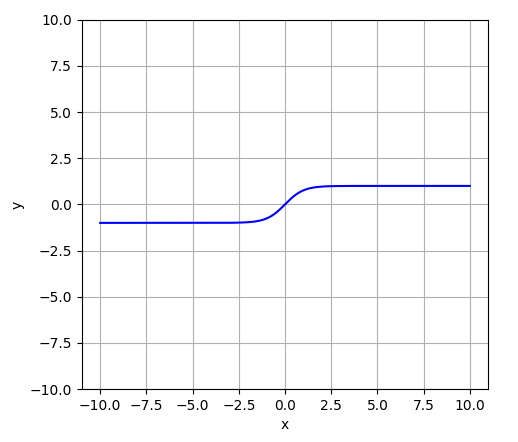 | (Code remains the same, we just replace cosh(x) with tanh(x)) |
Exponential Functions
| Function | Plot | Matplotlib Code |
|---|---|---|
| pow(2,x) Exponentially growing func. | 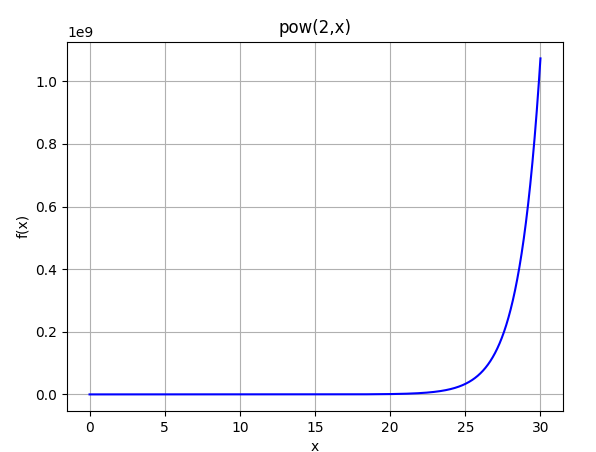 | 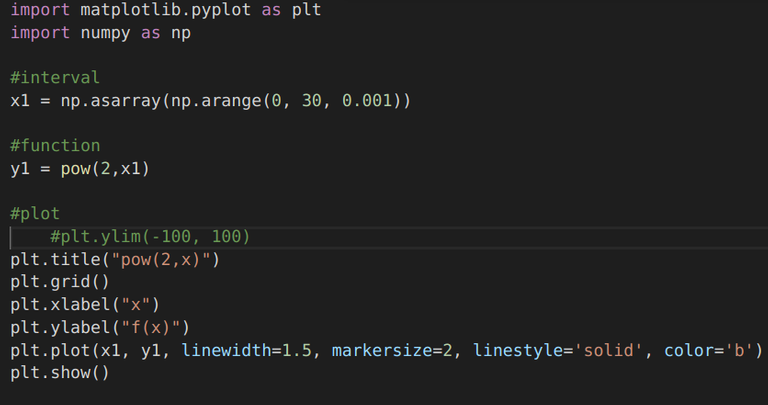 |
| 10 * pow(2,-x) Exponentially decaying func. | 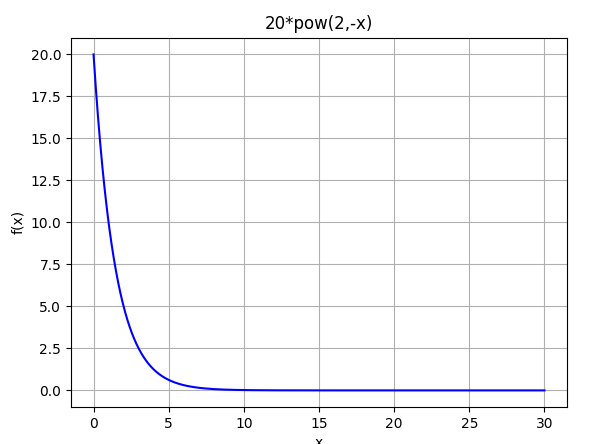 | 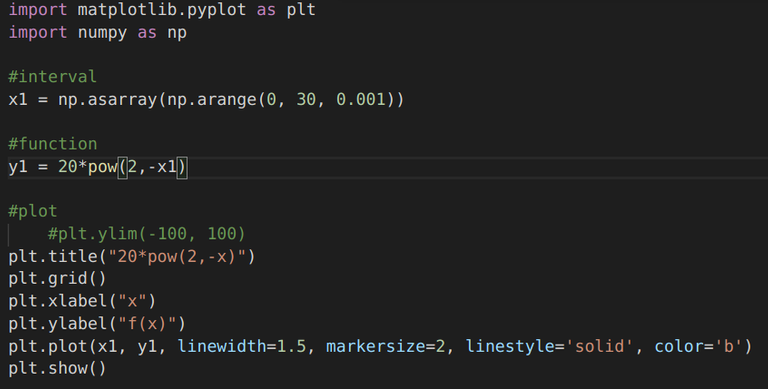 |
Parametric Functions
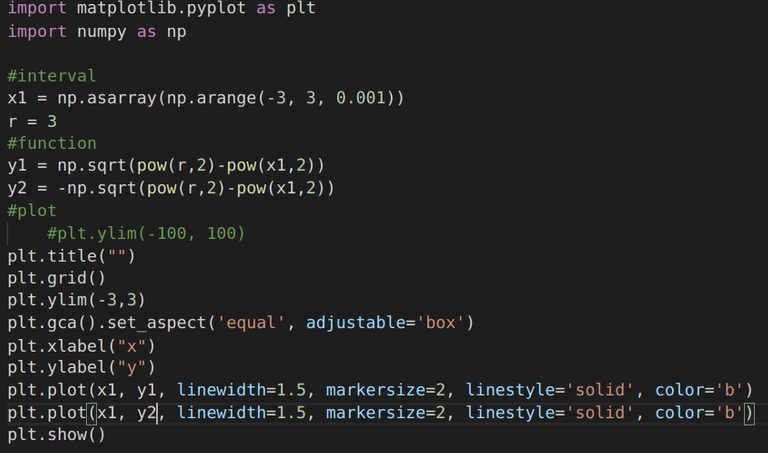
Let's try plotting a circle centered at origin. We know the cartesian equation for it is x^2 + y^2 = r^2, where r is the radius.
| Code | Plot |
|---|---|
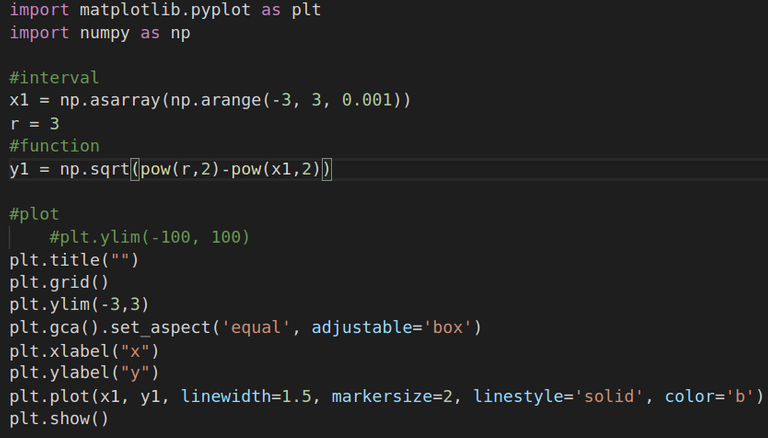 | 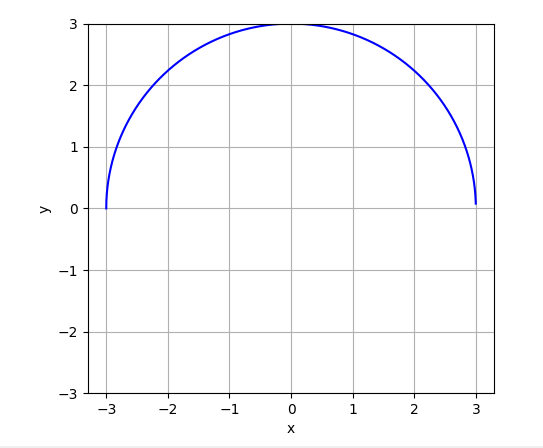 |
As you can see, we could only get a semicircle as the sqrt function of Matplotlib somehow takes gives only positive values. An alternative may be to add another curve which has only negative values of y: | |
 | 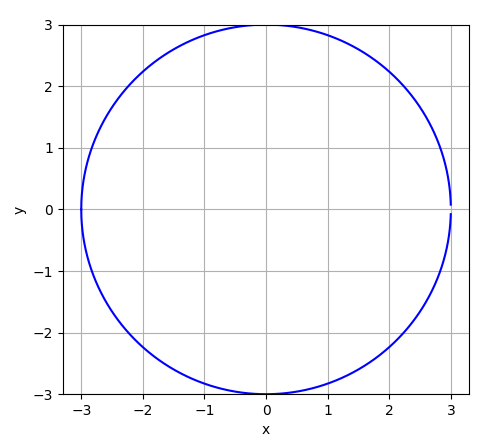 |
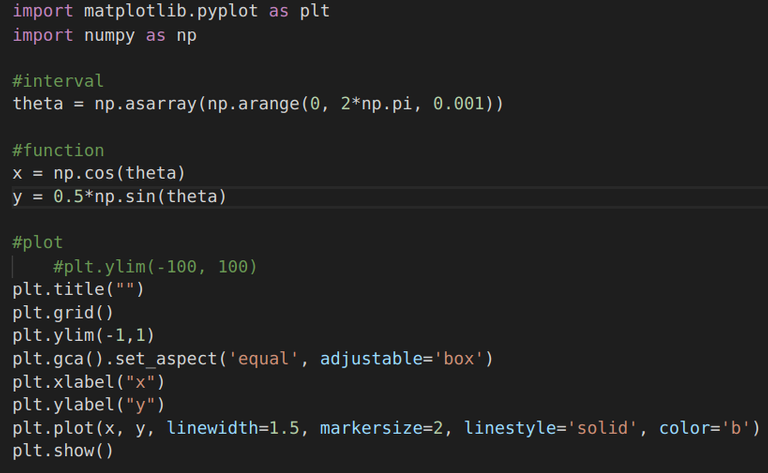
| And there, we got a complete circle! But, thus far we haven't used parametric functions anywhere. It appears that there is yet another way to plot a circle, or rather just a trick of mathematics!! We introduce a new parameter theta, and write x and y in terms of it. Then, we'll get: x = np.cos(theta) and y = np.sin(theta), where theta varies from 0 to 2π. Let's try it out: | |
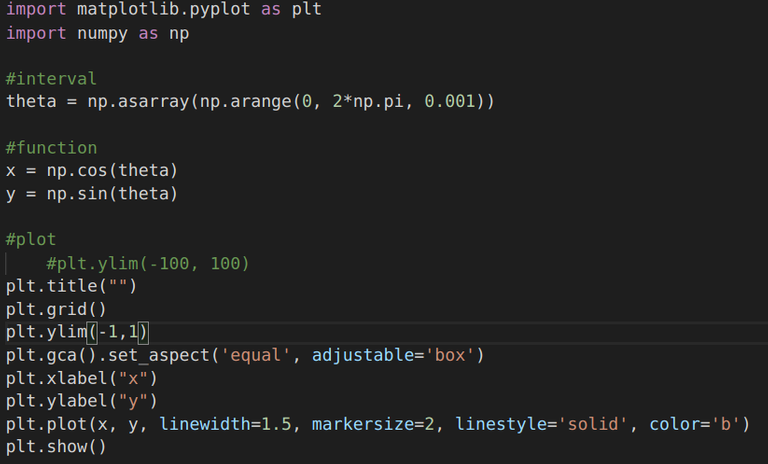 | 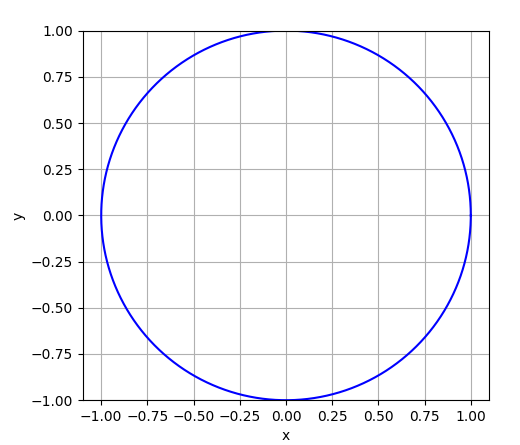 |
| So. in this example, we used parametric equations. It appears that plotting an ellipse should be easy with this technique, we can just add a factor to equation corresponding to y co-ordinates... | |
 | 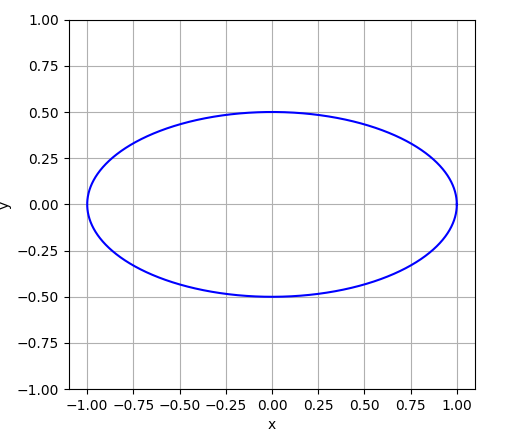 |
| But, I doubt it's an ellipse, looks more like an oval! Let's check it out. We know, the equation of an horizontal ellipse is: x^2/a^2 + y^2/b^2 = 1, here for our case, a = 1, and b = 0.5. Let's try plotting it along with the one above and see if they co-incide... | 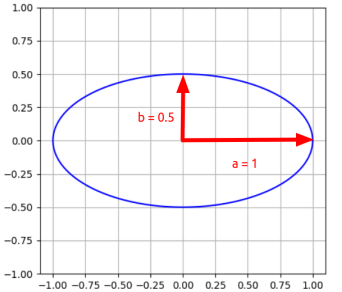 |
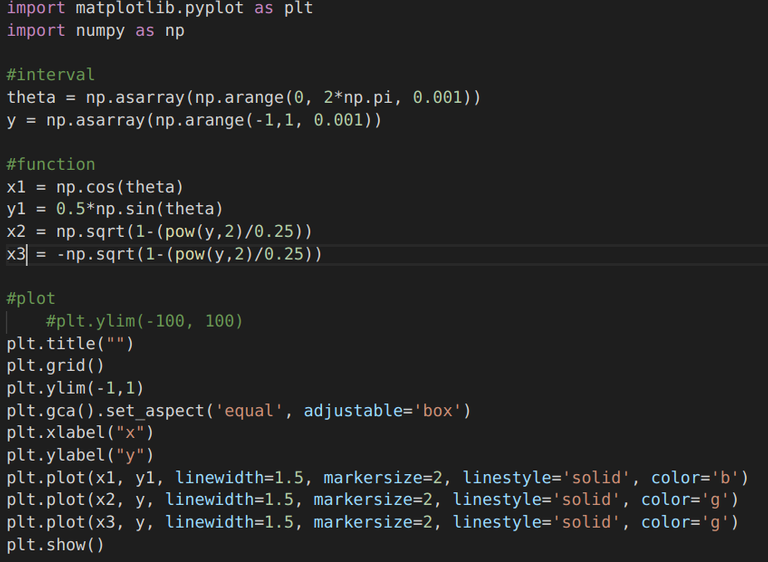 | 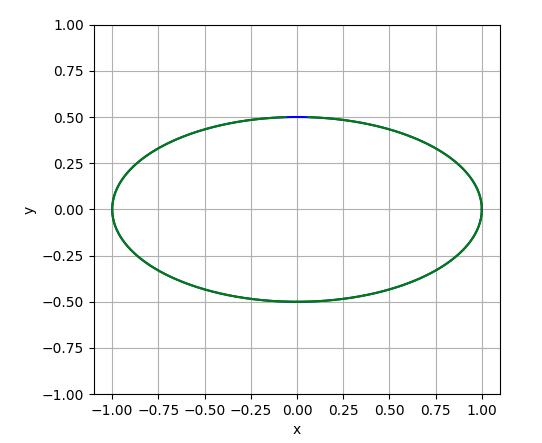 |
So, well as you can see the two curves (blue and green) do coincide, so they must be the same! It's good that we tested! Haha! Well, let's move ahead...
NOTE: Technically, ovals are not mathematical shapes, and may not always be ellipses, but the opposite is always true.
Polar plots
(Plots in Polar co-ordinates)
Well Cartesian co-ordinates definitely work well, but in some cases they are more difficult to work with, in such scenarios, another co-ordinate system often seems to do the job better. There are of-course systems other than the Cartesian one like polar co-ordinate system, and the cylindrical co-ordinate system.
| Cartesian System | Polar System | Cylindrical System |
|---|---|---|
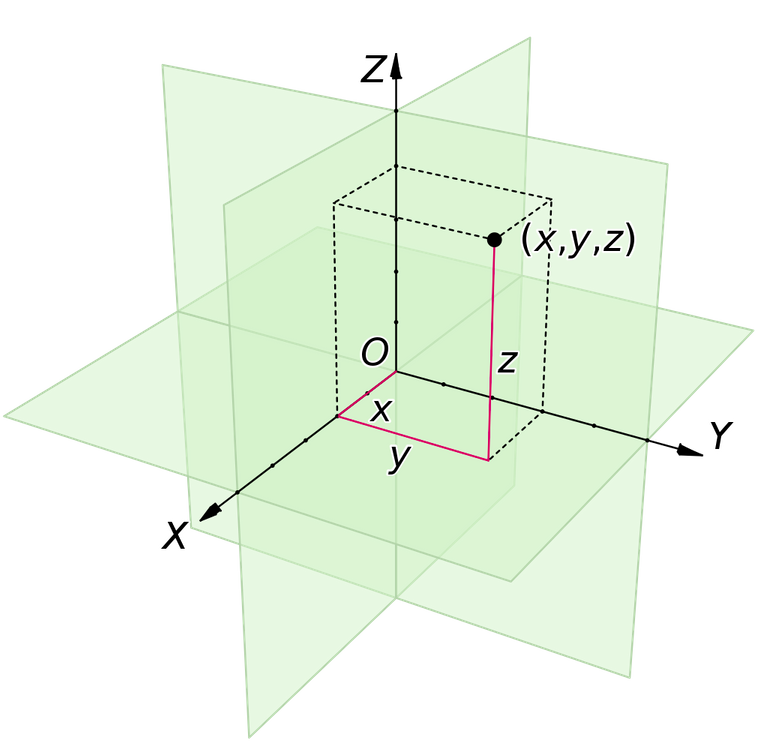 | 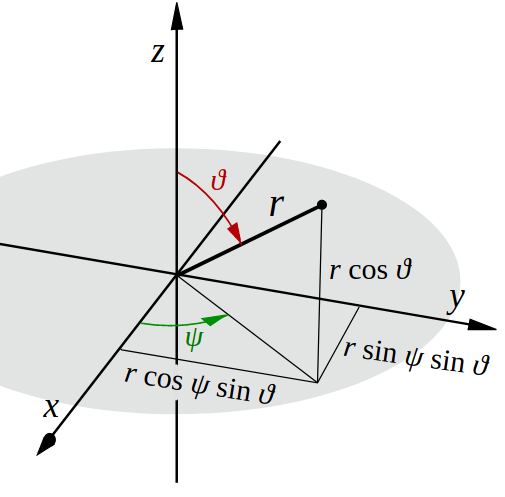 | 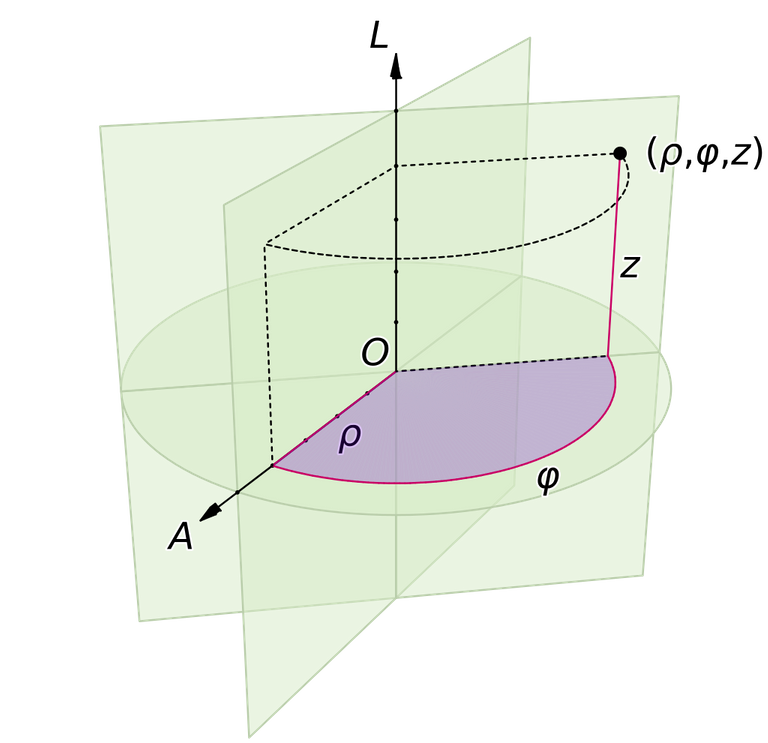 |
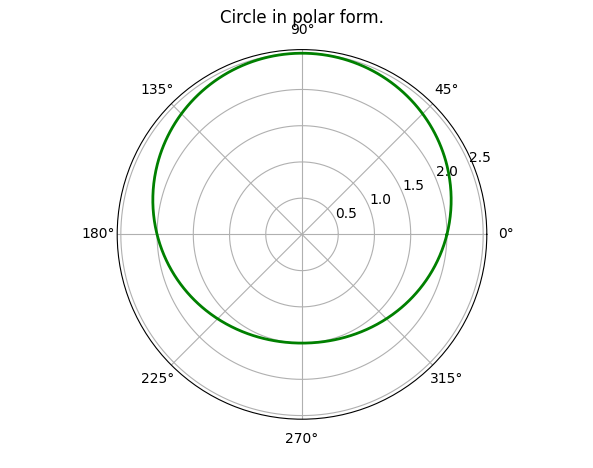
So, let's try plotting a circle in polar form using Matplotlib...
| Code | Plot |
|---|---|
 | 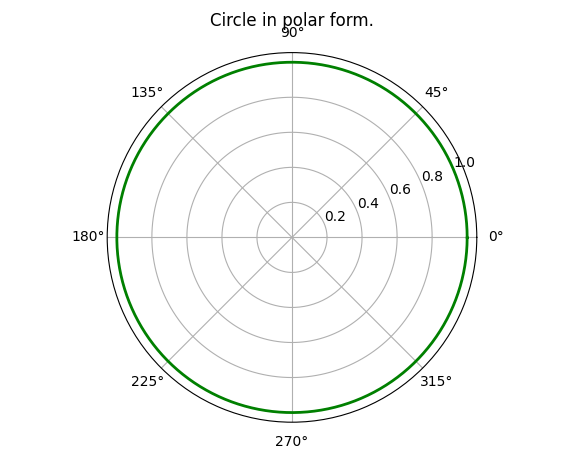 |
Notice: the grid is very different in this case, as compared to the circle we plotted in Cartesian coordinates.
Of all the above mentioned trig. functions, the sin (or cos) functions turn out to be the most useful as they can be used to model a large variety of things for example sound waves.
Play Time!
Let's try to fiddle with the sin function a bit, and see what all different forms we can get:
- Twirling Shapes:
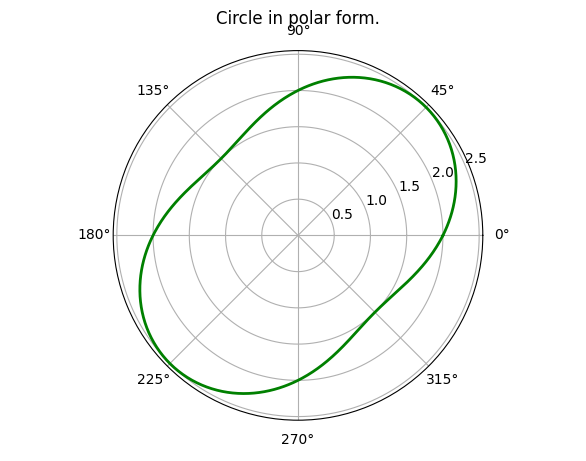
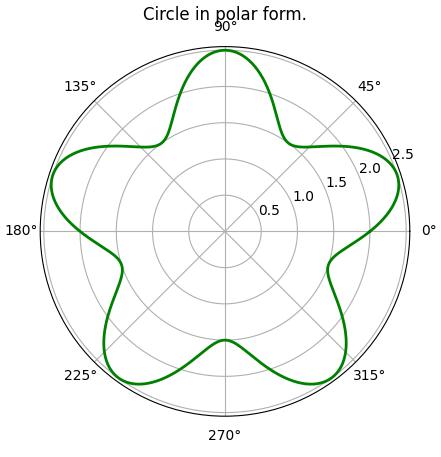
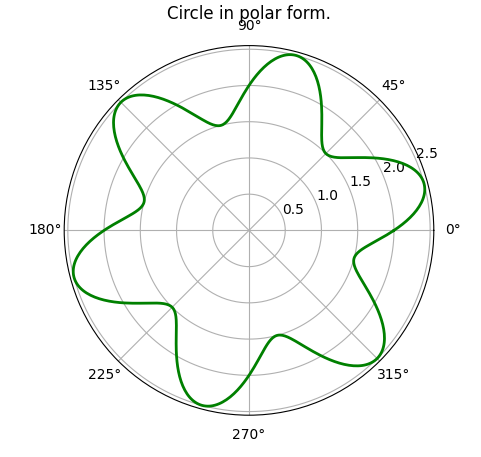
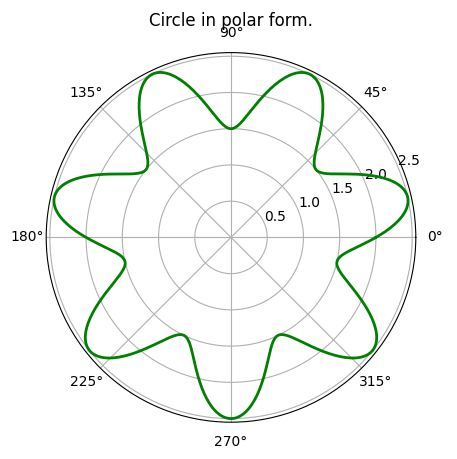
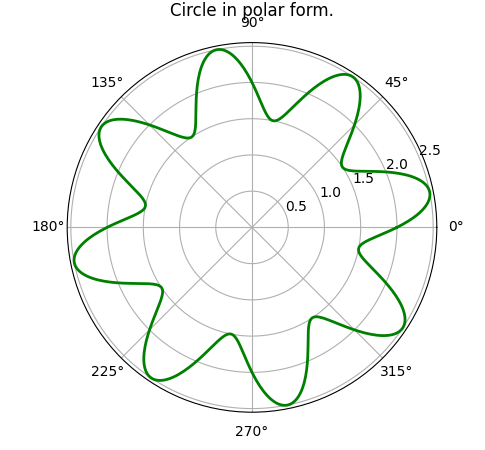
If you look at the code for the circle, in polar coordinates, you'll find that we are somewhat storing the y-coordinate of a straight line parallel to the x-axis. What if we instead take a sin curve and warp it around the center! For that we just need to to store the amplitude of the sin curve in thedistarray.
| S no. | Untwirled Shape | Twirled Shape |
|---|---|---|
| 1 | 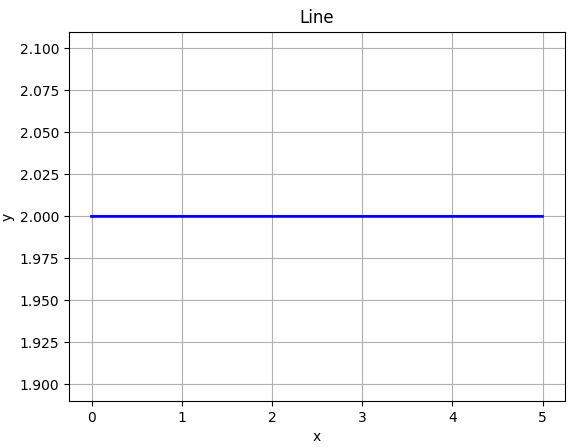 |  |
| 2 | 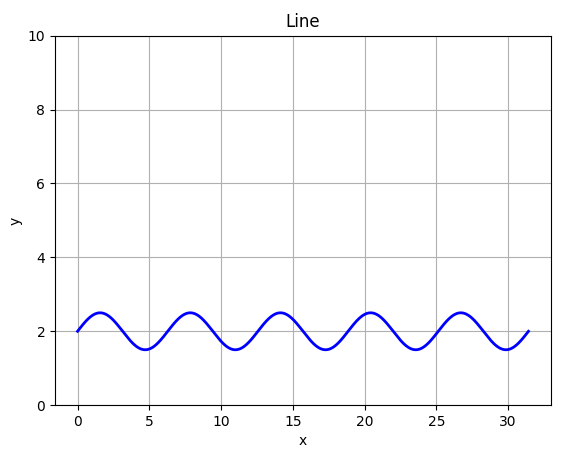 | (Given below as a separate table...) |
n = 1 | n = 2 | n = 3 | n = 4 | n = 5 |
|---|---|---|---|---|
 |  | 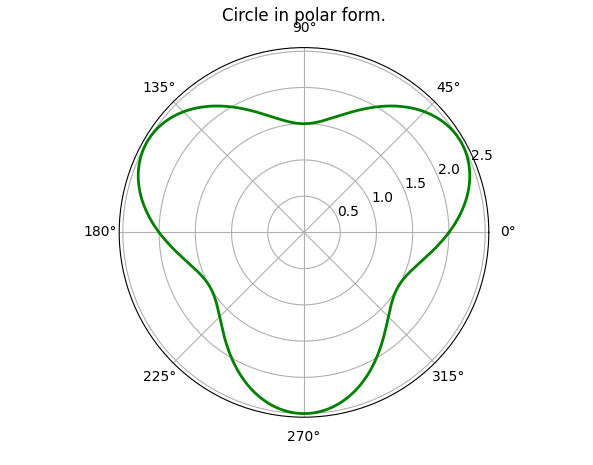 | 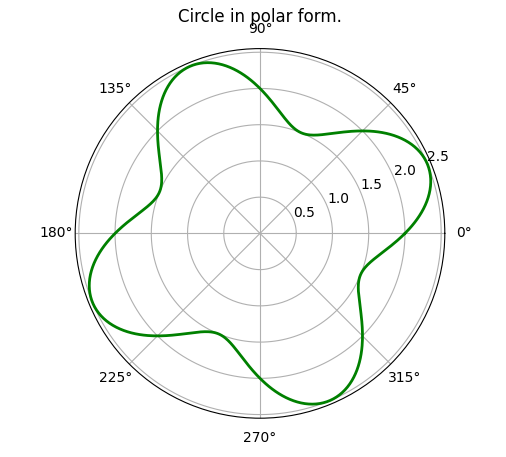 |  |
n = 6 | n = 7 | n = 8 | n = 9 | n = 10 |
 |  |  | DIY | DIY |
Well, that was getting a bit boring, so I left it as a "Do It Yourself" exercise. But, the pattern was very interesting!
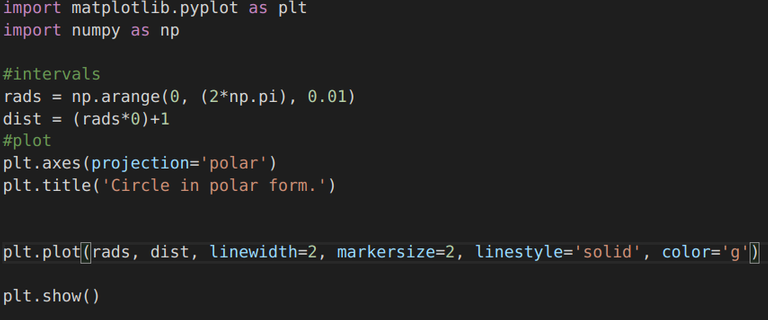
The code for the twirled sin curve is:
import matplotlib.pyplot as plt
import numpy as np

#intervals
rads = np.arange(0, (2*np.pi), 0.01)
n = 8
dist = 0.5*(np.sin(n*rads))+2

#plot
plt.axes(projection='polar')
plt.title('Circle in polar form.')


plt.plot(rads, dist, linewidth=2, markersize=2, linestyle='solid', color='g')

plt.show()
Changing the value of
nof course gives rise to the different patterns that we get!
But, what happens when n is not an integer?!
| Changes made in the above code | Plot |
|---|---|
n = 7.21 | 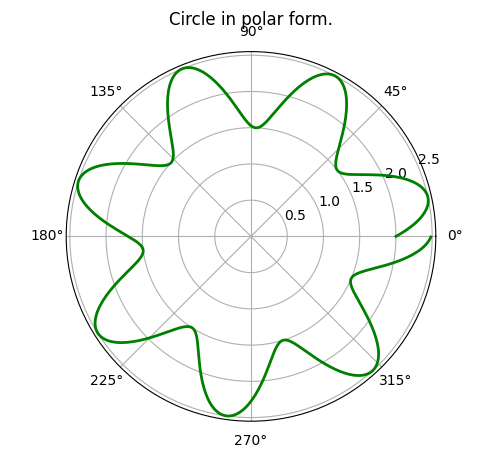 |
n = 7.21 and rads = np.arange(0, (20*np.pi), 0.01) | 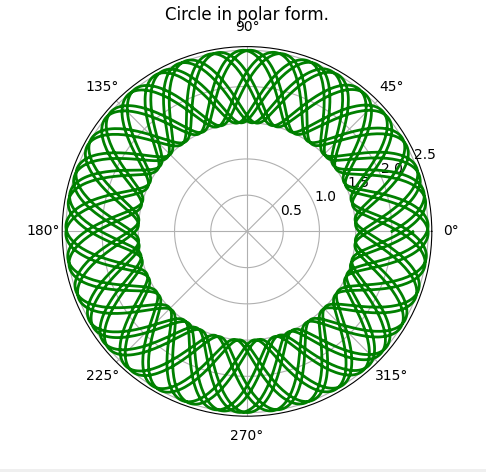 |
Wow! That's an interesting pattern, try playing with this code, and adding more curves to the plot, then twirling them, you may get another exotic pattern!
NOTE: The above shown patterns have applications in Quantum Mechanics, and are somewhat the basic principle behind the De Broglie Hypothesis, and quantization of the momentum of electrons in an atom. Those patterns given above where
nis not an integer will have a discontinuity in them, and hence cannot represent an "electron wave" around the nucleus of an atom.
- Modelling Real World Systems (Simple Pendulum)
When we leave a simple pendulum oscillating, we find that it gradually comes to rest. So, if we try to model its amplitude varying with time, we'll have to combine our knowledge of exponentially decaying function with that of the sin curve...
| Plot | Code |
|---|---|
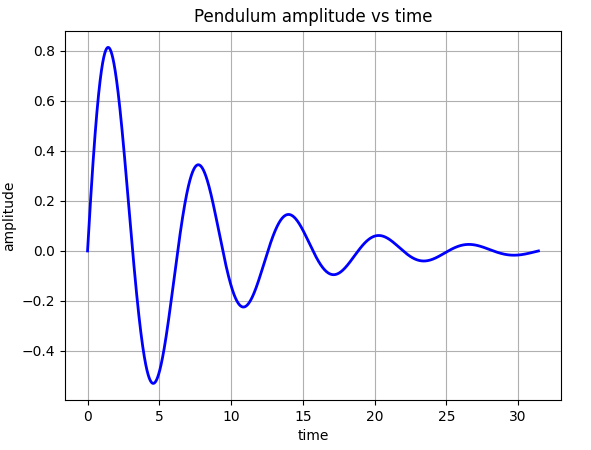 | 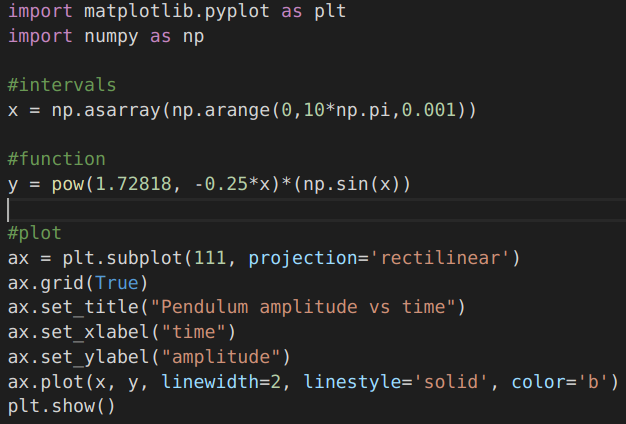 |
...and there you go, isn't this what we expected?!
So, that's all for this article...I hope I was able to make it sufficiently interesting!
...and well, yes, Matplotlib can do much more than what we saw in this article...so keep experimenting...and learning!
Thanks to:

Open-source Plotting library in Python.
(For documentation, please visit: https://matplotlib.org/)
Credits
All media used in this article either belong to me or are in Public Domain, unless specified.
- Snow Flake image: https://wikipedia.org, CC License.
- Cricket Sound clip: Wikipedia, Creative Commons Attribution-Share Alike 3.0 Unported License
- Sunflower, fibonacci spiral: Wikipedia.org, CC License
- The Mandelbrot Set: Wikipedia, CC BY-SA 3.0
- Cartesian System: Wikipedia, Public Domain
- Polar System: Wikimedia Commons, CC BY SA 3.0
- Cylindrical System, Public Domain
Thanks for sparing your time!
Keep learning.
M.Medro
Very interesting article, and I finally I can imagine the sound of my bees!
!discovery 40
Thanks! Haha! Great that you will now be able to understand them better! 😄
This post was shared and voted inside the discord by the curators team of discovery-it
Join our community! hive-193212
Discovery-it is also a Witness, vote for us here
@tipu curate
@tipu curate
Great...I have decided that when I pass the quarantine I want to study computer engineering, I would like to learn how to program...no doubt this is the present and future
Haha! Thanks! Hope you'll enjoy programming!
Excelente publicación. Desde muy joven, tenía cierta preocupación por lo complejo de la matemática, hasta que tuve la oportunidad de leer "El Hombre que Calculaba", de Malba Tahan. Desde ese momento pude comprender que la vida está regida por los principios matemáticos. Las aplicaciones son infinitas, tal como Ud. lo ha demostrado en este post. aliriera
Excellent post. From a young age, I had some concern about the complexity of mathematics, until I had the opportunity to read "The Man Who Calculated" by Malba Tahan. From that moment I was able to understand that life is governed by mathematical principles. The applications are endless, as you have shown in this post. aliriera
Thanks a lot for the appreciation!
Thanks for your contribution to the STEMsocial community. Feel free to join us on discord to get to know the rest of us!
Please consider supporting our funding proposal, approving our witness (@stem.witness) or delegating to the @steemstem account (for some ROI).
Please consider using the STEMsocial app app and including @stemsocial as a beneficiary to get a stronger support.
Math used to be one of my favorites in school but that's ages ago :o
Oh! Haha! Maybe you can do revision!! Haha!
I don't think my brain can take that anymore at my age haha 😄
Hahaha!!