Model Madness 2020: Win Ratios Iterator Model
Today, we're going to cover the first new model developed for Model Madness 2020. Hopefully this model adds some much needed diversity to our model set that has had a decent amount of agreement over the past two tournament cycles so far. I'll cover some of the math / programming ideas involved and show the Top 10 that Win Ratios Iterator (WPI) produced for today.
I will also cover the Southern Conference tournament which is set to start tomorrow as well. Three tournaments are slated to start on Saturday so we'll cover those tomorrow before showcasing a second new model this weekend.

Win Ratios Iterator Model
Inspired by Expectation-Maximization and optimization, I wanted to try my hand at a more exploratory iterative process. To explain this, I'll briefly mention the difference between how iterative discovery (which WRI uses) and plain metric calculation (which the 2019 models use) work.
Normal metric calculation works by either looping over a set of teams or schedules several times calculating statistics by performing a simple calculations a few times. The mean of a set of numbers is an example of this process. Iterative discovery works by taking a variable or variables, running them through an equation to generate a new variable(s) and then using that new variable to repeat the process with the same equation until it either converges or reaches an iteration limit. Gradient decent optimization is an example of this process.
So how does the Win Ratios Iterator work? First we start off with a variable: a team's win ratio. Next, we run through an equation. In this case, the equation is the summation of the result of a game multiplied by the opponent's win ratio divided the number of games in that schedule. This gives us a new ratio.
We then run that result through min-max normalization to bound the result between 0 and 1. Min-max normalization compares a value with the maximum and minimum value in the set and linearly scales the value to fit within the 0 to 1 range. Since the original win ratio was bounded between 0 and 1, this works great and means we can iterate indefinitely until we done. The equation looks like this:

N is the number of games in the schedule, n is a specific game in the schedule, i is the current iteration, with i+1 being the value in the next generation. The Min-Max Normalization function basically subtracts each of the unnormalized values by the minimum unnormalized value then divides by the difference between the minimum and maximum values, bounding the new value between 0 and 1.
The Win Ratios Iterator repeats this process 1000 times before getting a final win ratio. That's pretty much it. But of course that wasn't satisfying enough and I felt like the model was underrating teams with weaker schedules because their schedules were filled with low opponent win ratios which shrunk iteration after a few iterations. To compensate, I introduced margin of victory into the equation as those underrated teams typically dominated their lesser competition.
To introduce margin, I used the sigmoid function to calculate partial wins like I did for the MASPM model. I used the exact same sigmoid function (seen below) and used that value in the place of the result.
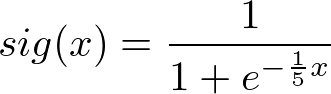
The nice thing about this sigmoid function is that sum of the negative value and positive value of the same number plugged into the function adds up to 1 just like wins and losses (0 + 1 = 1). This property exists because the curve is symmetrical and crosses 0 at 0.5 which can be seen in the graph below:
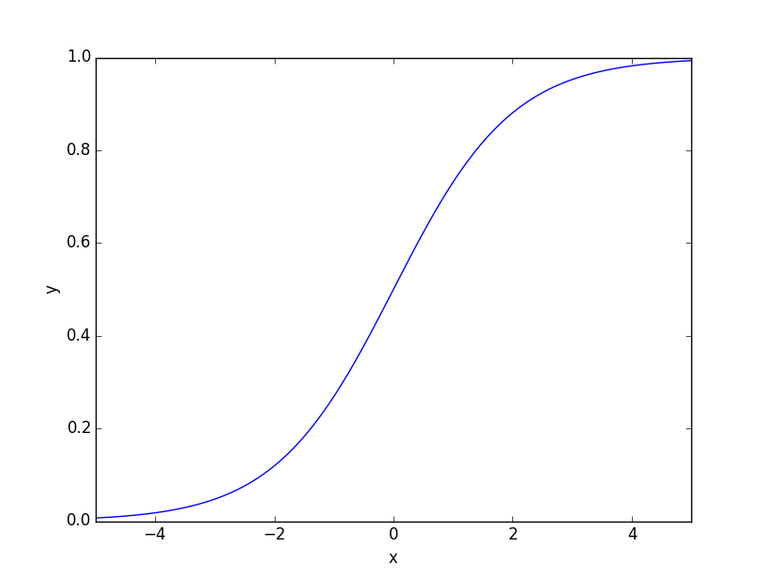
So, I use partial wins to calculate the starting win ratio and the iterative win ratio over 1000 iterations. The results still didn't really like the strong teams in weak conferences, so I then multiplied the iterative win ratio by original win ratio to balance final WRI. Below are the Top 10 teams calculated as of March 5:
WRI Top 10 (March 5)
| Team | Record | AP Poll | WRI |
|---|---|---|---|
| Kansas | 27-3 | 1 | 0.834 |
| Baylor | 26-3 | 4 | 0.740 |
| Duke | 24-6 | 12 | 0.644 |
| Michigan State | 21-9 | 16 | 0.623 |
| Creighton | 23-7 | 11 | 0.603 |
| Seton Hall | 21-8 | 8 | 0.594 |
| Maryland | 23-7 | 9 | 0.592 |
| Florida State | 25-5 | 7 | 0.591 |
| Dayton | 27-2 | 3 | 0.590 |
| Louisville | 24-6 | 10 | 0.577 |
As you can see, the AP poll and WRI values overlap some with some notable inclusions and exceptions. The notable inclusions are Duke and Michigan State who given their powerhouse statuses often play some of the toughest non-conference schedules each year. The notable exclusions are #5 San Diego State (WRI: 12) and #2 Gonzaga (WRI: 22). Dayton also appears somewhat lower, but are still in the Top 10. Note that before I performed the final multiplication at the end, Gonzaga was showing up outside the Top 50.
Although some of these teams might be lower than their record or AP Poll ranking would have them, I like the diversity this model gives. The small schools dominate last year's models, so it's nice to give power back to the traditional heavy-weight schools to balance the suite. Now onto Friday's only tournament with WRI now included:
Southern Conference
Last Year's Champion: Wofford
Leaders
| Team | Record | Seed | EDM | SPM | MASPM | WRI |
|---|---|---|---|---|---|---|
| East Tenn State | 27-4 | 1 | 2130.632 (45) | 0.1711 (18) | 0.1415 (23) | 0.240 (84) |
Challengers
| Team | Record | Seed | EDM | SPM | MASPM | WRI |
|---|---|---|---|---|---|---|
| Furman | 25-6 | 2 | 2120.051 (46) | 0.1343 (39) | 0.1096 (46) | 0.209 (102) |
| UNC Greensboro | 23-8 | 3 | 2029.545 (64) | 0.1104 (61) | 0.0999 (56) | 0.198 (113) |
Outsiders
| Team | Record | Seed | EDM | SPM | MASPM | WRI |
|---|---|---|---|---|---|---|
| Western Carolina | 18-11 | 5 | 1615.889 (152) | 0.0421 (128) | 0.0340 (130) | 0.103 (197) |
| Chattanooga | 19-12 | 6 | 1749.683 (119) | 0.0328 (141) | 0.0244 (146) | 0.102 (198) |
| Mercer | 17-14 | 4 | 1637.740 (146) | -0.0123 (191) | -0.0162 (194) | 0.082 (230) |
East Tennessee State leads the Southern Conference going into this tournament with a strong 27-4 and Top 50 ratings from our 2019 models, but the WRI suggests that their schedule leaves a little to be desired playing in a weaker conference. Right now they are squarely on the bubble and can't really afford to lose without risking being relegated to the MIT tournament as consolation.
Furman and Greensboro represent ETSU's real competition at the 2 and 3 seeds respectively. Both are Top 75 in the 2019 models, but hovering around the 100 mark for the WRI. Furman is just outside the bubble, but will probably need to win out to be considered.
Western Carolina, Chattanooga and Mercer are present potential outsider threats that could take out one of the top 3 if they have a down day. Unless, ETSU loses this is probably a 1-bid league, but any of these teams will be dangerous first round opponents to a higher seed if they make it to the national tournament.
Congratulations @statsplit! You have completed the following achievement on the Steem blockchain and have been rewarded with new badge(s) :
You can view your badges on your Steem Board and compare to others on the Steem Ranking
If you no longer want to receive notifications, reply to this comment with the word
STOPTo support your work, I also upvoted your post!
Do not miss the last post from @steemitboard:
Vote for @Steemitboard as a witness to get one more award and increased upvotes!