🔬#MESExperiments 15: Gyroscopes Tend to Rise Until Precession Rate Has Peaked #Interesting
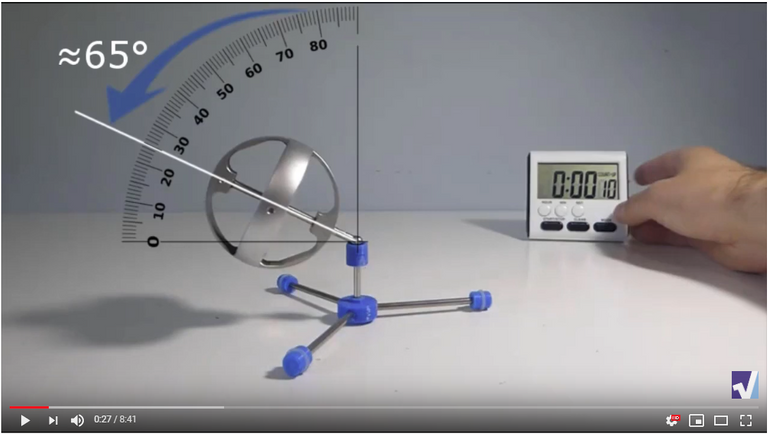
In #MESExperiments 15 I go over the process of very tediously measuring a gyroscope’s angle of steepness for each precession revolution in order to analyze and learn from the data. This specific gyro test had a starting angle of 65° from the vertical and rose 45° to a final risen position of 20°. I chose this specific gyro experiment to analyze because I wanted to compare the peak risen position with the precession rate or period, which in our case is defined as the number of precession revolutions per time (I used per minute hence RPM).

The data was compiled in the following Excel spreadsheet:
https://1drv.ms/x/s!As32ynv0LoaIh_JNJ8foLHD9vY433A?e=ffHY2v
Retrieved: 22 August 2019
Archive: Not Available
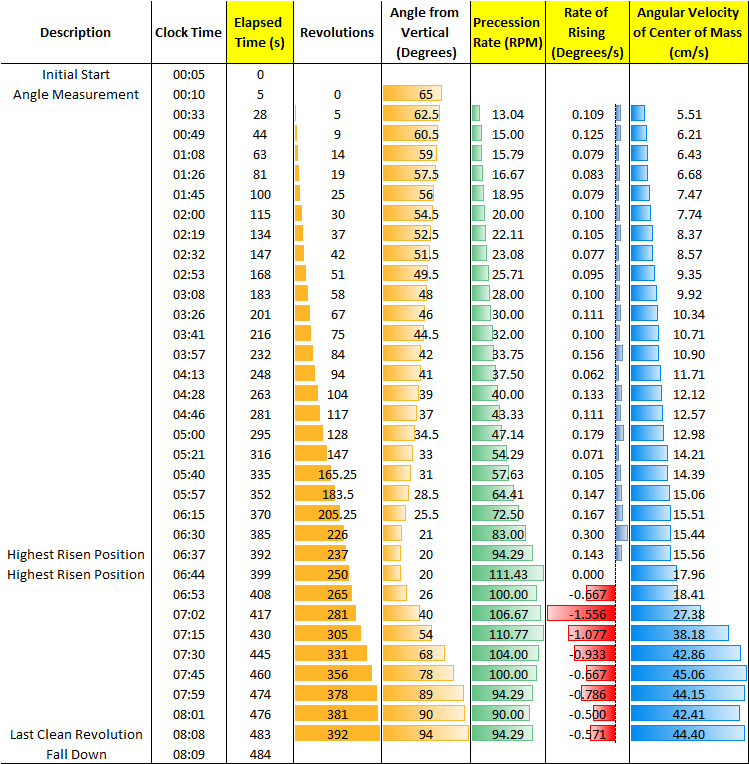
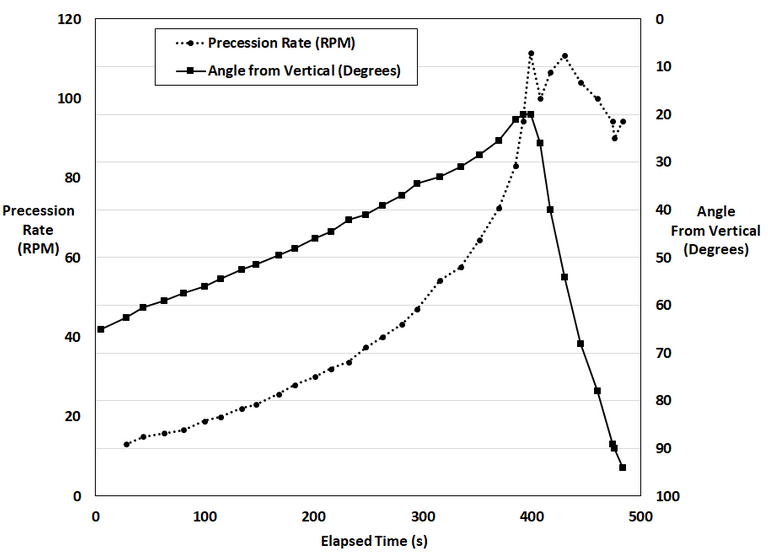
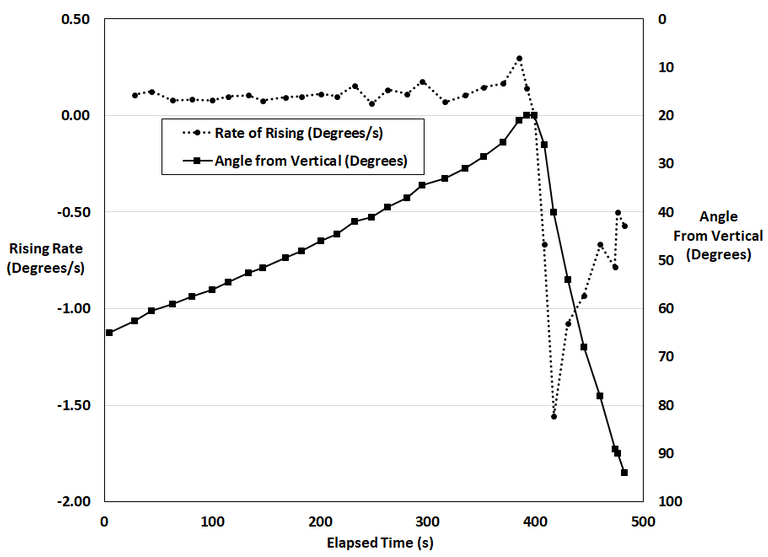
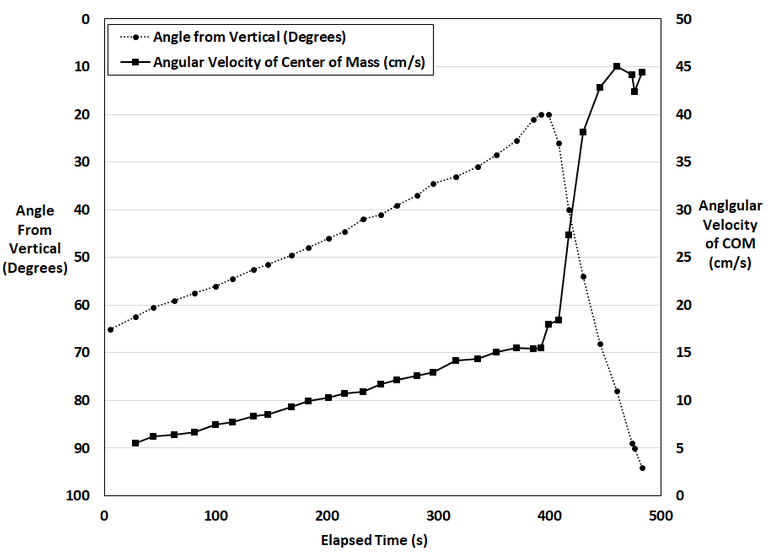
Analyzing the data shows that the angle from vertical tends to increase linearly while the precession rate or period increases more rapidly and is akin to an exponential rise. This pattern is followed until the gyro is at its highest risen position. Soon afterwards the gyro starts to descend downwards at a very fast rate and then its falling rate starts to slow down as the angle gets more steep. Likewise, just after the highest risen position the precession rate drops quickly but interestingly is sped back up again followed by a gradual slowing down as the gyro angle gets steeper.
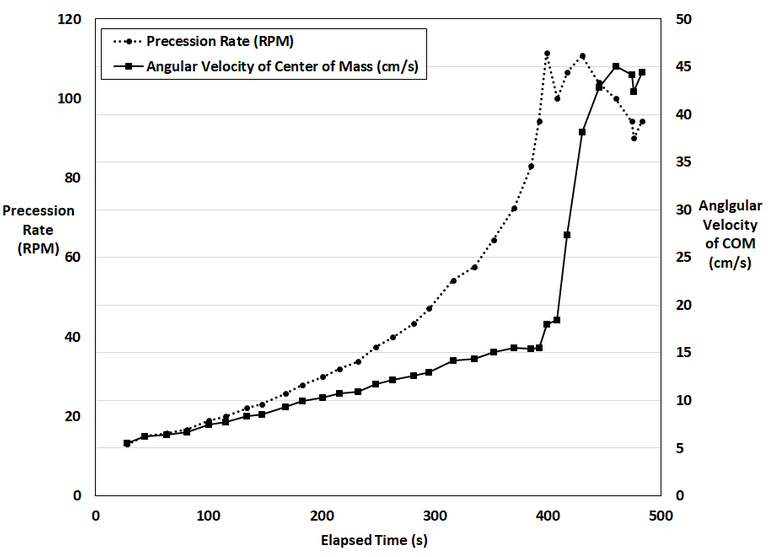
Furthermore, I calculated the angular velocity of the center of mass of the gyro while assuming it was at the center of the gyro rotor. Interestingly, the angular velocity initially increases linearly and at a much less rate than the exponentially rising precession rate. But once the peak risen position is reached the angular velocity spiked very rapidly until it appears to level off at about 3 times the velocity at the risen position.
These are some very interesting findings which I will explore in further experiments.
Measurement Data and Links
The link to the original unedited test is shown here: https://youtu.be/FRvrmTLHx_M
Angular Velocity Calculation
The angular velocity of the center of mass (COM) of the gyro, assuming the COM is the rotor, is derived as shown below. It is the distance the COM travels per time and can be calculated from the precession circle and the precession rate. Note though that in the Excel spreadsheet calculations I took an average of the precession rate and steepness angle for each interval.
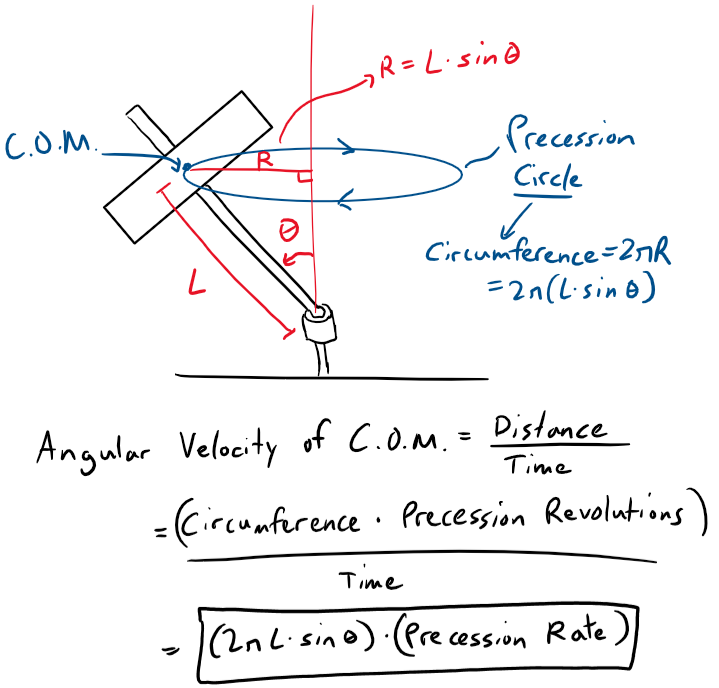
Note that the length from the stem to gyro rotor, hence the estimated center of mass (COM), is approximately 45 mm.
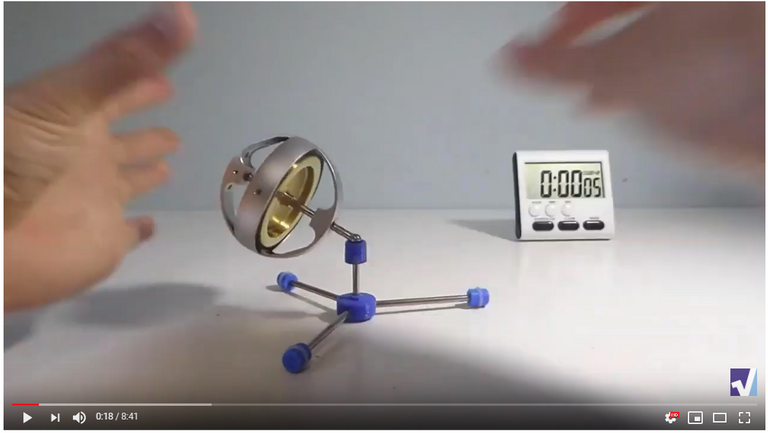
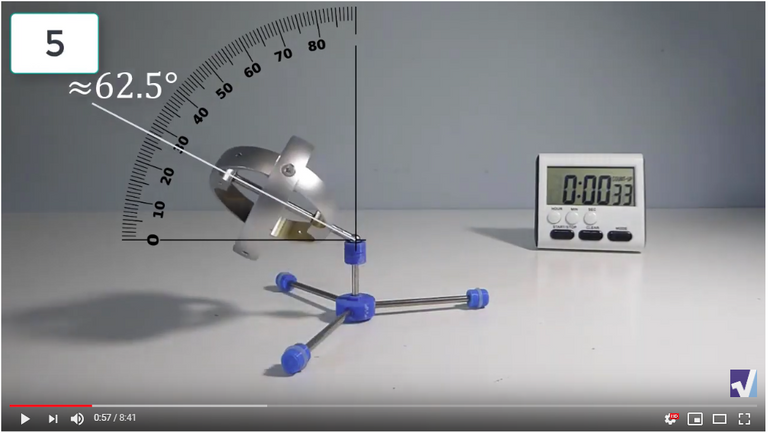
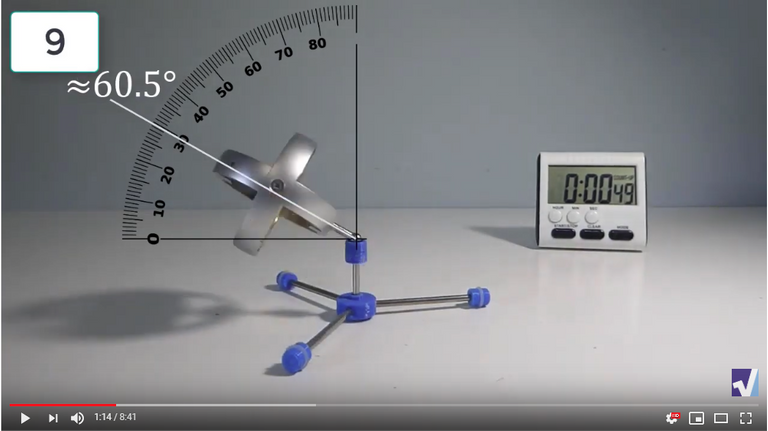
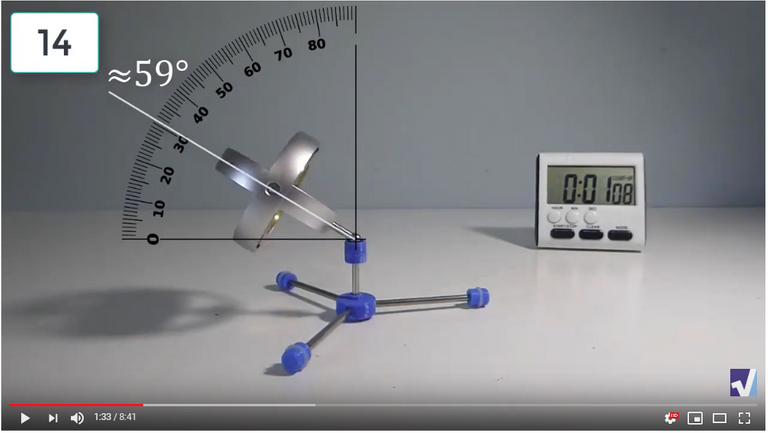
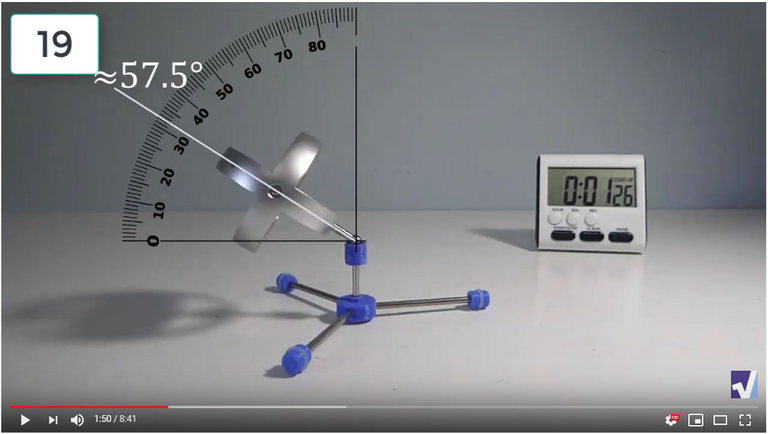
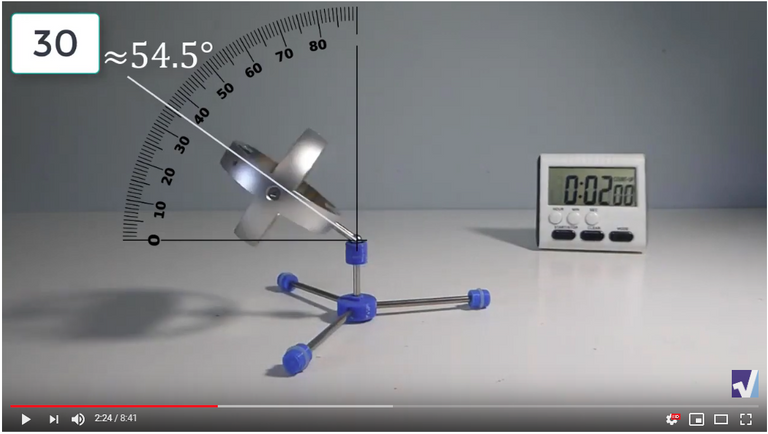
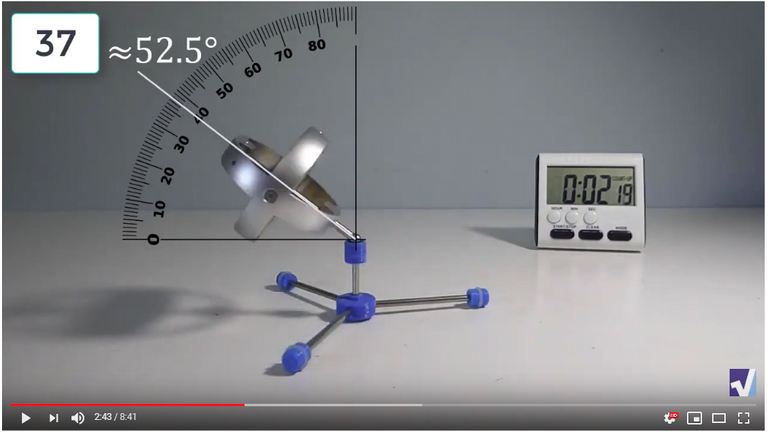
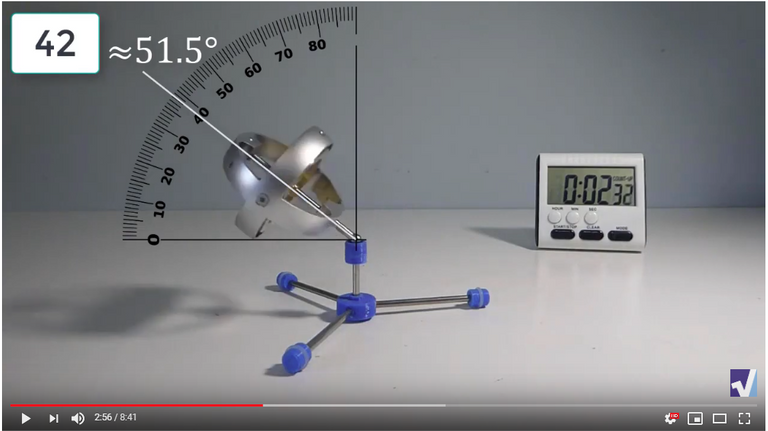
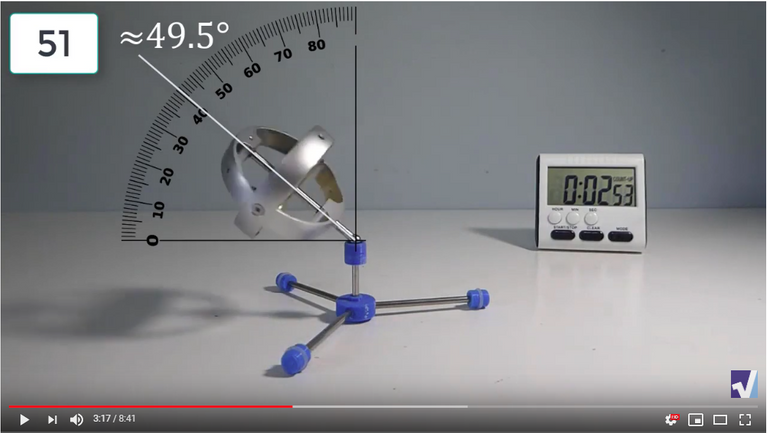
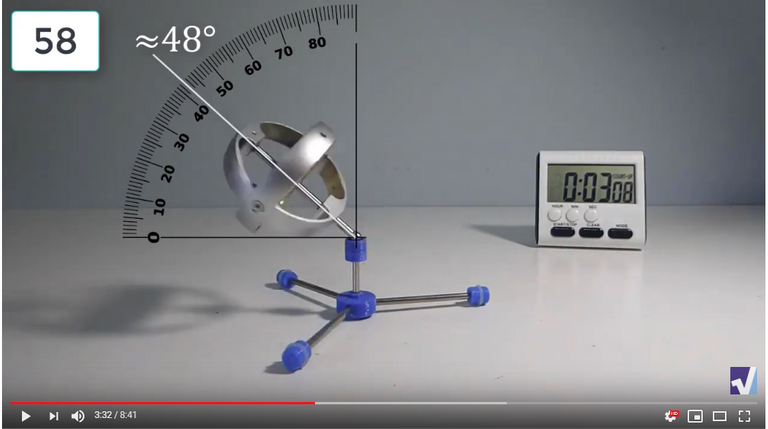
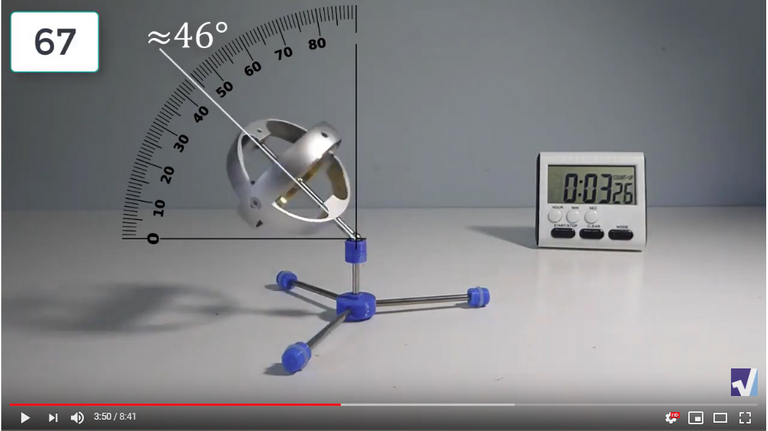
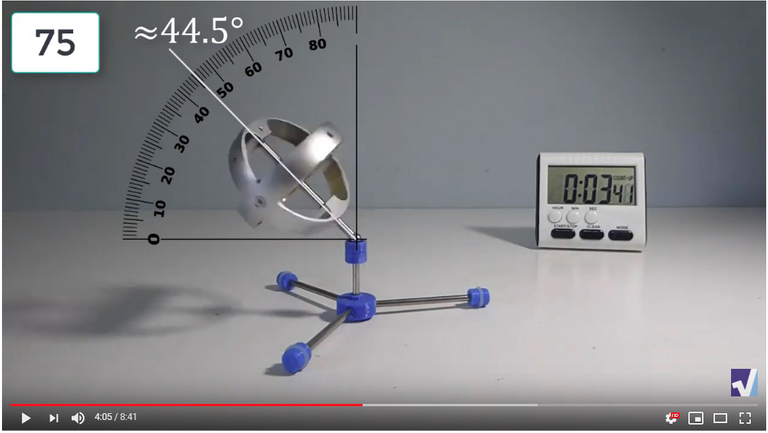
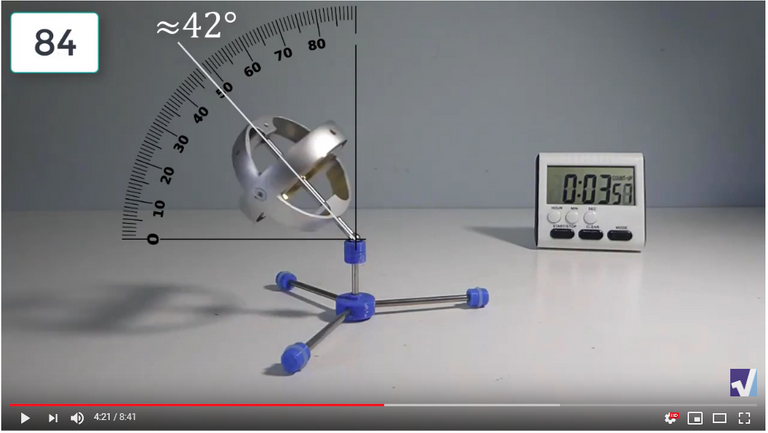
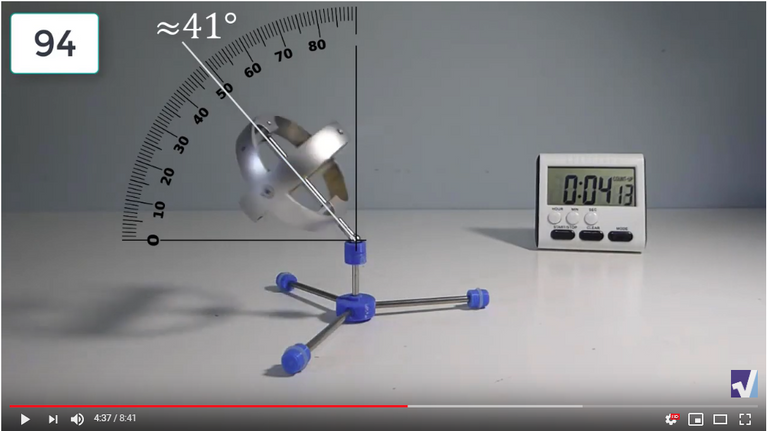
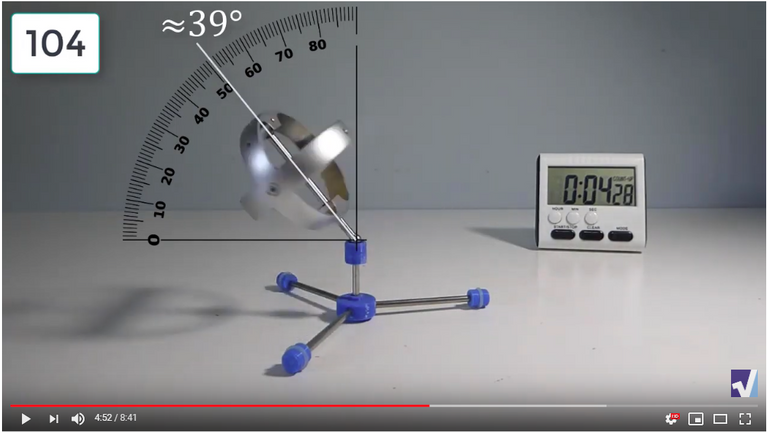
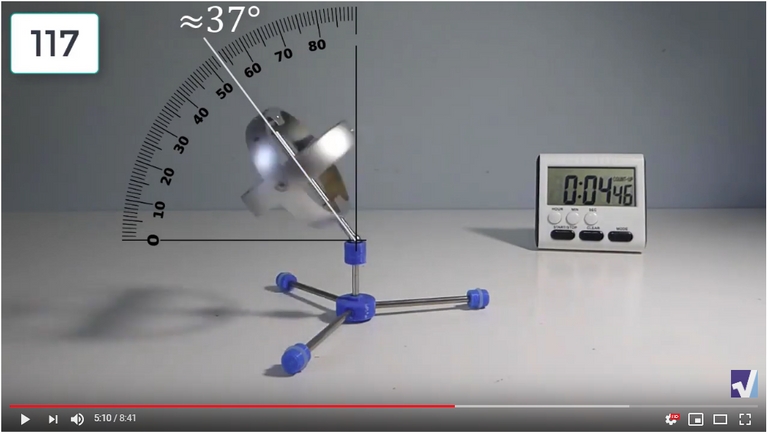
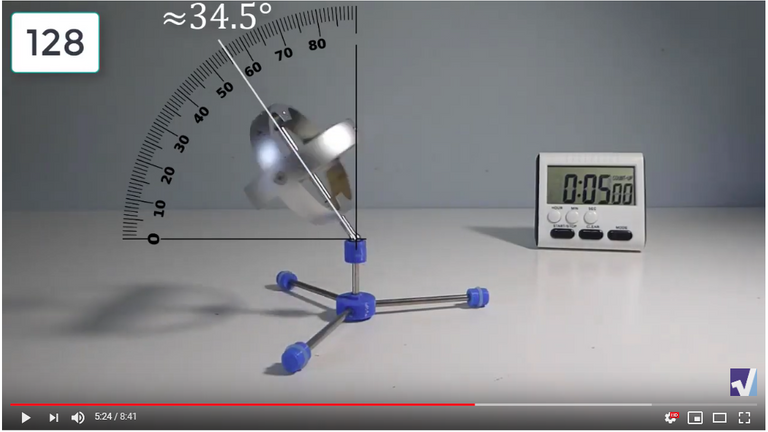
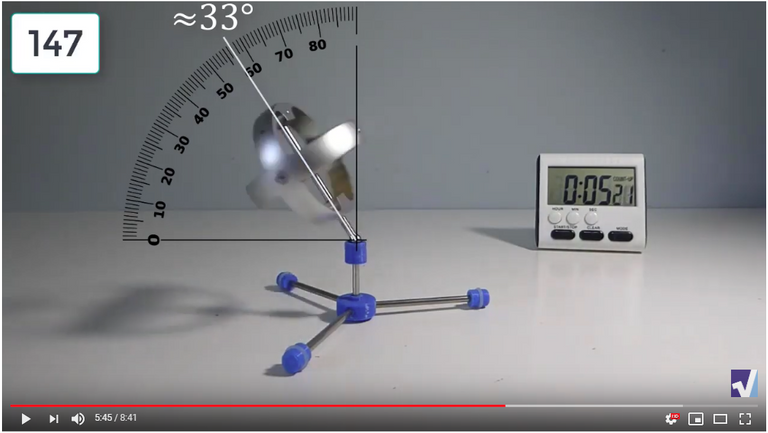
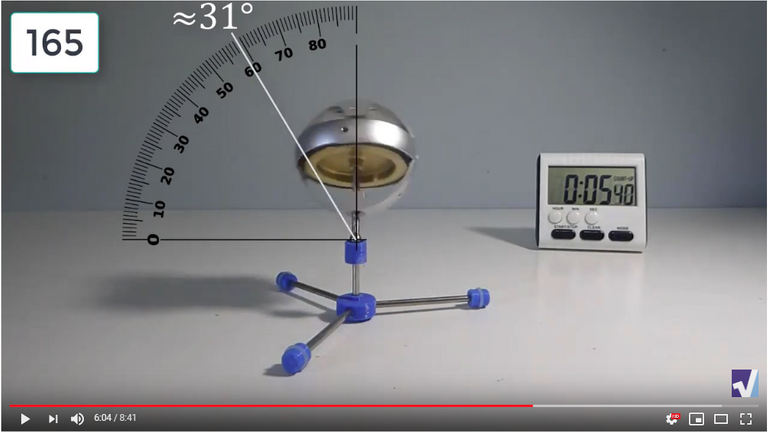
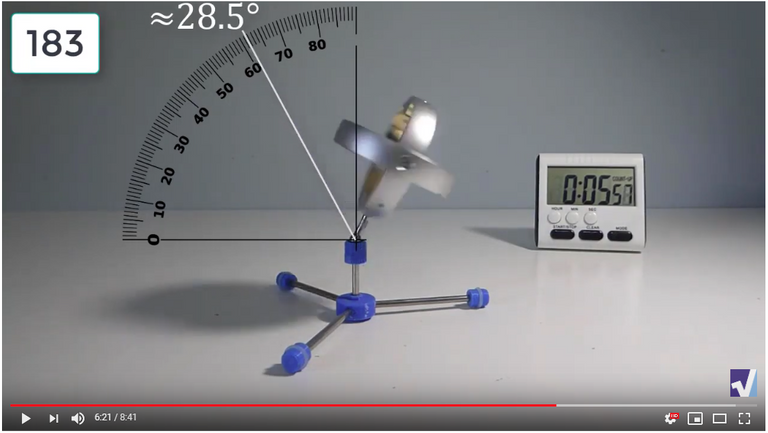
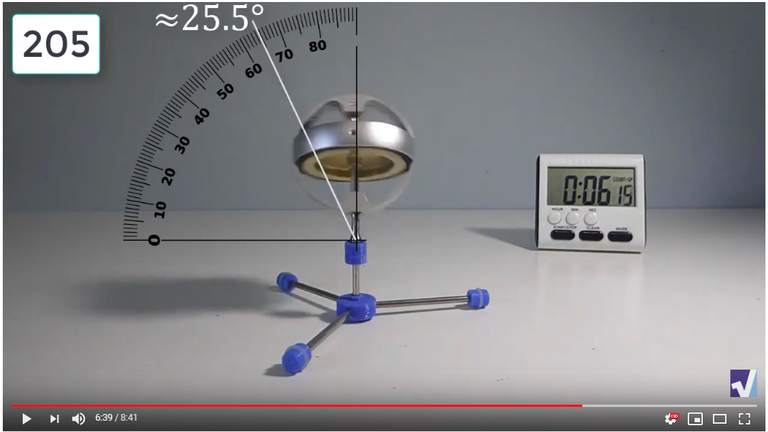
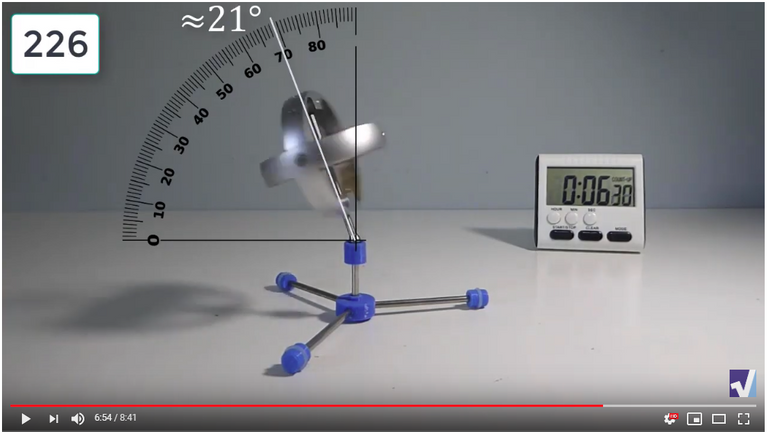
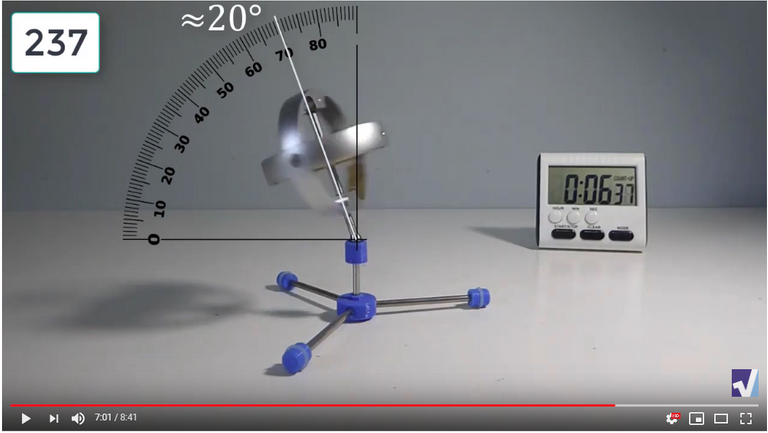
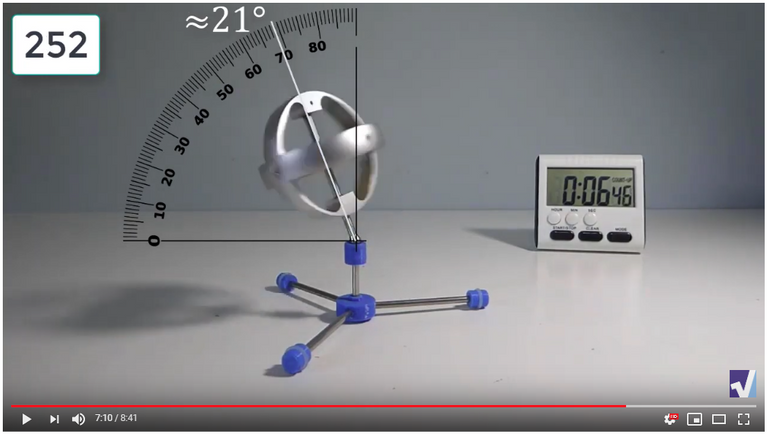
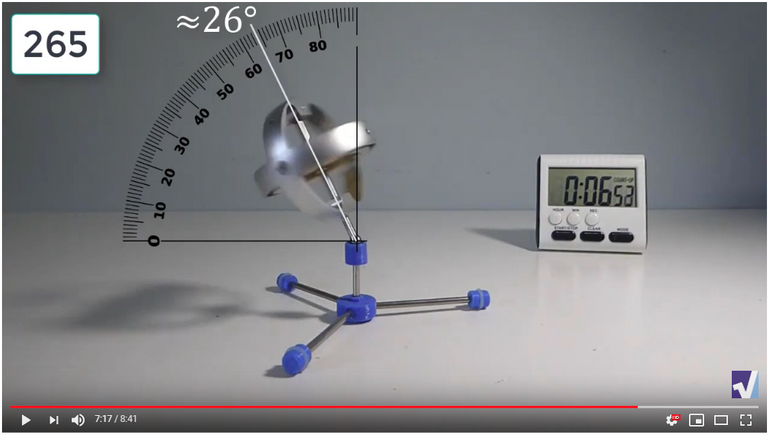
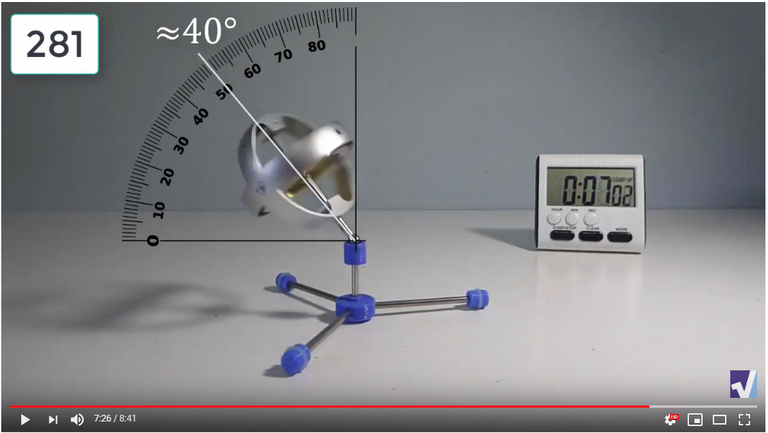
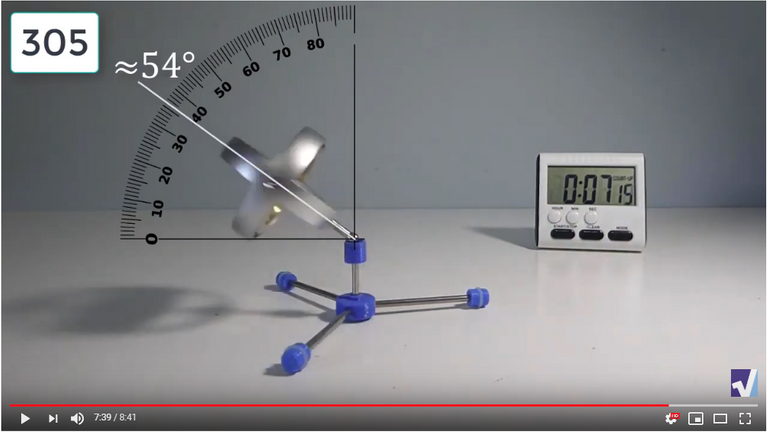
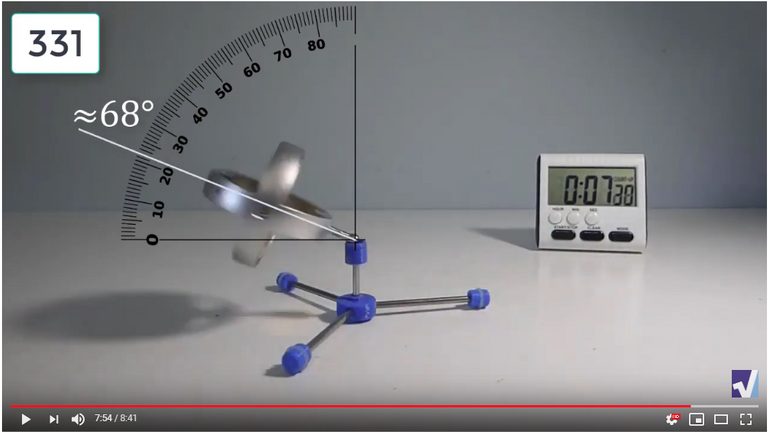
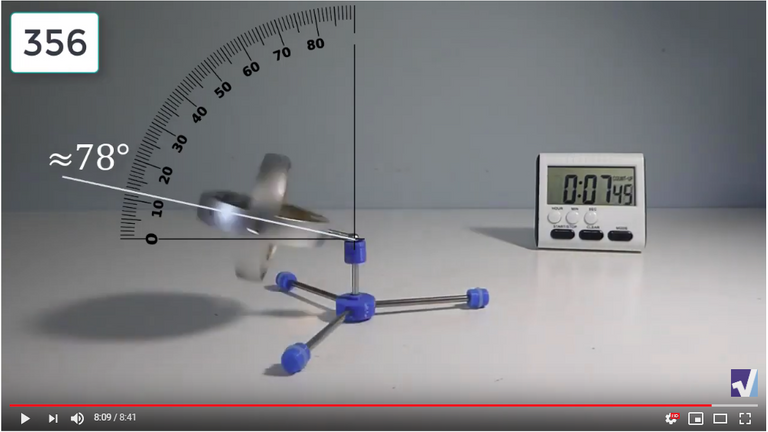
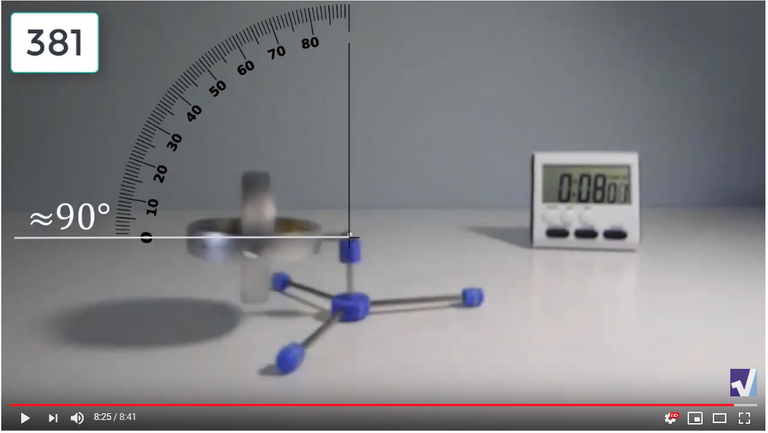
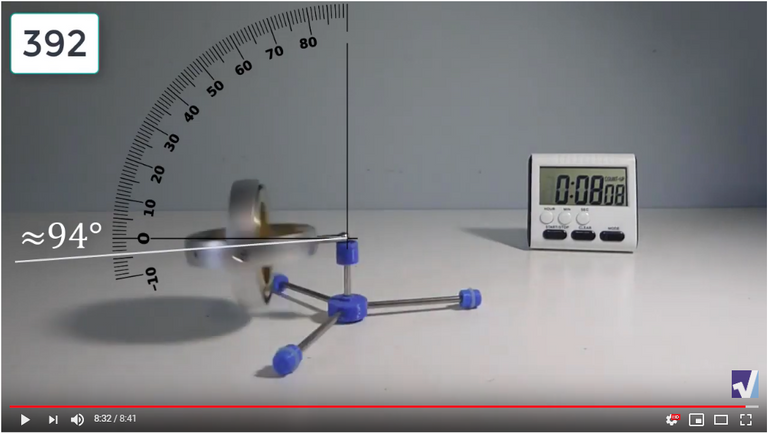
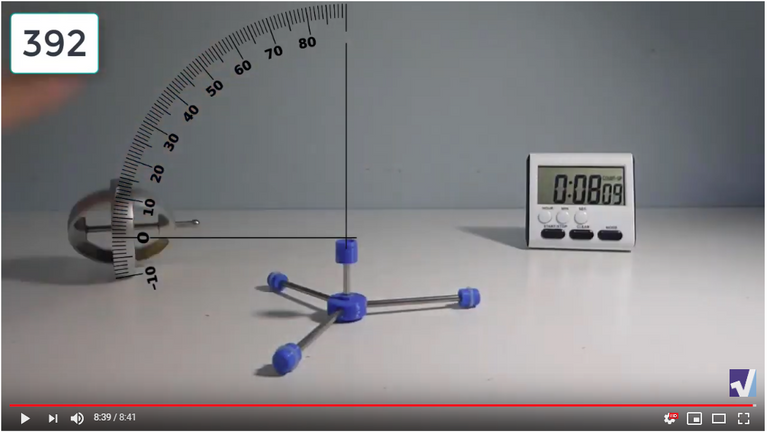
Screenshots of Each Time Interval
The data used in the spreadsheet is taken from the following screenshots at more or less every 15 seconds. The precession revolutions are counted from the initial angle measurement position.


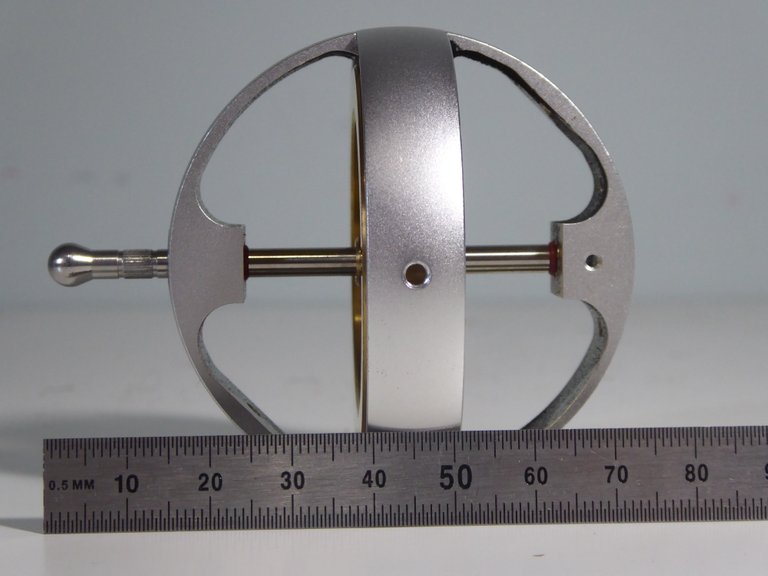
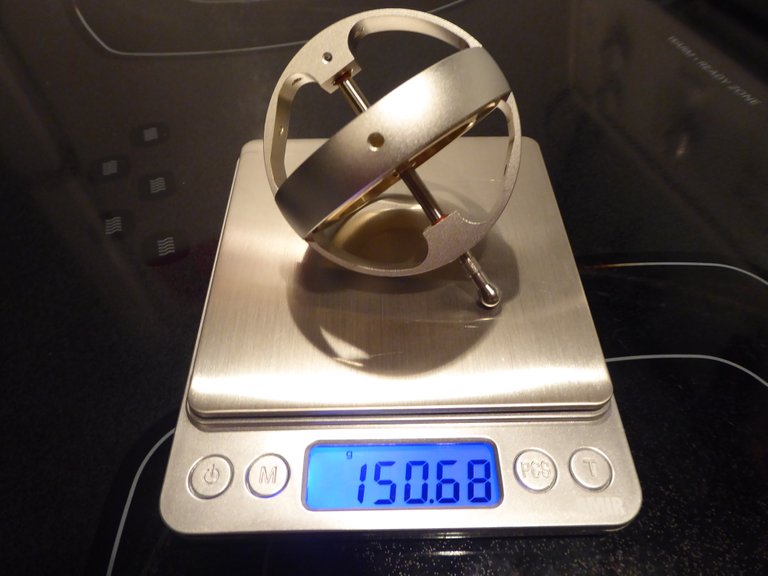
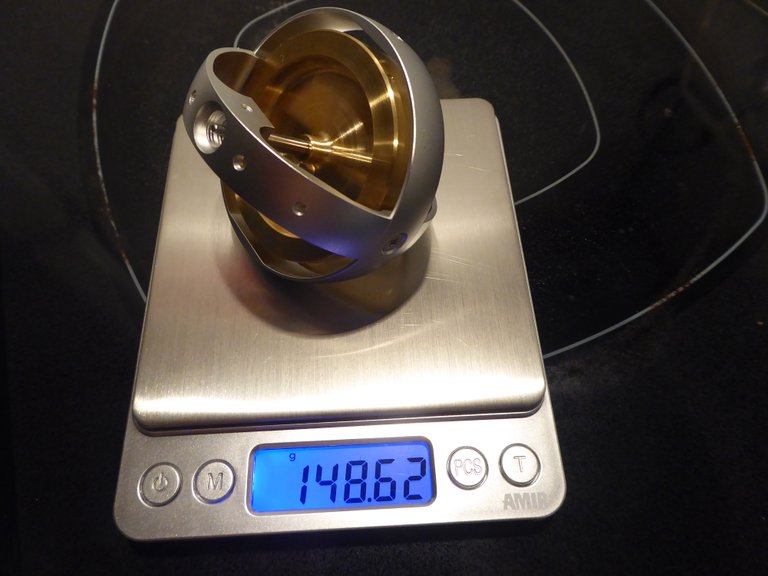
Gyro Weight Measurements
The weight of the gyroscope used in this experiment is 150.68 g with the stem, 148.62 g without the stem, and the stem is 150.68 – 148.62 = 2.06 grams.
Stay Tuned for #MESExperiments 16…
Watch Video On:
- 3Speak: https://3speak.tv/watch?v=mes/jebteqvv
- Odysee: https://odysee.com/@mes:8/mesexperiments-15-gyroscopes-tend-to:e
- BitChute: https://www.bitchute.com/video/xgRwRJ4Dp0Tn/
- Rumble: https://rumble.com/v1ybf42-mesexperiments-15-gyroscopes-tend-to-rise-until-precession-rate-has-peaked-.html
- DTube: https://d.tube/#!/v/mes/QmZbaPh4v62Gpn91Cauma61pySixod37zy95NUUL3DSghq
- YouTube: https://youtu.be/FRvrmTLHx_M
View More Amazing Videos:
- #MESExperiments Video Series: https://peakd.com/experiments/@mes/list
- DRAFT #MESExperiments Video Series: https://mes.fm/experiments-draft
- #AntiGravity Video Series: https://peakd.com/antigravity/@mes/series
- #FreeEnergy Video Series: https://mes.fm/freeenergy-playlist
Do you see this as proof of #FreeEnergy?
Why do you ask? The phenomenon you see in this video of a gyro rising on its own is unheard of in the entire world and requires all of physics to be rewritten. Interestingly, in Experiment 3 I show that the spin speed is not affected as the gyro rises or even when manually twisted, and thus a simple example of "free energy" as the energy is not coming directly from the gyro (i.e. the aether exists): https://steemit.com/mesexperiments/@mes/mesexperiments-3-gyroscopes-exert-inertial-forces-with-zero-loss-of-spin-rate-freeenergy
I go over this in extensive detail in my game-changing #AntiGravity Part 6: https://mes.fm/antigravity-playlist
But for a practical proof of #FreeEnergy and its continual suppression, one must first discover the truth of the most important event in all of history: 9/11.... https://mes.fm/911truth-playlist
Are you aware of the "null hypothesis." I think it's great you're doing these experiments. But one thing I can think of that would introduce this gyroscopic behavior is friction on the base.
On the other hand, if you're looking for a fringe explanation, are you aware of Quantized Inertia? There is a hypothesis that, at the levels of energy you're dealing with, it should be rather easy to verify that quantized inertia can oppose the force of gravity.
Personally, I'm not inclined to believe this hypothesis, but it's rather interesting to study.
hmmm I had not been aware of the null hypothesis. What do you mean by "friction"? In Experiment 1 I show that these gyro rising experiments are only possible with as little base friction as possible. And in Experiments 5, 6, and 7, I perform these tests on an ice block and they rise while also behaving massless: https://mes.fm/experiments-playlist
I'm also not aware of Quantized Inertia. But my gyro experiments prove that "inertia" itself as a distinct property of mass does not exist; as gyros precess with no angular momentum (see Experiment 4) or centripetal/centrifugal force; and hence no inertia.
I'm not big on theory but in #AntiGravity Part 6 I allude to a possible explanation and which has to do with (true) magnetism and the virtually unknown concept of "counterspace".
Also check out Experiment 9 for one of the most amazing demonstrations ever done...