Back from HiveFest - Combine and conquer (new phenomena at particle colliders)
HiveFest was an amazing experience. I truly enjoyed meeting so many members of our community in person, discussing with them, and obviously chilling with them. In addition, the event also allowed me to shed some light on the STEMsocial project, for which I hope for the best for the current academic year. An app and a meetup may be a good goal, and I will do my best to achieve this!
In the meantime, I now have again (a little bit of) time to start blogging about my research work, and I decided to discuss a scientific publication that my collaborators and I released last June. The article is now under review by the open access journal SciPost (see here), in which even the referee reports and our replies to them are public. Transparency is always the best (I am sure @sciencevienna will agree).
In a previous blog, I discussed how analyses at CERN’s Large Hadron Collider (the LHC) were designed, so that a needle (a signal) could be found in a haystack (the background). Sometimes, it is even more like looking for a specific needle in a needlestack…
[Credits: Original image from CERN]
Despite the complexity of the problem, many searches at the LHC are conducted, and their results are published day after day. This is illustrated in particular on the various wiki pages of the ATLAS and CMS collaborations of the LHC. For instance this page and that page list analyses targeting exotic phenomena.
In all these analyses, the strategy followed to single out a given needle from the haystack is explained, and data and theoretical predictions are compared. Experimental publications indeed show what we expect from simulations, and what we observe from real data. These taken together and compared allow us to extract information either on the exclusion of the existence of something new (the results are compatible with the background), or on a potential discovery (we have an excess or deficit in data).
A big chunk of my work is dedicated to how physicists could reuse experimental results to probe new models. The reason is that there exists a vast world of possible theories that all deserve to be probed, so that experimenters are outnumbered. Because of time and resources, software tools have consequently been designed so that anyone can simulate their own signal of interest, and assess its viability relative to data.
That’s the topic I want to discuss today. In the following, I start with a small summary about how LHC analyses are designed, and then move on with the interpretation of their results. Finally I discuss my last publication and explain what we did to improve the ‘re-interpretation process’ of the published results in the context of new theories, and how this could be made more accurate (and thus better). For those pushed for time, it is OK to directly jump to the last section of the blog (as I somewhat started with a summary).
From 1 petabyte of data per second to a physics analysis
The Large Hadron Collider is a machine in which about 600,000,000 collisions per second occur. It is therefore impossible to store all related information (we are talking about a rate of 1 petabyte per second, or 200,000 DVDs per second). This is however not a big deal, as only a (tiny) subset of all these collisions is relevant to any physics analysis.
Each detector in the LHC is therefore equipped with a trigger system (see the image below for an illustration) that is capable of quickly deciding whether a given collision is interesting, and thus if it has to be recorded on disk. The decision making process investigates the amount of energy deposited in the detector (the larger the better as we target physics at high energy), and the type of particles that have been produced (boring ones or interesting ones).
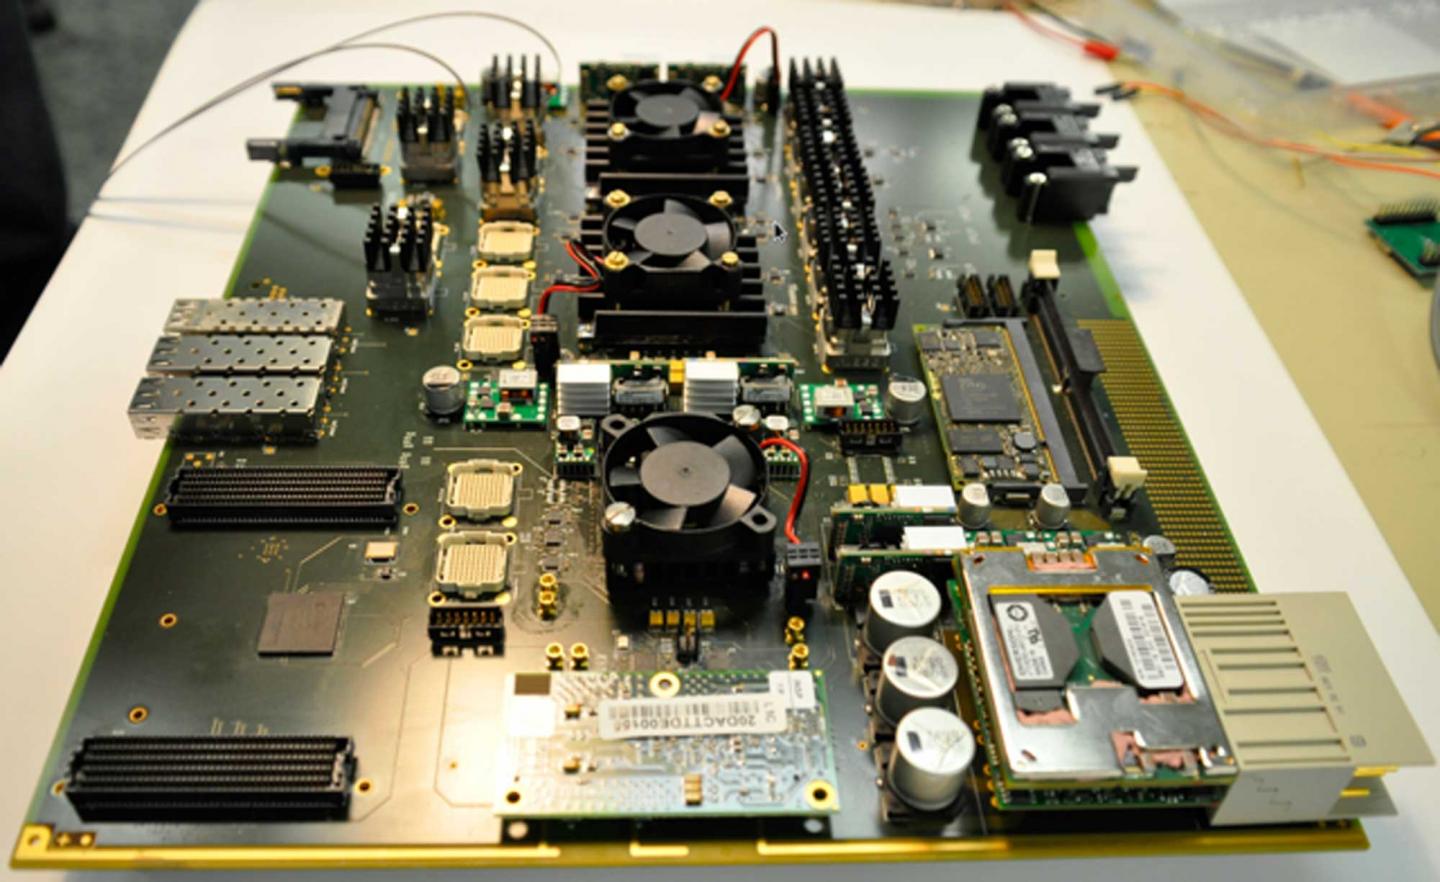
[Credits: ATLAS @ CERN ]
Thanks to the trigger system, the rate of recorded collisions is reduced to 200 megabytes per second, which is a quantity manageable by the electronics. We are however at this stage far from any physics analysis, and we need to analyse the corresponding 15,000 terabytes of data per year to study any signal of interest.
This is achieved by starting from the signal we target. Whatever is this signal (it could be associated with pink unicorns, the Standard Model of particle physics, or with any theory beyond the Standard Model), it is associated with signatures in a typical LHC detector. These signatures tell us which kind of subset of recorded collisions (or events) is relevant to us.
For instance, we may imagine a signal of a theory beyond the Standard Model that leads to two electrons and two muons, or another signal that gives rise to the production of two photons. This defines what we should look for, and therefore the beginning of our selection procedure that will reduce the huge amount of data to something more manageable.
In other words, once we know what we are looking for, we can start selecting events out of what has been recorded, and define a list of requirements. For instance, we may want to select all collisions that have given rise to two energetic photons. We may want these photons to be back to back. We may also require this criterion, or that one, and so on…
We thus come with our list of requirements, and we end up with a small (or at least not too large) number of selected events satisfying them (out of the terabytes of recorded collisions).
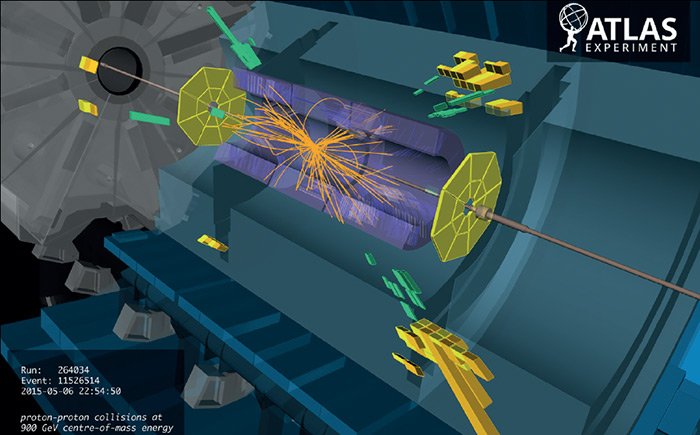
[Credits: CERN]
The above procedure leads to observations from data: a number of collisions D satisfy all requirements from our list. It next needs to be compared with predictions, so that we could achieve conclusive statements (in one way or the other). As already written above, the signal could be related either to a process of the Standard Model, or to a process inherent to a theory beyond the Standard Model. This does not matter: we always need to compare data with predictions to conclude.
For this purpose, we perform simulations of our signal, so that we could determine how many signal events are expected to satisfy the list of requirements discussed above.
Next, we have to do the same exercise with the background. In case of a Standard Model signal, the background consists of all other Standard Model reactions, and the corresponding number of events that would satisfy our list of requirements. In case of a new phenomenon, the background is almost the same, with the exception that we consider this time all Standard Model reactions.
Thanks to our simulations, we then know how many background events are expected, how many signal events are expected. In addition, we already know how many data events we have. We can thus run a statistics test, and see whether observations are compatible with the presence of the signal, or not. Both are useful, as this always means that we learn something (in one way or the other).

[Credits: CERN]
Analyses and sub-analyses - a blessing and a curse
Everything that I have written above is true for a given analysis. However, most LHC analyses include several sub-analyses, also known as signal regions.
For instance, let’s take a signal with two photons. We could design a first sub-analysis optimised for a situation where the two photons originate from a new heavy particle. Then, with very minor changes, we could design a second sub-analysis targeting photon pairs that could originate from the decay of a much heavier particle. We need only to adapt a little our list of requirements, which is why the two sub-analyses can be seen as part of the same analysis.
At the end of the day, we may end, after considering many variations of a given situation, with an analysis containing dozens or sometimes hundreds of sub-analyses slightly different from one another. And this is good. Let’s imagine we are looking for a signal of a new particle. We do not know the properties of this particle, in particular its mass and how it decays. Therefore, a large set of sub-analyses must be tried, so that every possibility for the new particle is optimally covered.
[Credits: CERN]
Having multiple sub-analysis also has another advantage. Let’s assume for the sake of the example that excesses in various sub-analyses would be observed. Taken one by one each individual excess may not be significant, so that data would be statistically compatible with the background hypothesis. However, when taken together, the excesses add up, and we may conclude about the existence of a hint for something new. This is the so-called ‘blessing’ of the title of this section of the post.
On the other hand, the combination of various sub-analyses cannot be done too hastily. There exist correlations, in particular relative to the background and the associated uncertainties, which must carefully be taken into account in statistics tests. This allows us to avoid being overly aggressive (in one way or the other) with our conclusions.
While this combination story is a beautiful one, it comes with a problem (the ‘curse’ of the title of the post): whereas all results published within experimental studies include correlations (as the information is internally known), anyone outside the LHC collaborations cannot handle them properly for the simple reason that related information is generally not public.
As a consequence, anyone outside a collaboration must be conservative, and should only rely on a single sub-analysis in any statistics tests. The subsequent results could therefore be quite off from what could be obtained through sub-analysis combinations.
A paradigm shift - correlation information made available
Recently, experimental collaborations have started to release more information. In particular, information on how to combine different sub-analyses of a specific analysis started to appear. Whilst this is by far not always the case, it is now up to us to show that this information is crucial, so that releasing it, which takes time, gets more motivation and could become systematic.
This is the problem that we tried to tackle in the scientific publication discussed in this blog. We updated a software that I co-develop for many years, so that correlation information could be used when testing the sensitivity of the LHC to any given signal (provided correlation information is available of course). It becomes thus possible to probe a signal by relying not only on the best sub-analysis of the analysis considered, but also on all sub-analyses of this analysis all together.
In order to illustrate how this is important, an image is worth 1,000 words. Let’s consider an extension of the Standard Model that includes a few light new particles that decay into each other. To simplify the picture, let’s imagine in addition that the masses of these new particles are driven by only two parameters, that I note M2 and MQ3. Small values of these parameters mean light new particles, and large values heavy particles.
The production and decay of the new particles lead to some signals that can be captured by existing analyses at the LHC. We consider two of them: an ATLAS analysis (ATLAS-SUSY-2018-31) and a CMS one (CMS-SUS-19-006). Each of the two analyses includes many different sub-analyses. The goal is to assess the sensitivity of the LHC to the model by means of the two analyses individually. For a given analysis, we will consider first only the best of its sub-analyses, and next the combination of all sub-analyses.
In other words, for each of the two analyses, we will estimate which pairs of values (M2, MQ3) are excluded when using the most optimal of all sub-analyses, and when combining all existing sub-analyses.
The results are shown in the figure below.

[Credits: arXiv:2206.14870]
In this figure, there are two sets of curves: the green ones related to the ATLAS analysis considered, and the teal ones related to the CMS analysis considered. Every configuration on the left of a dashed line is excluded when we consider only the best sub-analysis of an analysis, the green dashed line being related to the ATLAS analysis investigated and the teal dashed line to the CMS one. In contrast, every mass configuration on the left of a solid line is excluded after the combination of all sub-analyses, for a given analysis again.
As can be seen, combination leads to a substantial gain in sensitivity (we can compare the area to the left of a dashed curve to the area to the left of a solid curve of the same colour to assess this). In other words, combining sub-analyses allows us to probe better the model considered, and to assess more accurately to which parameter configuration the LHC is sensitive.
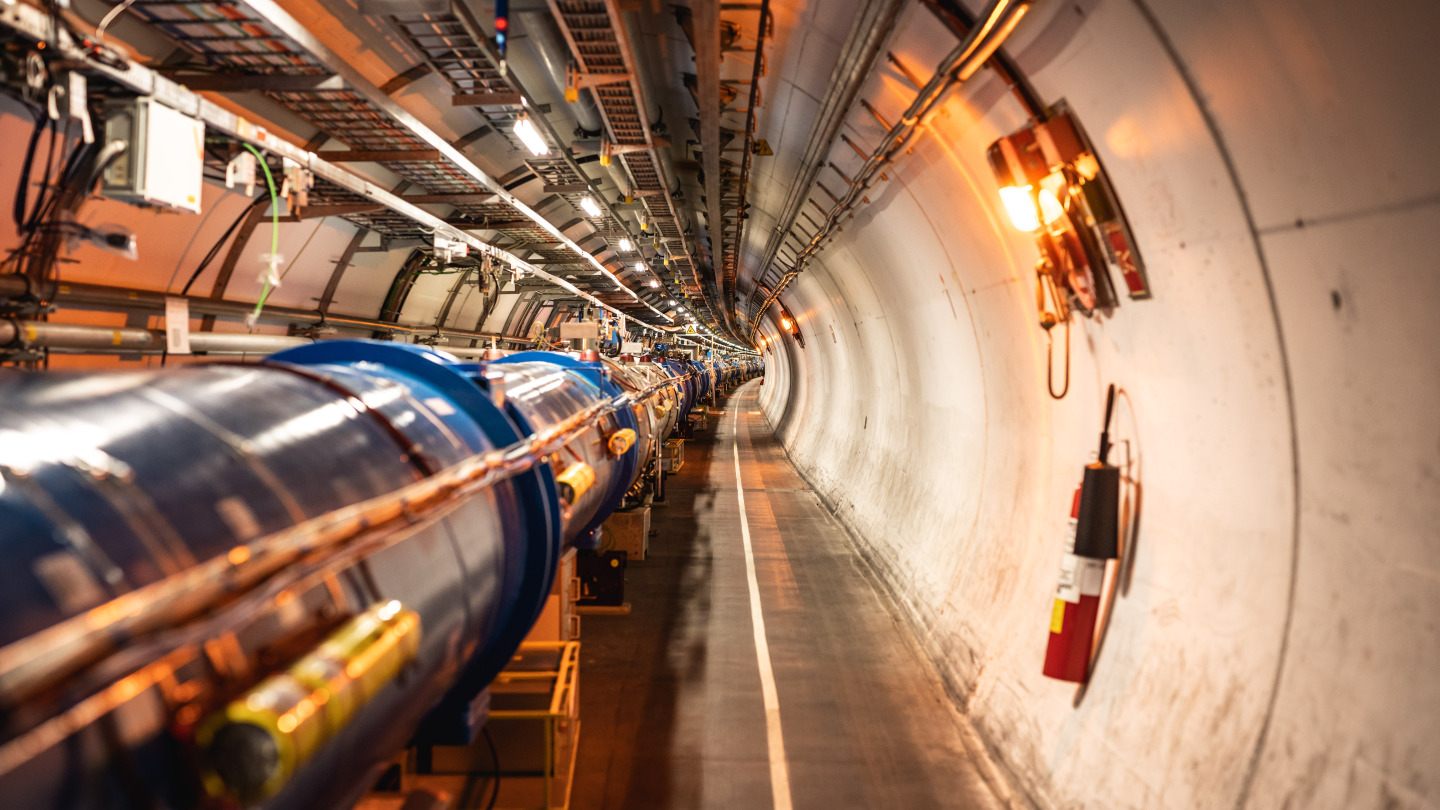
[Credits: Florian Hirzinger (CC BY-SA 3.0) ]
How to conquer a model better:
By combining, combining and combining!
By combining, combining and combining!
After some exciting days at HiveFest in Amsterdam during which I have met many people who I knew only as a nickname, and even more people who I had no clue about who they were before the party, it is time to resume my series of physics blogs. It is a new academic year after all.
Today, I decided to discuss how analyses at CERN’s Large Hadron Collider are conducted, and what are some of the problems that we face, as physicists, when we try to re-interpret the results of any given analysis in the context of another model of physics.
In general, every single analysis targeting new phenomena includes a lot of sub-analyses, so that any considered new phenomenon could be probed under all its possible facets. The most accurate conclusions are then obtained after a combination of all these sub-analyses. However, as external members of the LHC collaborations, we had until very recently no access to how to perform such a combination correctly.
The situation recently changed, and with my collaborators we updated a public software that I develop to allow anyone to perform this combination, and assess how well their favourite model is cornered by data. Our results are available from this publication, and I have tried to summarise the story in this blog. The TL; DR version is: it works and it is possible.
I hope you liked this blog. Before ending it, let me emphasise that anyone should feel free to abuse the comment section in case of questions, comments or remarks. Moreover, topic suggestions for my next blogs are always welcome.
https://twitter.com/BenjaminFuks/status/1572558318941667330
The rewards earned on this comment will go directly to the people( @lemouth ) sharing the post on Twitter as long as they are registered with @poshtoken. Sign up at https://hiveposh.com.
Congratulations @lemouth! You have completed the following achievement on the Hive blockchain and have been rewarded with new badge(s):
Your next payout target is 41000 HP.
The unit is Hive Power equivalent because post and comment rewards can be split into HP and HBD
You can view your badges on your board and compare yourself to others in the Ranking
If you no longer want to receive notifications, reply to this comment with the word
STOPTo support your work, I also upvoted your post!
Check out the last post from @hivebuzz:
Thanks for your contribution to the STEMsocial community. Feel free to join us on discord to get to know the rest of us!
Please consider delegating to the @stemsocial account (85% of the curation rewards are returned).
You may also include @stemsocial as a beneficiary of the rewards of this post to get a stronger support.
The subject of the post is a complicated one.Hard to understand for me.But what I understood is you are a physicists working with other devloping a project and to get accurate result you need to combine all the sub-analyses together. Doing so is not an easy task but the latest version of the software is good to use...
I really appreciate your work man.Good luck with your journey as physicists.🔥🔥
The fest in Amsterdam must be fascinating , I enjoyed watching the streaming.
Thanks for this comment on the blog. I have tried to make the text clear and simple. As your summary is pretty good, I must probably conclude to a partial success... Do you confirm that the blog is understandable, but tough to grasp in different places. In any case, sorry about this.
HiveFest was simply... amazing! I recommend attending the next edition, if possible.
Yeah It is cleared but the subject you discussed it tough for a normal guy..😂😂
I would love to join next fest if I can.
Thanks for the reply.
Feel free to join it. It is really cool, and I recommend it 100%. It is also nice to be able to associate faces with nicknames (or user identifiers).
Still lots of problems to solve! small steps but great conquers ;)

!1UP
Life would be so sad without any problem to solve... I am fortunate that physics still has a lot to be studied ;)
Cheers!
You have received a 1UP from @gwajnberg!
@stem-curator, @vyb-curator, @pob-curator, @neoxag-curator, @pal-curator
And they will bring !PIZZA 🍕.
Learn more about our delegation service to earn daily rewards. Join the Cartel on Discord.
😎😊🤙 Its all good! Everything looks so cool! Hope u find the needle in that stack! :P
I have good glasses ;)
😊😎🤙
Hi @lemouth, I'm glad you were able to enjoy the Hivefest must be an extraordinary experience as you very well expressed, worthily representing the entire STEMsocial community.
Really each of your articles shows an extraordinary scientific methodology, and we know that this requires a lot of dedication and dedication, generated by the passion that you have for physical science, which allows us to better understand each of the phenomena that develop in our environment, such as the one you detail in this article (new phenomena in particle colliders), both your knowledge and your passion, we certainly learn as much as we can.
Thank you for us with your excellent scientific content of very high quality, congratulations on the progress made to you and your team. Best regards.
Thanks a lot for your very positive comment and recognition of what I do here, on chain and also in real life. It is very appreciated and heart-warming!
Moreover, I also hope that I represented our community in the best and most fair way at HiveFest, and that the message I conveyed was appreciated by every member of our community. It was for me a first experience, and I discussed with many people who are interested in helping us to reach our goals and for the upcoming developments of the project.
Cheers!
You able to successfully done your job or dream insallah.We are always with you side and I will try to do something for our community. If you give me a chance. I love so much our community. It is not just your community it our community. I love @stemsocial
Mmmmh what a strange comment, quite off-topic related to this blog...
Why did you write that I considered that STEMsocial was my community? It has never been my community. It is the community of everybody, of all its members. Despite I co-founded it six years ago, this does not grant me any right to say that this community belongs to me. Moreover, I have never done that; please show me how and when I would have done it.
Well sure! Just tell us what you want to do. We have never restrained anyone to help.
Yes it is our community so we should work for this community bulidup. 😍😍
Sure, but this does not tell me what you want to do for it. What do you have in mind?
Congratulations @lemouth! You received a personal badge!
Thank you for your participation in the HiveFest⁷ Balls of Steel tournament.
We truly hope you enjoyed HiveFest⁷ and it's been our pleasure to welcome you in Amsterdam.
See you next year!
You can view your badges on your board and compare yourself to others in the Ranking
Hello @lemouth,
Welcome back. Sounds like Hivefest was fun. Every picture and report I read from participants in that event is positive. Everyone seems to have had a great experience.
Hope you are feeling well. It is relaxing, and taxing, to travel.
Now to your blog: I read it on my iPad before going to sleep last night. Much more relaxing than world news😇. The first thing I noted was the illustration of the trigger mechanism: it looks so unsophisticated. Reminds me of a circuit board in an electronics kit. And yet, so much of the data you analyze depends on the 'decisions' of that trigger.
This part caught my attention especially:
You publish your paper in an open access journal, and yet there is information that cannot be shared. Why? Because the results of these studies could conceivably be used in weapons development?
It's nice to have you back and opening my mind to an area of study that would otherwise be closed to me.
Take care, @lemouth
Thanks! Yes, HiveFest was really fun. I am now capable to associate a real face with many usernames. This is always something great when it can be done. That reminds me my early days on social media platforms (like mIRC in the 1990s or Parano in the 2000s).
This trip actually allowed me to change my mind quite significantly, which was overdue (a lot of demanding personal issues at the moment). I am now feeling much more relaxed, which is obviously a good thing.
This is however what most online triggers are: a piece of electronics deciding automatically what to do with what is seen in the detector.
it has nothing to do with weapons or those things. Remember it is fundamental science (so no immediate application).
The availability of experimental results for re-use is a hot topic for many years., and is actually very important. The main reason for not having everything public is a basic one.
First, anything that gets public takes time. Checks are required about the sanity of the information, its format, etc. It must get a collaboration stamp at the end, so that it is all good to become public (having information used in a computer code is different from having it ready to be shared with the world, and re-used).
What gets public is the analysis itself, its description, the results (the numbers extracted from data once the analysis is run) and the comparison with predictions for interpretations in some theoretical framework. All of this ends in an open-access scientific article. Raw data become public only a few years later. The experimental collaborations have the privilege to have priority on their data for what concerns their analysis.
In the meantime, we (theorists) started to work less than a decade ago on re-interpretation platforms allowing for an approximate re-interpretation of the experimental results (in any theory framework) on the basis of what was available from the experimental publications. It turned out that this was not easy because a lot of information was missing, or not properly documented. Reading a publication and producing a computer code mimicking it are two very different tasks... ;)
We therefore discussed a lot with the collaborations to solve this issue, and the material became better and better with time. It is still not easy today to add a new analysis to a re-interpretation framework (validation is often difficult), but things are much better than 10 years ago.
Now for what concerns the missing correlations to allow us to have better re-interpretations, we are asking for them for some time now, but they were not priority number one back in the days. Once again, the move to make them public is on-going, but it takes time. Baby step by baby step, somehow.
Having this becoming systematic is challenging in the sense that at the end, the last push needed to make all the work re-usable is poorly rewarded for a young experimenter, so that the interest stays mild. The added value on the CV is probably close to negligible, so that people prefer to move with a fresh and new analysis when one is finished (instead of taking the time to make it fully re-usable).
To make a long story short: things are moving in the right direction, but this takes time. I am hopeful for the future :)
PS: I am quite sure my answer will trigger other questions from you. Don't hesitate, this is fine ;)
Rest easy @lemouth,
No new questions :), but your answer is fascinating. For one thing, I'm still intrigued by the simplicity of the trigger device. In the hugely complex collider, there is a mechanism that I can basically understand 😄
I get it. And I understand why it is a challenge to publish raw data: everything in science has to be justified so that alone would take volumes of paperwork.
Thanks for the very interesting response. Always, I learn from you. It is much appreciated, and I'm glad that Hivefest was good for you (healthwise).
Do take care, @lemouth.
I will take care, especially as week-end time with the family is there. Enjoy your week-end too, and thanks again for your great question!
Hello dear friend @lemouth, the publication reflects the dedication you have with this research and the contribution you leave to the community, I had the opportunity to see your participation in hivefest by streaming and it was excellent.
May you continue to be there brother and that you manage to achieve your goals, see you later have an excellent week.
Thanks a lot for this nice message. I try to do my best here (as in real life ;) ).