Household Energy and COVID-19 ( An energy audit case study)

I. Introduction
An energy audit is a dynamic review of energy use of a building to find clues to optimize utilization. It involves several steps of inspection, data analysis, and evaluation, but these steps vary depending on the audit strategy. . [1], [3], [6]
A walk-through audit finds a deficiency in its equipment and structures through a visual inspection. It strategically finds heat flows to retrofit building spaces and equipment. This strategy echoes with an operation and maintenance plan in the building to mitigate energy loss. [1], [6]
Benchmark audit uses utility data to identify patterns that optimize costs and use. It analyzes changes in utility charges, peak demands, and weather effects. Typically, a benchmark audit goes hand in hand with the walk-through audit to get acquainted with the facility and its energy system [6]. Furthermore, the standard energy audit combines benchmarking and a baseline model to evaluate energy-saving measures. It utilizes the benchmark result to roll out a plan to save energy. A baseline model serves as the basis to assess the energy-saving measures. [1], [3], [6]
This paper does not follow the traditional route of benchmark audits to optimize energy cost and use in the target household. We establish a baseline model accounting for the actual loads in the target household. In this paper, the baseline model is a theoretical energy use model from the target household loads. We used the model to evaluate the existing energy-saving measures of the household owner. Also, the paper explores the utility bill of any charges or situations that may further push energy-saving measures.
II. Method
A. Target Household
The target household is a 2-story residential house in Mandaue City, Philippines. We survey the house to determine the frequently-used equipment. We listed the household load in Table I. The load on the list only considered the frequently or periodically used equipment. These do not include plug and-play pieces of equipment.
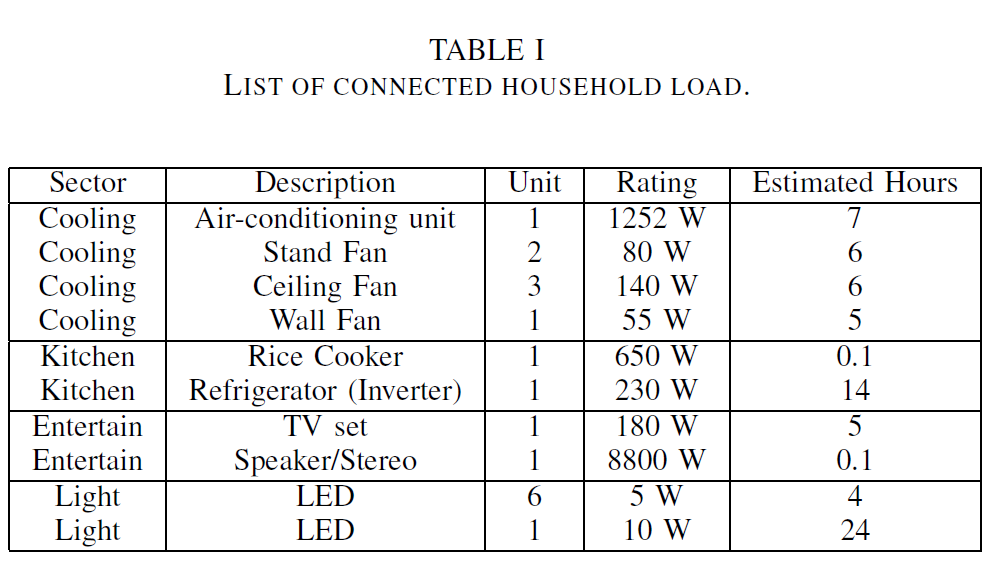
The running hours listed for the air conditioning unit and refrigerator considers that it on and off in an interval. The paper estimates the running hours as half of the actual. Most of the listed running hours consider the VECO average energy use per device [7].
B. Energy Model
We looked into the electric bill of the household to identify trends in its energy use and cost over the last thirteen-months. We found out that household consumption decreased in six months. The household owner revealed that they reduced the running hours of its air conditioning unit by half of the running time in December 2019 until the first quarter of 2020. In the following months, it is down to a quarter. The household owners strategically ran the air conditioning unit during the heat index is at a peak. Also, the owner purchased the fans to alleviate heat during the air conditioning unit is off.
We evaluates this strategy of reducing the use of air conditioning units to save up energy costs to the household. Since the household owner already implemented some measures to save up the energy cost, we assessed the result of reducing the running hours of the air conditioning unit by comparing a baseline model and the actual use. A baseline model is developed to compute the monthly energy used by the target household. The model is essential in evaluating the measures run by the household owner to reduce energy costs. We compare the actual and baseline use to validate if the owner reduced the energy cost of the household. Also, the paper explores the electric bill to
find out the factors that affect the reduced energy cost other than the owners’ measures.
The energy model is given as
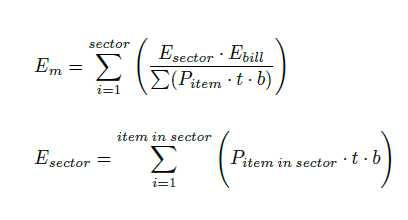
where Em, Esector, Ebill, Pitem, t and b are monthly energy use, energy use in a sector, energy use in the bill, power rating of an equipment, estimated running hours, and billing period, respectively. We compute the baseline energy use and compare it with the actual billing to evaluate the energy-saving measures. These values projected energy use without the energy-saving measures. Also, we looked into the energy distribution from each sector to identify shares in energy use. These values verified the owner’s intuition to cut the running hours of the air conditioning units. The actual energy used by each sector is
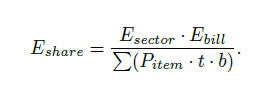
The energy consumption in each sector changes according to the intervention measures. Initially, we compute August to December 2020 allocation using the baseline model. For 2020, we used the baseline model with adjusted values in running hours of the air conditioning units. Furthermore, we inspect the billing charges for factors that may push the energy-saving measures further. We check for the correlation between the billing charges and the billed energy use and cost. We ran a linear regression to check if the billing charges with a correlation of not less than or equal to 0.80 affect the energy-saving measure.
II. Result and Discussion
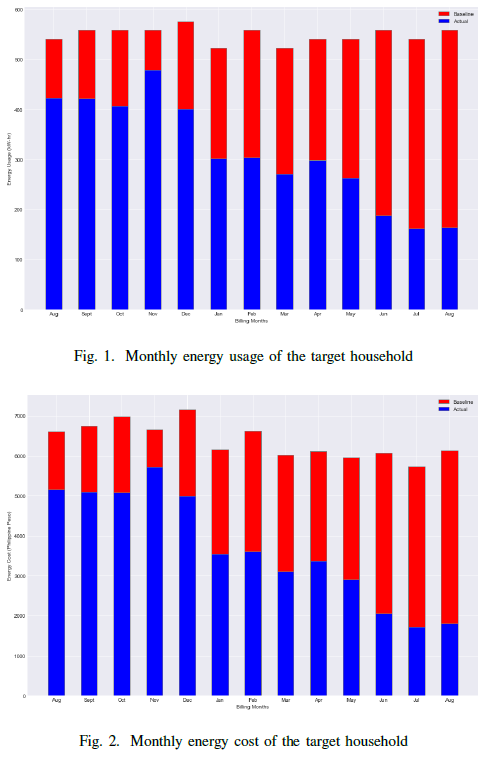
The baseline model projects energy use and cost if there is no intervention. The baseline model shows a mean energy use of 548.82 kilowatt-hours per month. The target household should spend an average of 6380.98 pesos per month of energy use. They reduced the running hours of its air-conditioning unit over the last six months. It resulted in the average energy use of 314 kilowatt-hours per month. The household saved at least 2678.16 pesos as compared to the baseline model. The household achieved the cost reduction by reducing the running hours by 1/2 and 1/4 in the succeeding eight-month period. Fig 1. and Fig 2. shows the changes in the energy use and cost in the last thirteen-months.
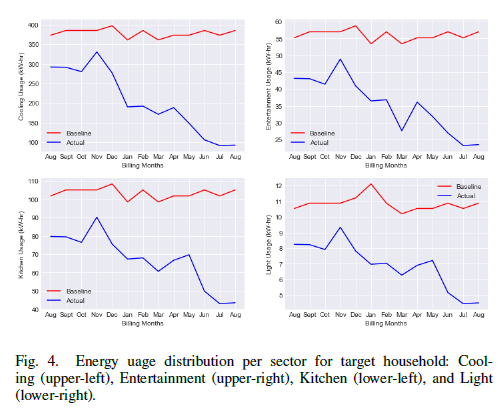
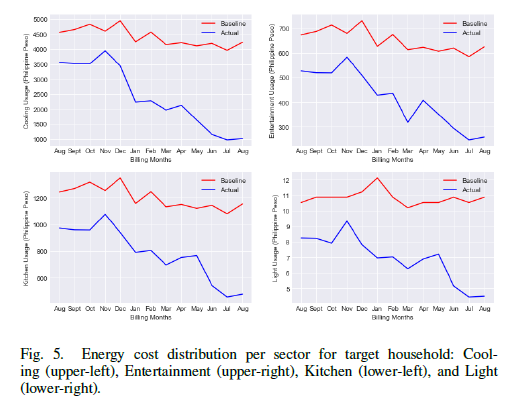
We divided the loads in the households as to for cooling, entertainment, kitchen, and light. Fig. 3 shows the percentage of energy use with each intervention measures. The baseline model follows the allocation in Fig. 3(a) in projecting the energy use of the target household. The household consumed at least 69.0% of energy for cooling. The heat index of 30-37 ◦C in the Philippines explains why the energy share for cooling is too high [2]. The energy-saving measures cuts at least 12.60% of energy for cooling. Fig. 4. and Fig. 5. plots the changes in each sector’s energy share.
The household plans to do a targeted operation for its cooling units paved the way to reduce consumption by 12.60% or at least 2000 pesos. The changes in the shares of entertainment, kitchen, and light are due to percent adjustment in the energy calculations. The up values in these sectors do not suggest higher use but just a computational adjustment.
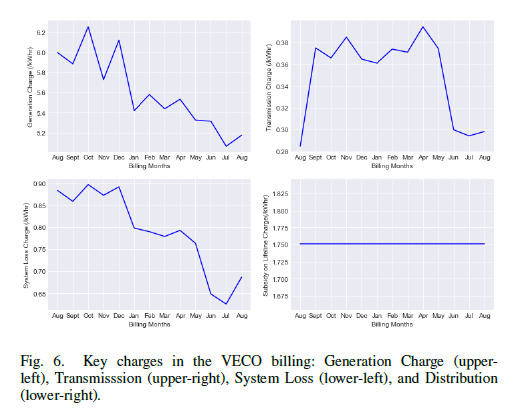
The COVID-19 pandemic pushed the cost to decrease further due to paused charges in the utility bill. Fig. 6. shows the kilowatt-hour charges in the billing. In the last six-month, there is a decrease in cost for generation, transmission, and system loss. These charges incurred at least 5.06, 0.28, and 0.68 per kilowatt-hour per month. These rates drops at least 16.67%, 22.22%, and 30.89% for generation, transmission, and system loss, respectively as compred to December 2019. The distribution charge stayed at 1.7506 per kilowatt-hours. Other billing charges like subsidies, tariffs, and taxes decreased.
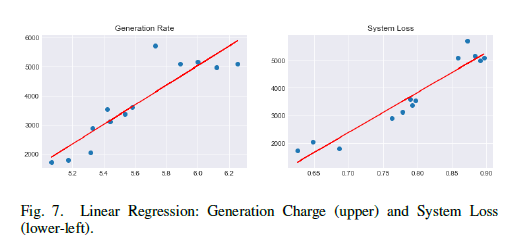
The study ran a linear regression to investigate correlations between the drop in charges and household energy use and cost. The billing rate with a correlation between 0.8 to 0.99 undergoes the regression test. The generation and system loss charges correlate to billing energy use and cost by 0.869508 and 0.949574, respectively. The generation and system loss yield a linear regression score of 0.9018 and 0.9197 for billing energy use and cost. Fig. 7. shows the fitted regression line against the subjected data points. This confidence threshold suggests that these billing charges have a significant effect on the overall energy cost and saving.
IV. Conclusion
We evaluates a target household energy-saving measures by using a baseline energy model that project energy use when there is no intervention. The household saves at most 2678.16 pesos of energy cost and cuts average energy use to 314 kilowatt-hours. The energy-saving plan lowers the cooling share up to 12.60% or at least 2000 pesos in energy cost. It was the right decision for the owner to reduce the running hours of the air conditioning units and replace it with fans. The result is not all due to the energy-saving measures in place. Linear regression score between billing charges (generation and system loss) and the energy use and cost result to 0.9018 and 0.9197. Furthermore, in the last six months, the billing charges substantially decrease and may attribute to the COVID-19 pandemic.
[7] “Compute Energy Consumption of your Appliances,” Visayan Electric Company.
(Note: All images and plots used in the text are originally crafted by the author except those with proper citations.)
Interest research and findings. I actually paid more for electricity consumption during the lockdown period and I can only imagine what the big picture would look like.
I am curious to know if you are the one that did this research and if no, do you have the permission of the researchers to share this here?
@gentleshaid, Yes, I am the one who did the research as one requirement for my graduate school class.
Good
Thanks for your contribution to the STEMsocial community. Feel free to join us on discord to get to know the rest of us!
Please consider supporting our funding proposal, approving our witness (@stem.witness) or delegating to the @stemsocial account (for some ROI).
Thanks for using the STEMsocial app, which gives you stronger support. Including @stemsocial as a beneficiary could yield even more support next time.
Your post has been voted as a part of Encouragement program. Keep up the good work!
Try https://ecency.com and Earn Points in every action (being online, posting, commenting, reblog, vote and more).
Boost your earnings, double reward, double fun! 😉
Support Ecency, in our mission:
Ecency: https://ecency.com/proposals/141
Hivesigner: Vote for Proposal
Good game
Great work. I find myself in a position to reduce energy consumption in my household too. Your work lends credence to my personal project
Good to hear that. Wish your personal projects a success.
Very interesting post and finding with extensive research on the topic. Even it is a long writing post but it is easy and enjoy reading through the end. Thanks for sharing.
!tan - Please tip @juecoree
Congratulations, @andyjim You Successfully Trended The Post Shared By @juecoree.
You Utilized 3/3 Daily Summon Bot Calls.
TAN Current Market Price : 2.998 HIVE
Thank you for appreciating the post. I hope to post more informational content here on Hive.
Congratulations @juecoree, You Earned 1.269 TAN & Curators Made 0.888 TAN.
Join CORE / VAULT Token Discord Channel or Trade TANGENT Token
TAN Current Market Price : 1.940 HIVE