ORDINARY MATTER #5
Hello, everyone. This is a continuation from where I stopped in my last post on THE PHYSICS OF ORDINARY MATTER #4 and it will also be the last post on the series as well. In this post, I will be demonstrating the gas laws using diagrams and as well discuss the kinetic theory of gases.
Demonstrating the gas laws: BOYLE'S LAW
As shown in the diagram below, a small amount of air is trapped at the closed end of a glass tube by an oil column. The tube is calibrated for volume. The other end of the tube connects with a chamber containing air. The air pressure in the chamber, and hence the pressure applied to the oil column, can be varied using a foot-pump. Whenever an adjustment is made to the pressure, time must be allowed for the gas to achieve thermal equilibrium with its surroundings at constant room temperature. To show Boyle's law, it is necessary to plot p against 1/V, or pV against V.
NASA's Glenn Research Center, Public Domain
THE PRESSURE LAW
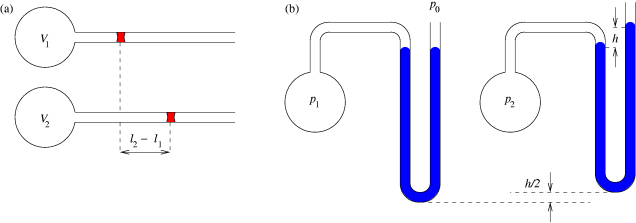
As shown in the figure below, a volume of gas is trapped in a flask that is connected to a pressure gauge. The flask is inserted in a water bath (or oil bath for higher temperatures) and the variation of pressure with temperature is measured.
CHARLES' LAW
A small amount of gas (air is suitable) is trapped in a calibrated capillary tube, usually by a bead of concentrated sulphuric acid to ensure that the gas remains dry. The capillary tube is inserted in a water bath. The length of the gas column (proportional to the volume of the gas) is measured as the temperature of the water bath is varied.
ldeal gas temperature scale - Kelvin temperature scale
We have seen that we can put p1V1/T1 = p2V2/T2, Where subscripts 1 and 2 refer to two sets of conditions for our ideal gas. Alternatively, pV is proportional to T. On a molecular scale temperature is a measure of the average kinetic energy of the molecules of a substance. The following explains how the accurate calibration of temperature can be made so that the temperature for a large system can be defined.
The pV is measured as T is varied (using a thermometer) over a range in which the gas behaves ideally. We get a straight line, showing this proportionality, as in the figure. The plot is that of a linear equation:
y = mx + c
where m is the gradient and c is a constant. To establish the calibration line we use straight proportionality to extend the line through to the origin pV = 0, T= 0. This sets c = 0 and defines one fixed point.
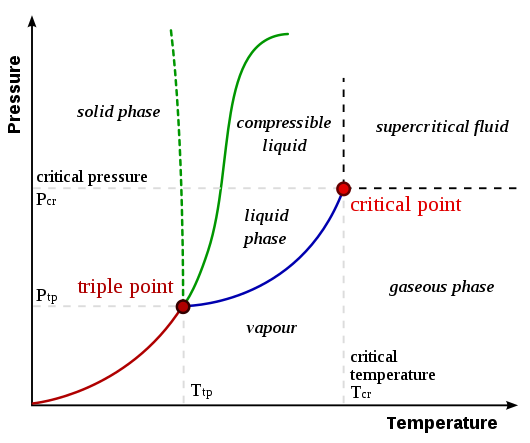
We now need only fix one other point to define the calibration line. This second fixed point must be reproducible by any scientist anywhere on Earth. The fixed point is chosen as the triple point of water, a unique temperature at which water vapour, liquid water and ice coexist in equilibrium. To obtain this point experimentally, a triple point cell is used. Air has been removed, leaving a pressure due to water vapour alone. This pressure is 0.61 kPa, which is, of course, very much lower than atmospheric pressure (101.4 kPa). For historical reasons related to earlier definitions of the Celsius and centigrade scales, this triple point is defined as 273.16 on the Kelvin scale, temperature unit kelvin (K). With the Celsius values of -273.16 °C for absolute 'zero' and 0°C for the triple point, this makes the interval between kelvins the same as between degrees Celsius.
Matthieumarechal, CC BY-SA 3.0
Note that the negative slope of the pressure-temperature boundary line between ice and water is very unusual; the typical curve for most other substances is shown. We now have, for a particular mass of ideal gas:
(pV) at unknown temperature / unknown temperature = (pV) at triple point temperature/273.16
If I call the unknown temperature T and rearrange the equation, then:
T = (pV)T/(pV)tr × 273.16K
where the subscript 'tr' refers to the triple point. This gives us a primary scale of temperature.
We could go on to show that this scale is identical to a thermodynamic scale defined by the use of a reversible heat engine. But, while the thermodynamic scale is a theoretical concept, here we have a practical method of measuring temperature. We use a gas thermometer containing a small mass of a gas and calibrate the product pV to obtain temperature. To simplify, we keep the gas volume constant and change only the pressure.
Once we have obtained our primary scale, we can cross-check it using other physical properties to measure temperature, such as the expansion of mercury with temperature, the variation of the resistance of a metal or the electromotive force (e.m.f.) set up between the junctions of two different metals at different temperatures (as in a thermocouple).
EXAMPLE
A constant-volume gas thermometer shows a difference in height in its mercury column of 8.00 cm at the triple point of water
(a)What difference in height does it read at
(i) the boiling point of water and
(ii) the melting point of lead (327 °C)?
b) With the density of mercury 1.35 × 10³ kg m-3, convert the readings to values of pressure in kPa.
ANSWER
a) We have:
p/T = ptr/Ttr
where p and T are the pressure and temperature read by the thermometer when in thermal contact with a substance, and ptr and Ttr are the pressure and temperature when it is in contact with water at its triple point of 273 K.
(Remember to convert temperatures to kelvin.) As the difference in height of the mercury column is proportional to pressure, we can obtain height differences for (i) and (ii) by direct proportionality:
(i) p (of boiling water) = 8.00 × 373/273 = 10.9 cm Hg.
(ii) p (of melting water) = 8.00 × 600/273 = 17.6 cm Hg.
(b) A 1 cm column of mercury creates a pressure given by:
mass of column per unit area × g = density × g × height
= (1.35 × 103) × 9.8 × (1 × 10-2) × 1 = 132 Pa
= 0.132 kPa
(The 10-2 above is a value which converts to cm.)
THE KINETIC THEORY OF GASES
The behaviour of gases is related to the microscopic movement of the atoms or molecules, and we use kinetic theory to give a model of this behaviour.
From the model it is possible to obtain an expression for the pressure of an ideal gas, and to go on to find out how the speeds of the gas molecules vary. We use the model of a large number of molecules moving around in a closed box, making many collisions with the walls. There are a number of underlying assumptions.
SIMPLIFYING ASSUMPTIONS USED
- The gas consists of a very large number N of molecules.
- The molecules are moving rapidly and randomly.
- The motion of the molecules can be described by Newtonian mechanics.
- Collisions between the molecules themselves and between the molecules and the walls are perfectly elastic.
- There are no attractive intermolecular forces.
- The only intermolecular forces that act are those during collisions and these are effectively instantaneous (that is, of small duration compared with the time interval between collisions).
- Molecules have negligible volume compared with the volume of the container (the molecules are, in effect, points in space).
If the collisions were not elastic, the kinetic energy of the molecules would be converted to other forms of energy and the gas pressure would decrease with time. Attractive intermolecular forces would, in particular, affect collisions at the walls by pulling molecules away from the walls. To assume no attractive intermolecular forces, we must have a gas at a low density.
MAIN RESULTS OF THE KINETIC THEORY
The main results of the kinetic theory are shown below:
Pressure
The pressure p exerted by the gas is given by p = 1/3 mNc2/V = 1/3pc2 where the gas of density p occupying a volume V has N molecules each of mass m and with mean square velocity c2.
Internal energy
The internal energy U of the gas arising from the kinetic energy of all the molecules is :U= 3/2nRT where the gas consists of n moles and R is the molar gas constant. The average kinetic energy per molecule is given by: Uone molecule = 3/2 RT/NA = 3/2kT where N is the Avogadro constant, k = R/NA is the Boltzmann constant and kT can be associated with each degree of freedom.
The derivation assumes ideal gases with negligible forces between molecules that have negligible size. In real gases, the molecules have a finite size and small forces act between them. But, under suitable conditions, gases do match the behaviour of ideal gases very closely.
I have emphasised that the gas laws apply best at low pressures. It is important that our real gas is not close to the conditions for liquefaction. So its temperature should be well above the critical temperature and its pressure well below the critical pressure at which liquefaction takes place. The real test of kinetic theory is that it gives satisfactory results for gases in most practical circumstances.
DISTRIBUTION OF MOLECULAR SPEED IN AN IDEAL GAS
In the calculation of the pressure of an ideal gas I used c2, the mean of the squared velocities. However, there will be wide variation in speed among the molecules. The situation is analogous to cars travelling along a motorway. A few will be travelling slowly. There will be many travelling close to the speed limit, others faster and some at an excessive speed. In a gas, too, there will be fast and slow molecules with a large proportion moving somewhere near the mean speed. This speed is determined by the temperature of the gas. Change the speed limit on a motorway and the distribution of the speed of the traffic changes. Alter the temperature of the gas and the speed (velocity) distribution alters.
The diagram above shows a typical speed distribution for the molecules of a gas. The first figure shows the distribution as a histogram and the second figure shows it as a continuous plot. In both figures, the x axis shows the spread of speeds of the molecules. But what is plotted on the y axis needs more explanation.
The histogram shows the number of molecules moving within specific ranges of speed. Histogram intervals are set at 100 m/s so that the histogram represents the number of molecules with speeds 0 to 99 m/s, 100 to 199 m/s and so on. We can draw a curve to represent the outline of the histogram but it will not be very accurate.
If we take much smaller intervals we obtain more columns to the histogram and can draw a more precise curve. If we make the intervals of width 1 m/s, we obtain a distribution where the y-axis is the number of molecules per unit interval of speed (that is, per m/s) and we obtain the continuous curve of the second figure above. The calibration of the y-axis depends on the quantity of gas involved. This quantity is arbitrary, but a million molecules is assumed, so that the area under the graph is one million.
The graph shows the distribution of speed. However, in calculating pressure, it is speed squared that is important and this means that the molecules at the upper end (right-hand side) of the distribution have the largest influence. Similarly, on a motorway, the seriousness of an accident usually depends on the kinetic energy of the vehicles as well as their mass. Kinetic energy is proportional to speed squared and accidents become proportionately more serious as speed rises. This is an important reason why speed restrictions are imposed.
If the gas is heated, the curve showing the distribution of speeds spreads out horizontally, but the area under each curve remains constant. The total area under the curve has to remain the same as the area represents the total number of molecules. Because the curve spreads out horizontally, it is clear that the number of molecules at the peak speed must decrease with increase in temperature.
SUMMARY
After reading my series of posts on the physics of ordinary matter starting with 1, 2, 3, 4 and this final episode, you should have been able to:
- Describe qualitatively the differences between states of matter.
- Describe different types of bonding between atoms.
- Explain the term latent heat and use values of specific latent heat in calculations.
- Draw and interpret force against separation and potential energy against separation curves for adjacent atoms in a solid or liquid.
- Describe simple cubic crystal structures in terms of packing of spherical atoms and carry out simple calculations of atomic spacing.
- Describe Brownian motion.
- State the gas laws: pV = constant, p/T = constant, V/T = constant, and outline how they are proved experimentally.
- Be aware of the relation between the Kelvin temperature scale and the ideal gas equation and describe the use of the constant-volume gas thermometer to measure Kelvin temperature.
- Use the ideal gas equation: pV/T = constant to make simple calculations of pressure, volume and temperature of a gas.
- Understand that in an ideal gas the equation of state is given by pV= nRT, where R is the molar gas constant and n is the number of moles of gas.
- State the main assumptions used in the kinetic theory of an ideal gas and carry out simple calculations using the theory.
- Understand the relation between the Avogadro constant NA and the mole.
- Know that the average kinetic energy per molecule is 3kT/2, where k is the Boltzmann constant, R/NA
Thanks for reading
REFERENCES
https://en.wikipedia.org/wiki/Gas_laws
https://www.toppr.com/guides/chemistry/states-of-matter/gas-laws/
https://www.britannica.com/science/gas-laws
https://en.wikipedia.org/wiki/Phase_diagram
https://www.britannica.com/science/Kelvin-temperature-scale
https://courses.lumenlearning.com/boundless-physics/chapter/temperature-and-temperature-scales/
https://courses.lumenlearning.com/boundless-physics/chapter/kinetic-theory/
https://www.britannica.com/science/kinetic-theory-of-gases
https://www.sciencedirect.com/topics/earth-and-planetary-sciences/kinetic-theory
https://en.wikipedia.org/wiki/Kinetic_theory_of_gases
https://en.wikipedia.org/wiki/Internal_energy
https://chemed.chem.purdue.edu/genchem/topicreview/bp/ch21/chemical.php
https://en.wikipedia.org/wiki/Maxwell%E2%80%93Boltzmann_distribution
https://courses.lumenlearning.com/boundless-chemistry/chapter/kinetic-molecular-theory/
https://opentextbc.ca/universityphysicsv2openstax/chapter/distribution-of-molecular-speeds/
https://chem.libretexts.org/Bookshelves/Physical_and_Theoretical_Chemistry_Textbook_Maps/Map%3A_Physical_Chemistry_(McQuarrie_and_Simon)/27%3A_The_Kinetic_Theory_of_Gases/27.03%3A_The_Distribution_of_Molecular_Speeds_is_Given_by_the_Maxwell-Boltzmann_Distribution
Thanks for your contribution to the STEMsocial community. Feel free to join us on discord to get to know the rest of us!
Please consider supporting our funding proposal, approving our witness (@stem.witness) or delegating to the @stemsocial account (for some ROI).
Thanks for using the STEMsocial app and including @stemsocial as a beneficiary, which give you stronger support.
Congratulations @emperorhassy! You have completed the following achievement on the Hive blockchain and have been rewarded with new badge(s) :
You can view your badges on your board And compare to others on the Ranking
If you no longer want to receive notifications, reply to this comment with the word
STOPDo not miss the last post from @hivebuzz: