OLED: PWM MONITOR ✳❇SPECIAL EDITION❇✳ EN/ES
Writing an article for Hive usually takes me between 3 and 4 hours, I don't know if that's a lot or a little for some but considering my available time that's quite a lot of time, however there are two main reasons why I want to put so much effort in the work I do for you, the first one is that I love the topics I write about and it's easy to forget about time when I focus on it, the second one is that you deserve quality content so I try to do my best keeping a balance between quality and simplicity.
There are cases where creativity takes free rein and I decide to do something that I have never seen before anywhere else, but not something simple, they are cases where an article can take me a day or more because I have to do the work, the calculations and then the debugging, those are the cases that I call special edition because they look so good to me that even I myself feel admiration for the result 😁.
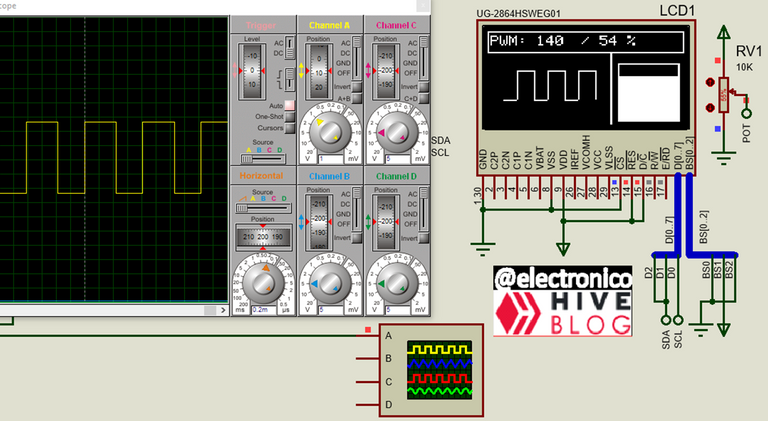
For today's article we are going to close the topic of OLED displays in style, for that we are going to create a very important real application by which we can use the OLED panel to monitor a PWM signal in 4 different ways, yes.... 4.
We are going to use an ADC to modify the PWM value and we will see it on the OLED panel as bit value (0 to 255), duty cycle percentage (0 to 100%), indicator bars (battery indicator style of old phones) and PWM signal waveform, yes, our OLED panel will act as an oscilloscope for this signal 😎.
As a bonus we will also learn how to design the HIVE logo, this article is intermediate level but it will be explained with many illustrative images trying to make it very easy to understand, still it is not too much to review previously seen knowledge like:
- Using ADC in PIC16F877a EN/ES
- PWM in PIC16F877A EN/ES
- The I2C protocol EN/ES
- Printing text on OLED screen using the PIC18F4550 EN/ES
- OLED screen: Drawing figures using PIC18F4550 EN/ES
Escribir un artículo para Hive generalmente me toma entre 3 y 4 horas, no se si eso sea mucho o poco para algunos pero considerando mi tiempo disponible eso es bastante tiempo, sin embargo existen dos razones fundamentales para que quiera esforzarme tanto en el trabajo que hago para ustedes, la primera es que amo los temas sobre los que escribo y es fácil olvidarme del tiempo cuando me concentro en ello, la segunda es que ustedes merecen contenido de calidad así que intento dar lo mejor manteniendo un equilibrio entre calidad y sencillez.
Existen casos en los que la creatividad toma rienda sueltas y decido hacer algo que no haya visto nunca antes en ningún otro lugar, pero no algo simple, son casos en los que un artículo puede tomarme un día o más porque debo realizar el trabajo, los cálculos y luego las depuraciones, esos son los casos que yo llamo edición especial porque me quedan tan bien que hasta yo mismo siento admiración por el resultado 😁.
Para el artículo de hoy vamos a cerrar el tema de las pantallas OLED por todo lo alto, para ello vamos a crear una aplicación real de mucha importancia mediante la cual podremos usar el panel OLED para monitorear una señal PWM en 4 formas distintas, sí... 4.
Vamos a usar un ADC para modificar el valor del PWM y lo veremos en el panel OLED como valor en bits (0 a 255), porcentaje del duty cycle (0 al 100%), barras indicadoras (estilo indicador de batería de los teléfonos antiguos) y forma de onda de la señal PWM, sí, nuestro panel OLED actuará como un osciloscopio para esta señal 😎.
Como bonus también aprenderemos a diseñar el logo de HIVE, este artículo es de nivel intermedio pero se explicará con muchas imágenes ilustrativas intentando que se pueda comprender con mucha facilidad, aún así no está demás repasar conocimientos vistos anteriormente como:
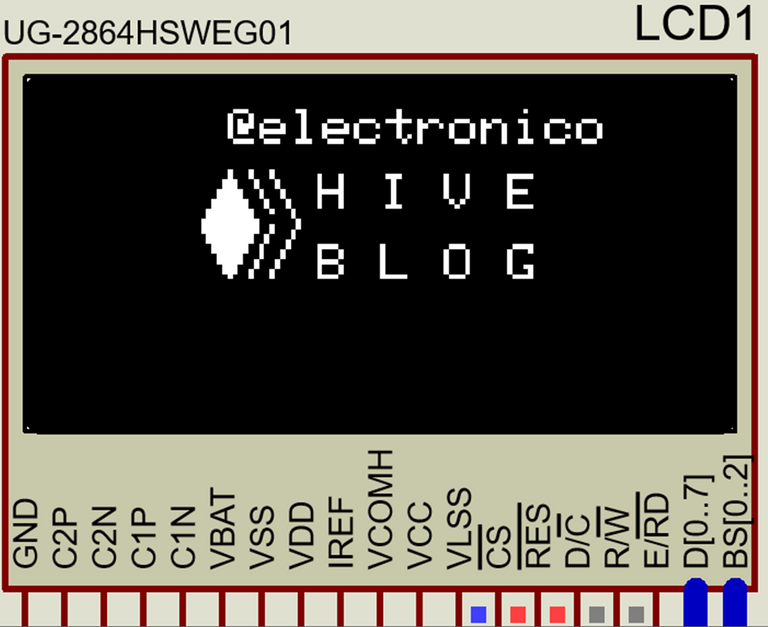
We want to build an application for a real device, in these cases it is advisable to take advantage of the welcome screen to advertise the company, in our case the company is HIVE and the developer is @electronico, then we will first have to design the first screen and in it we will include the logo of HIVE.
The HIVE logo is very simple to make, if you look closely it is nothing more than a rhombus with a few lines next to it, it is true that in the functions of figures that we saw previously none allowed us to draw a rhombus, but this is nothing more than two vertical triangles of the same dimensions placed in counterpart one on top of the other.
So we draw our two triangles trying to place the figure and the content in the center of the panel for a more aesthetic finish. We also draw 4 lines to form the two figures on the side that together with the rhombus give shape to the HIVE logo and to this logo we add the corresponding texts.
Queremos construir una aplicación para un dispositivo real, en estos casos es recomendable aprovechar la pantalla de bienvenida para hacerle publicidad a la empresa, en nuestro caso la empresa es HIVE y el desarrollador es @electronico, entonces tendremos primeramente que diseñar la primera pantalla y en ella vamos a incluir el logo de HIVE.
El logo de HIVE es muy sencillo de hacer, si lo miras de cerca no es más que un rombo con algunas con unas pocas líneas al lado, es cierto que en las funciones de figuras que vimos anteriormente ninguna nos permitía dibujar un rombo, pero este no es más que dos triángulos verticales de las mismas dimensiones colocados en contraparte uno sobre el otro.
Así que trazamos nuestros dos triángulos intentando ubicar la figura y el contenido en el centro del panel para un acabado más estético. Trazamos tambíen 4 líneas para formar las dos figuras de al lado que junto al rombo dan forma al logo de HIVE y a este logo añadimos los textos correspondientes.
   SSD1306_DrawText(35, 3, "@electronico", 1);

   SSD1306_Display();

   SSD1306_FillTriangle(30, 25, 35, 15, 40, 25);

   SSD1306_Display();

   SSD1306_FillTriangle(30, 26, 35, 36, 40, 26);

   SSD1306_Display();

   SSD1306_DrawLine(39, 15, 43, 23);

   SSD1306_Display();

   SSD1306_DrawLine(43, 15, 48, 25);

   SSD1306_Display();

   SSD1306_DrawLine(39, 36, 43, 26);

   SSD1306_Display();

   SSD1306_DrawLine(43, 36, 48, 25);

   SSD1306_Display();

   SSD1306_DrawText(52, 16, "H I V E", 1);

   SSD1306_Display();

   SSD1306_DrawText(52, 30, "B L O G ", 1);

   SSD1306_Display();

   Delay_ms(1000);

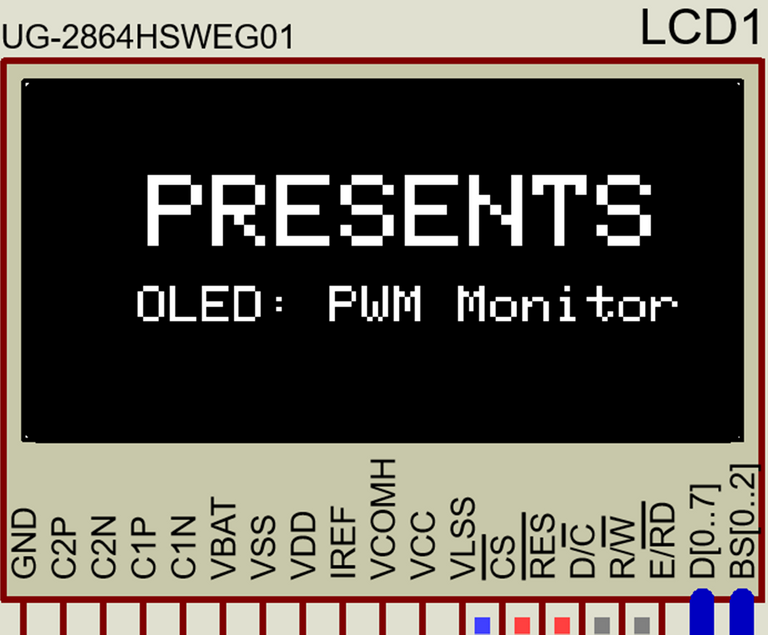
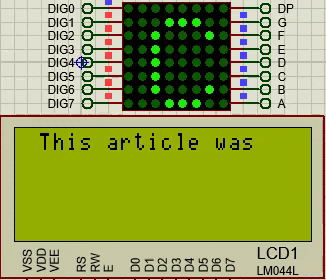
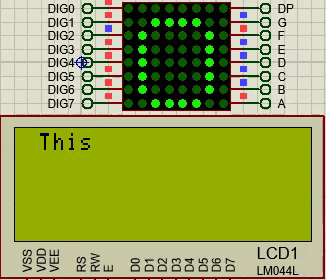
Now we will use a second screen to show the use that our application has, this one will be simpler because it only contains texts, although we will use them in different sizes and in a centered position to maintain the good aesthetics.
Ahora usaremos una segunda pantalla para mostrar el uso que tiene nuestra aplicación, esta será más sencilla porque solo contiene textos, aunque los usaremos de distintos tamaños y en una posición centrada para que se siga manteniendo la buena estética.
   SSD1306_ClearDisplay();

   SSD1306_Display();

   SSD1306_DrawText(20, 15, "PRESENTS", 2);

   SSD1306_Display();

   SSD1306_DrawText(18, 37, "OLED: PWM Monitor", 1);

   SSD1306_Display();

   Delay_ms(1000);

   SSD1306_ClearDisplay();

   SSD1306_Display();
The two previous screens will only be visible once when the device is turned on, after that we will have an interactive screen that will be constantly modified according to the PWM signal variations.
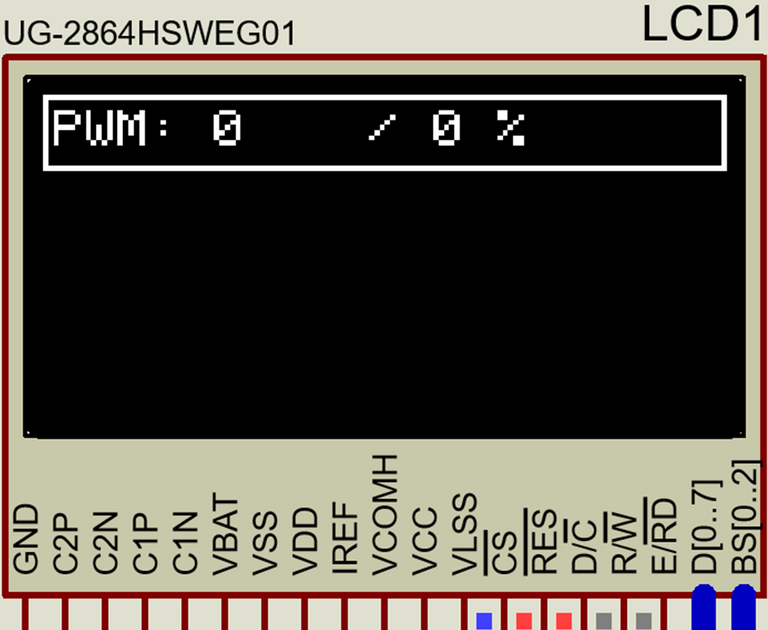
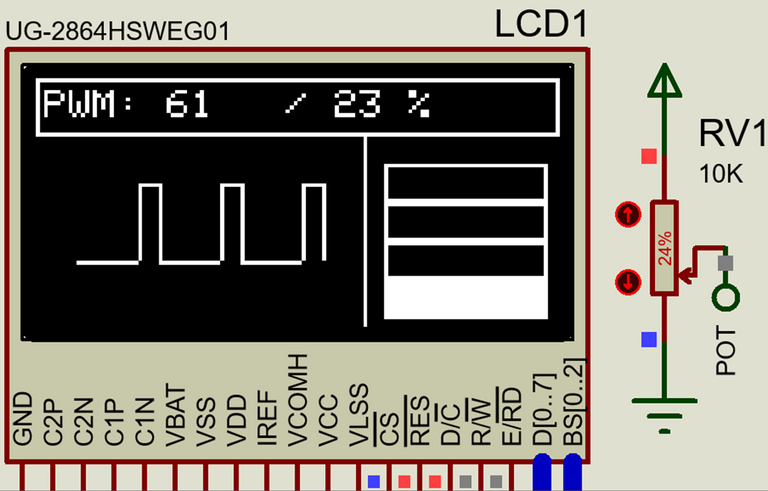
To vary the PWM signal we will use an 8bit ADC, this implies that we will not have to make the equivalent of 1023 (when we use 10 bits) to 255 (because the CCP module is 8bits) and we can use the instruction read_adc() to match it with a variable pwm_value that will be loaded in the PWM value, in this way the ADC value in bits is the same for the PWM.
To know the value in bits of the PWM it will be enough to show on screen the value of pwm_value, to create an equivalent in terms of percentage we can use a variable which we will call duty and we adapt it with the map function. In this way we have the values in bits and in %, we can show them inside a rectangle to continue maintaining the aesthetics and it would look like this.
Las dos pantallas anteriores solo serán visibles una vez cuando se encienda el dispositivo, luego de eso tendremos en pantalla interactiva que se modificará constantemente según las variaciones de la señal PWM.
Para variar la señal PWM usaremos un ADC de 8bits, esto implica que no habrá que hacer la equivalente de 1023 (cuando usamos 10 bits) a 255 (porque el módulo CCP es de 8bits) y podremos usar la instrucción read_adc() para igualarla con una variable pwm_value que se cargará en el valor del PWM, de esta forma el valor del ADC en bits es el mismo para el PWM.
Para conocer el valor en bits del PWM solo bastará mostrar en pantalla el valor que tenga pwm_value, para crear un equivalente en términos de porcentaje podemos usar una variable la cual llamaremos duty y la adaptamos con la función map. De esta forma tenemos los valores en bits y en %, podemos mostrarlos dentro de un rectángulo para seguir manteniendo la estética y quedaría de la siguiente forma.
   while(true)

   {

      set_adc_channel(0);

      delay_us(2);

      int pwm_value = read_adc();

      set_pwm1_duty(pwm_value);

      SSD1306_Display();

      SSD1306_ClearDisplay();

      SSD1306_DrawRect(0, 0, 128, 15);

      SSD1306_Display();

      sprintf(buffer, "PWM: %u", pwm_value);

      SSD1306_DrawText(2, 3, buffer, 1);

      SSD1306_Display();

      duty = map(pwm_value, 0, 255, 0, 100);

      sprintf(Percent, " / %u %c", duty, sig);

      SSD1306_DrawText(55, 3, percent, 1);

      SSD1306_Display();
In this way we will already be able to visualize two indicators in the upper part of the screen, one in bits and the other in percentage, the next two indicators will be graphical and we will have to divide the remaining available part in two parts, for this we will create a vertical line of separation.
As we will use bars and waveform we will give more space to the waveform, we will take 48 pixels wide x 49 pixels long to design an indicator by bars and the rest for an indicator by waveform.
De esta forma ya podremos visualizar dos indicadores en la parte superior de la pantalla, uno en bits y otro en porcentaje, los siguientes dos indicadores serán gráficos y tendremos que dividir la parte restante disponible en dos partes, para ello vamos a crear una línea vertical de separación.
Como usaremos barras y forma de onda le daremos más espacio a la forma de onda, tomaremos 48 pixeles de ancho x 49 de largo para diseñar un indicador por barras y el resto para un indicador por forma de onda.
      SSD1306_DrawFastVLine(80, 15, 49);

       SSD1306_Display();
In the right part we are going to place 4 bars, we will help ourselves with the function to draw rectangles and we will place 4 stacked rectangles that will be the ones that indicate in a visual way the state of the PWM.
We will make them 40 pixels wide by 10 pixels high, that way all of them can occupy the assigned space and there will be enough to maintain a margin between the squares and the edges.
En la parte derecha vamos a colocar 4 barras, nos ayudaremos con la función para dibujar rectángulos y colocaremos 4 rectángulos apilados que serán los que indiquen de forma visual el estado del PWM.
Los haremos de 40 píxeles de ancho por 10 de alto, de esa forma todos podrán ocupar el espacio asignado y sobrará para mantener un margen entre los cuadrados y los bordes.
      SSD1306_Display();

      SSD1306_DrawRect(85, 52, 40, 10);

      SSD1306_Display();

      SSD1306_DrawRect(85, 42, 40, 10);

      SSD1306_Display();

      SSD1306_DrawRect(85, 32, 40, 10);

      SSD1306_DrawRect(85, 22, 40, 10);

      SSD1306_Display();
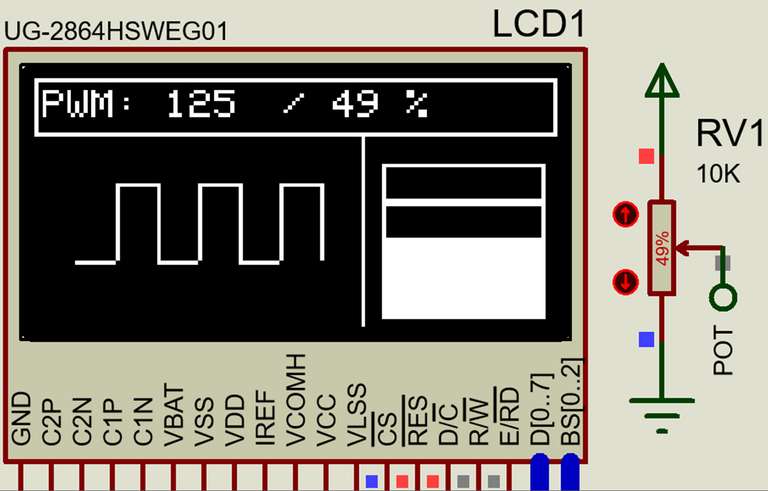
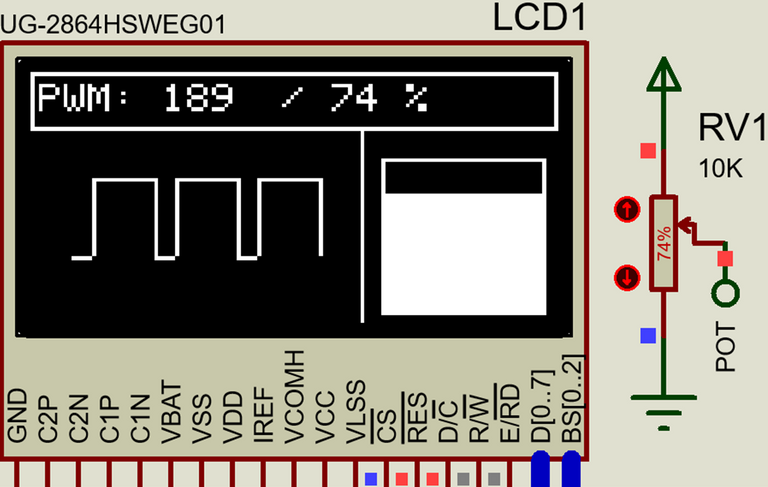
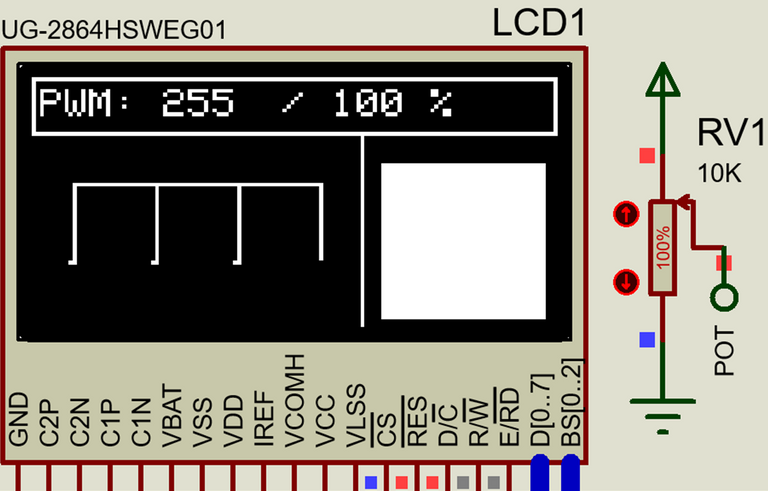
For our bars to be able to indicate them we must replace them with filled rectangles for each PWM value, in this case the first one will be filled when the value is greater than 0%, the second one when it is greater than 25%, the third one when it is greater than 50% and the upper one when the value is greater than 75%.
It is important to note that the bars are not precision indicators and have a maximum tolerance of 24%, for example if only the lower bar is filled we know that the value is less than 26% and greater than 1% but we cannot say in what intermediate values it is without looking at the indicators at the top.
Para que nuestras barras puedan indicar las debemos reemplazar por rectángulos llenos para cada valor del PWM, en este caso la primera se llenará cuando el valor sea mayor a 0%, la segunda cuando sea mayor al 25%, le tercera cuando sea mayor al 50% y la superior cuando el valor sea mayor al 75%
Es importante notar que las barras no son indicadores de precisión y tienen una tolerancia máxima del 24%, por ejemplo si solo está llena la barra inferior sabemos que el valor es menor a 26% y mayor que 1% pero no podremos decir en qué valores intermedios se encuentra sin mirar los indicadores de la parte superior.
      if(duty > 0)

        {

        SSD1306_FillRect(85, 52, 40, 10);

        SSD1306_Display();

        }

      if(duty > 25)

        {

        SSD1306_FillRect(85, 42, 40, 10);

        SSD1306_Display();

        }

      if(duty > 50)

        {

        SSD1306_FillRect(85, 32, 40, 10);

        SSD1306_Display();

        }

      if(duty > 75)

        {

        SSD1306_FillRect(85, 22, 40, 10);

        SSD1306_Display();

        }
Now comes the most difficult part, to use our OLED panel as an oscilloscope we need to draw lines that interact with the value of the variable to take the correct shape for each variation.
To do this we will take advantage of the fact that a PWM signal always maintains the same period and that its variation is only horizontal, we will simulate 3 periods of the signal for which we will draw 3 vertical lines that will be fixed and will serve as a reference point, this is possible because the period does not vary in PWM.
We will draw a length between each period of 20 pixels, so a period with a 100% cycle will have an upper line of 20 pixels and if it has 0% its lower line will be 20 pixels. We will go into details shortly but for now we will plot the 3 fixed verticals.
Ahora viene la parte más difícil, para usar nuestro panel OLED como un osciloscopio necesitamos trazar líneas que interactúen con el valor de la variable para tomar la forma correcta para cada variación.
Para ello aprovecharemos que una señal PWM siempre mantiene el mismo periodo y que su variación es únicamente horizontal, simularemos 3 periodos de la señal para los cuales trazaremos 3 líneas verticales que serán fijas y servirán como punto de referencia, esto es posible porque el período no varía en PWM.
Vamos a trazar una longitud entre cada periodo de 20 pixeles, así un periodo con un ciclo del 100% tendrá una línea superior de 20 pixeles y si tiene 0% su línea inferior será de 20 pixeles. En breve entraremos en detalles pero por ahora vamos a trazar las 3 verticales fijas.
      SSD1306_DrawFastVLine(30, 27, 20);

      SSD1306_Display();

      SSD1306_DrawFastVLine(50, 27, 20);

      SSD1306_Display();

      SSD1306_DrawFastVLine(70, 27, 20);

      SSD1306_Display();
To represent a cycle we need to draw three additional lines for each fixed vertical, an upper horizontal for the high level, a lower horizontal for the low level and a moving vertical that determines the width of the pulse.
As there are 3 cycles we are going to use the variables x1, x2 and x3 to determine points from where the lines are drawn, these points will depend on the values of the PWM in order to provide a real representation.
We will have to adapt each point of departure and point of arrival of the lines to an equivalent of PWM by means of the map function, we must take into account that each period begins and ends in a pixel coordinate different from the others, that is why the x variables play a fundamental role in the representation and the plotting.
The adaptations and plotting are done as follows:
Para representar un ciclo necesitamos trazar tres líneas adicionales por cada vertical fija, una horizontal superior para el nivel alto, una horizontal inferior para el nivel bajo y una vertical móvil que determina el ancho del pulso.
Como son 3 ciclos vamos a usar las variables x1, x2 y x3 para determinar puntos desde donde se trazan las líneas, estos puntos deprenderán de los valores que tenga el PWM para de esa forma poder brindar una representación real.
Tendremos que adaptar cada punto de partida y punto de llegada de las líneas a un equivalente de PWM mediante la función map, debemos tomar en cuenta que cada periodo inicia y termina en una coordenada de pixel diferente a los demás, por eso las variables x juegan un papel fundamental en la representación y el trazado.
Las adaptaciones y trazados se hacen de la siguiente forma:
      x1 = map(duty, 100, 0, 10, 30);

      SSD1306_DrawFastVLine(x1, 27, 20);

      SSD1306_Display();

      SSD1306_DrawFastHLine(x1, 27, 30-x1);

      SSD1306_Display();

      SSD1306_DrawFastHLine(10, 47, x1-10);

      SSD1306_Display();

      x2 = map(duty, 100, 0, 30, 50);

      SSD1306_DrawFastVLine(x2, 27, 20);

      SSD1306_Display();

      SSD1306_DrawFastHLine(x2, 27, 50-x2);

      SSD1306_Display();

      SSD1306_DrawFastHLine(30, 47, x2-30);

      SSD1306_Display();

      x3 = map(duty, 100, 0, 50, 70);

      SSD1306_DrawFastVLine(x3, 27, 20);

      SSD1306_Display();

      SSD1306_DrawFastHLine(x3, 27, 70-x3);

      SSD1306_Display();

      SSD1306_DrawFastHLine(50, 47, x3-50);

      SSD1306_Display();
If you need the complete code I leave it below:
Si necesitas el código completo te lo dejo a continuación:
#include <18f4550.h>

#device ADC = 8

#device PASS_STRINGS = IN_RAM

#fuses HS,NOWDT,NOPROTECT,NOLVP,PUT,CPUDIV1,NODEBUG,VREGEN,NOPBADEN

#use delay(clock=20M)

#use I2C(MASTER, SDA=PIN_B0, SCL=PIN_B1, FAST=400000, STREAM=SSD1306_STREAM)


#define SSD1306_I2C_ADDRESS 0x7A

#include <SSD1306_OLED.c

#include <map_function.c

char buffer[10];

char percent[10];

char sig='%';

int duty;

int x1;

int x2;

int x3;

void main()

{

   setup_timer_2(t2_div_by_16, 255, 1);

   setup_ccp1(ccp_pwm);

   setup_adc_ports(AN0);

   setup_adc(adc_clock_internal);

   set_pwm1_duty(0);

   SSD1306_Begin(SSD1306_SWITCHCAPVCC,

   SSD1306_I2C_ADDRESS);

   SSD1306_ClearDisplay();

   SSD1306_Display();

   SSD1306_DrawText(35, 3, "@electronico", 1);

   SSD1306_Display();

   SSD1306_FillTriangle(30, 25, 35, 15, 40, 25);

   SSD1306_Display();

   SSD1306_FillTriangle(30, 26, 35, 36, 40, 26);

   SSD1306_Display();

   SSD1306_DrawLine(39, 15, 43, 23);

   SSD1306_Display();

   SSD1306_DrawLine(43, 15, 48, 25);

   SSD1306_Display();

   SSD1306_DrawLine(39, 36, 43, 26);

   SSD1306_Display();

   SSD1306_DrawLine(43, 36, 48, 25);

   SSD1306_Display();

   SSD1306_DrawText(52, 16, "H I V E", 1);

   SSD1306_Display();

   SSD1306_DrawText(52, 30, "B L O G ", 1);

   SSD1306_Display();

   Delay_ms(1000);

   SSD1306_ClearDisplay();

   SSD1306_Display();

   SSD1306_DrawText(20, 15, "PRESENTS", 2);

   SSD1306_Display();

   SSD1306_DrawText(18, 37, "OLED: PWM Monitor", 1);

   SSD1306_Display();

   Delay_ms(1000);

   SSD1306_ClearDisplay();

   SSD1306_Display();

   while(true)

   {

      set_adc_channel(0);

      delay_us(2);

      int pwm_value = read_adc();

      set_pwm1_duty(pwm_value);

      SSD1306_Display();

      SSD1306_ClearDisplay();

      SSD1306_DrawRect(0, 0, 128, 15);

      SSD1306_Display();

      sprintf(buffer, "PWM: %u", pwm_value);

      SSD1306_DrawText(2, 3, buffer, 1);

      SSD1306_Display();

      duty = map(pwm_value, 0, 255, 0, 100);

      sprintf(Percent, " / %u %c", duty, sig);

      SSD1306_DrawText(55, 3, percent, 1);

      SSD1306_Display();

      SSD1306_DrawFastVLine(80, 15, 49);

      SSD1306_Display();

      SSD1306_DrawRect(85, 52, 40, 10);

      SSD1306_Display();

      SSD1306_DrawRect(85, 42, 40, 10);

      SSD1306_Display();

      SSD1306_DrawRect(85, 32, 40, 10);

      SSD1306_DrawRect(85, 22, 40, 10);

      SSD1306_Display();

      if(duty > 0)

        {

        SSD1306_FillRect(85, 52, 40, 10);

        SSD1306_Display();

        }

      if(duty > 25)

        {

        SSD1306_FillRect(85, 42, 40, 10);

        SSD1306_Display();

        }

      if(duty > 50)

        {

        SSD1306_FillRect(85, 32, 40, 10);

        SSD1306_Display();

        }

      if(duty > 75)

        {

        SSD1306_FillRect(85, 22, 40, 10);

        SSD1306_Display();

        }

      SSD1306_DrawFastVLine(30, 27, 20);

      SSD1306_Display();

      SSD1306_DrawFastVLine(50, 27, 20);

      SSD1306_Display();

      SSD1306_DrawFastVLine(70, 27, 20);

      SSD1306_Display();

      x1 = map(duty, 100, 0, 10, 30);

      SSD1306_DrawFastVLine(x1, 27, 20);

      SSD1306_Display();

      SSD1306_DrawFastHLine(x1, 27, 30-x1);

      SSD1306_Display();

      SSD1306_DrawFastHLine(10, 47, x1-10);

      SSD1306_Display();

      x2 = map(duty, 100, 0, 30, 50);

      SSD1306_DrawFastVLine(x2, 27, 20);

      SSD1306_Display();

      SSD1306_DrawFastHLine(x2, 27, 50-x2);

      SSD1306_Display();

      SSD1306_DrawFastHLine(30, 47, x2-30);

      SSD1306_Display();

      x3 = map(duty, 100, 0, 50, 70);

      SSD1306_DrawFastVLine(x3, 27, 20);

      SSD1306_Display();

      SSD1306_DrawFastHLine(x3, 27, 70-x3);

      SSD1306_Display();

      SSD1306_DrawFastHLine(50, 47, x3-50);

      SSD1306_Display();

      delay_ms(100);
   }
}
Simulation |
|---|
In the simulation the software got a bit heavy, as a consequence the simulation occurs somewhat slowly, however the satisfactory results can be easily appreciated.
En la simulación el software se puso algo pesado, como consecuencia la simulación ocurre con algo de lentitud, sin embargo los resultados satisfactorios se pueden apreciar con facilidad.
To clarify any doubts or provide any additional information I remain attentive to the comments section.
Para aclarar cualquier duda o brindar cualquier información adicional quedo atento a la sección de comentarios.

Congratulations @electronico! You have completed the following achievement on the Hive blockchain And have been rewarded with New badge(s)
Your next target is to reach 25000 upvotes.
You can view your badges on your board and compare yourself to others in the Ranking
If you no longer want to receive notifications, reply to this comment with the word
STOPCheck out our last posts:
20000... 20000... 20000... Yeeeeee!!! is amazing!!!

20k upvotes is a major milestone. Congrats @electronico 🎉
Thanks for your contribution to the STEMsocial community. Feel free to join us on discord to get to know the rest of us!
Please consider delegating to the @stemsocial account (85% of the curation rewards are returned).
You may also include @stemsocial as a beneficiary of the rewards of this post to get a stronger support.
Congratulations @electronico!
You raised your level and are now a Minnow!
Check out our last posts:
Wow, it seems that I'm still very small... I have a long way to go but I'm not going to stop, thanks for the info.
By the way, I noticed you do a great job setting goals for users and letting them know when they are reached, that's good.... There is a suggestion I'd like to make to you if I may....
Since you keep track of all those goals I think it would be appropriate (at least for me) that when I get an achievement along with the comment where you indicate the achievement reached you also attach which achievement I am lowest in.
That way I could focus on raising that goal and maintain a balance that will help me grow by strengthening the areas where I have presented more weakness.
If you can do that at least for me it would be much cooler than it already is!!!!
Sorry for the late reply. Thank you for your kind words and suggestion! We appreciate your feedback and always strive to improve the experience for our users.
Your idea of providing information on the lowest achievement along with the current achievement reached is interesting. It can indeed help users focus on specific areas to improve and maintain a balanced growth. We will consider this suggestion for future updates to our platform. In the meantime, you can always visit your HiveBuzz profile to view your progress and achievements, as well as identify areas where you can grow further.
Keep up the good work, and we look forward to celebrating more milestones with you!