Home Automation System - Aggiornamento Dashboard GRAFANA / GRAFANA Dashboard update ITA ENG
In this video I make a rundown of the latest changes made to the Grafana dashboards, in relation to the Home automation data collected on InfluxDB.
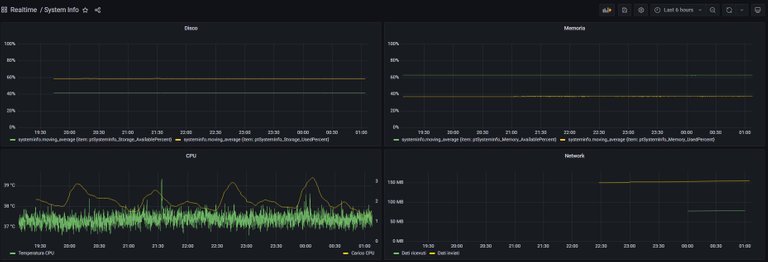
In particular, I added the dashboard that displays the data of my photovoltaic inverter; then I modified the alert dashboard to add some missing things and completed the info system dashboard.
This video does not presume to be a tutorial, but simply a step by step of what has been done to achieve the goal. I hope that it will help someone.
Enjoy your viewing
In questo video faccio una carrellata delle ultime modifiche apportate alle dashboard di Grafana, in relazione ai dati Home automation raccolti su InfluxDB.
In particolare, ho aggiunto la dashboard che visualizza i dati del mio inverter fotovoltaico; ho poi modificato la dashboard degli alert per aggiungere alcune cose che mancavano ed ho completato la dashboard system info.
Questo video non ha la presunzione di essere un tutorial, ma semplicemente uno step by step di quanto fatto per raggiungere l'obiettivo. La speranza è che possa essere d'aiuto a qualcuno.
Buona visione
Congratulations @marcolino76! You have completed the following achievement on the Hive blockchain and have been rewarded with new badge(s):
Your next target is to reach 130000 upvotes.
You can view your badges on your board and compare yourself to others in the Ranking
If you no longer want to receive notifications, reply to this comment with the word
STOPCheck out the last post from @hivebuzz:
Support the HiveBuzz project. Vote for our proposal!