Crypto Trading: Using RSI indicator to determine buy and sell positions
RSI is reputed as one of the most reliable trading indicators that can be used by traders and investors to analyze the market for opportunities.
Apart from reliability, RSI is also a very easy to use indicator, though the mathematical side of it possesses some form of complications.
But one can do without going into the technical side of the way RSI is calculated, it is pretty easy to get on a chart through pre-built programs that help to calculate it.
That being said, RSI was created some 40 something years ago by Welles Wilder.
And is based on the momentum of the buy and sell of any asset being evaluated.
RSI helps to identify when an asset/coin has been overbought or oversold.
RSI measures the change in the price of an asset and the rate at which the price of an asset changes.
The RSI value of a coin is usually a number between 1 and 100 when calculated, though most of the time this value can easily be calculated by looking at the asset price chart.
Mathematical Formula for Calculating RSI
In order to get the RSI of an asset any given time, you need to use the following formula.
RSI = 100 – 100 / (1 + RS)

RS = Average of X periods closes up / Average of X periods closes down

X = The trader is recommended to use 14
In the formula above, RS otherwise known as Relative Strength is gotten by calculating the average/arithmetic mean of the number of time an asset closes up divided by the average/arithmetic mean of the number of time an asset closes down.
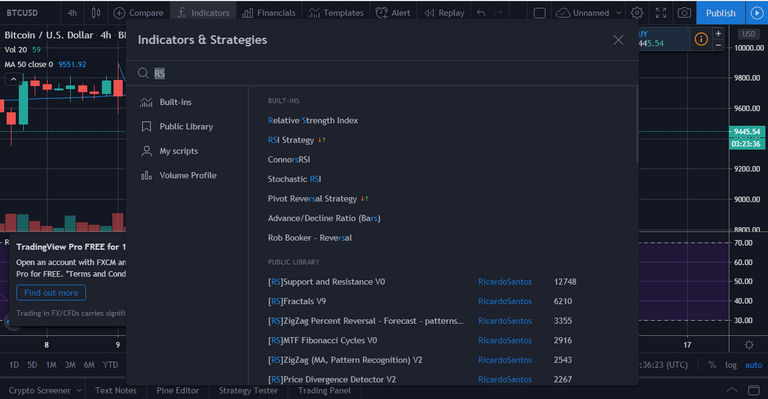
It is easy to read the RSI from an asset price chart, using this BTC_USD chart from TradingView as an example let's see how we can read the RSI of an asset off the price chart.
On the chart page, click on Indicators and search for RSI on the search bar
On the chart we will see a line directly below the price line, that's the RSI line
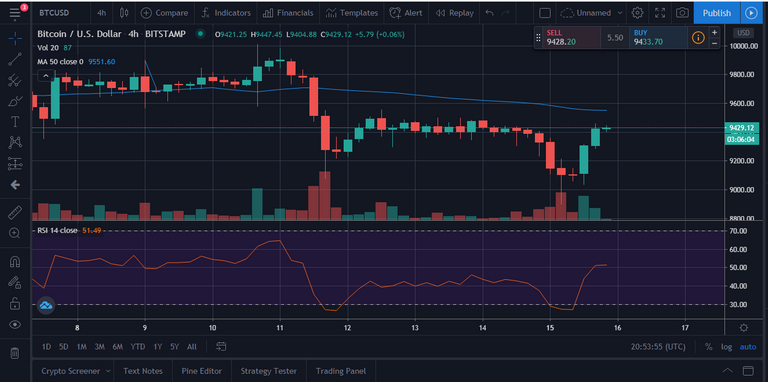
The tiny red line in the lower part of the image above is the RSI line.
Using RSI to Trade
The RSI usually indicates a signal at two different points.
The signals indicated include
- Showing when a coin has been overbought
- Showing when a coin has been oversold
When the RSI of the coin is over 70, it means the coin has been overbought and the price might fall anytime soon.
When the RSI of a coin is at 30 it means the coin has been oversold and the price of the coin may spike to a high anytime soon.
An overbought coin would require that the trader sell the coin and close position on the coin to prevent a potential loss.
An oversold coin would require that the trader buy the coin in preparation for a potential spike in price and take profit.
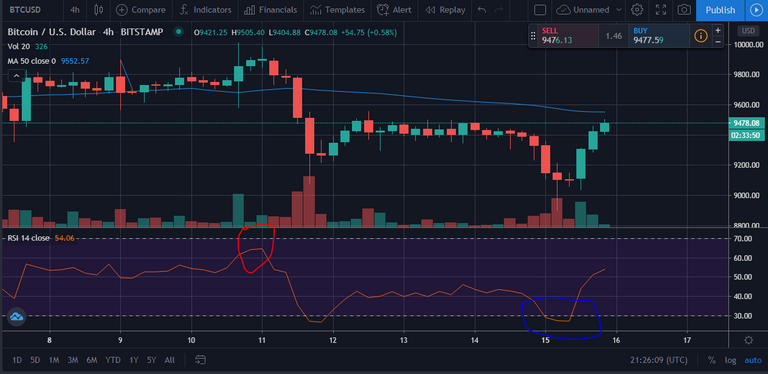
In the image above, the area circled in blue is regarded as an oversold point while the area circled in red is not necessarily an overbought point but it is rapidly approaching the overbought conditions.
The key takeaway that you should always keep in mind is that an oversold coin should be bought and an overbought coin should be sold for profit or to prevent losses.
@tipu curate
Upvoted 👌 (Mana: 14/28)
Congratulations @michaelmaddof! You have completed the following achievement on the Hive blockchain and have been rewarded with new badge(s) :
You can view your badges on your board And compare to others on the Ranking
If you no longer want to receive notifications, reply to this comment with the word
STOPTo support your work, I also upvoted your post!
Support the HiveBuzz project. Vote for our proposal!