Crypto Trading: Trading cryptocurrencies using moving averages as an indicator
Moving averages are useful indicators in any kind of market, they are gotten from calculating the average price of an asset over a given period of time.
In the world of cryptocurrencies, moving averages used alongside some other major indicators are very good ways of determining the direction the market will take.
Moving averages can be calculated over a period of time, the period being used is totally dependent on the trader and the time frame on the chart being used by the trader.
The most common Moving Average periods used by traders in their analysis includes the 50 MA, 100 MA and the 200 MA.
Let's say for example, a trader is looking at a 50 MA line on a 4hr chart for any trade-able asset, it means the trader is analyzing the price action for the last 200 hours. The arrival at 200 hours is gotten by multiplying the number of Moving Averages(50) by the timeframe(4)
As an indicator, Moving Averages are very easy to use and can be divided into two main types
- Simple Moving Averages
- Exponential Moving Averages
Simple Moving Averages
SMA's as they are known are usually gotten by calculating the arithmetic mean of the price over the chosen period of MA used by the trader.
The SMA of a coin using 50 MA would be to add the last 50 prices of that coin over the chosen timeframe and then divide the sum by 50.
Using SMA's tend to exhibit a certain downside though, if a price out of the prices falls out of the range of the remaining prices it can actually cause a distortion in the value of the SMA.
In order to view SMA's in TradingView for any coin chart, the user has to click on the Indicators icon on the upper part of the chart to reveal a list of available indicators
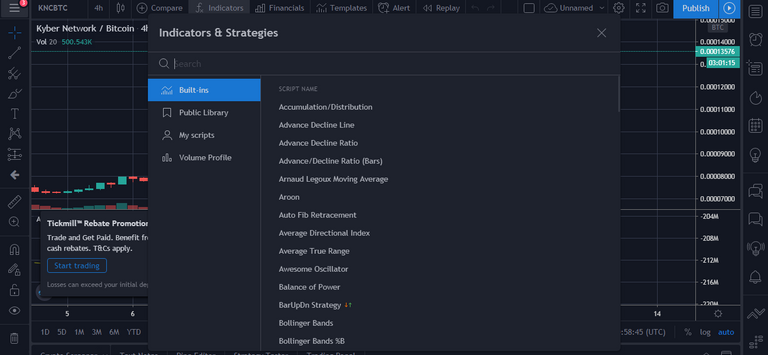
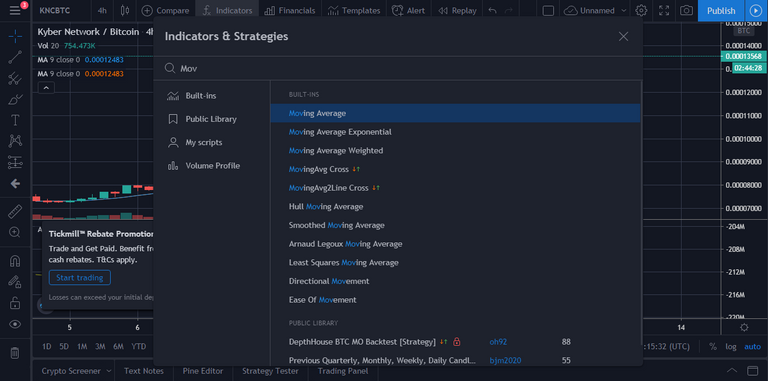
On the displayed pop-up we can now search for the term Moving Average and add it to the chart.
On the chart we can now find the MA of the coin by following the blue line
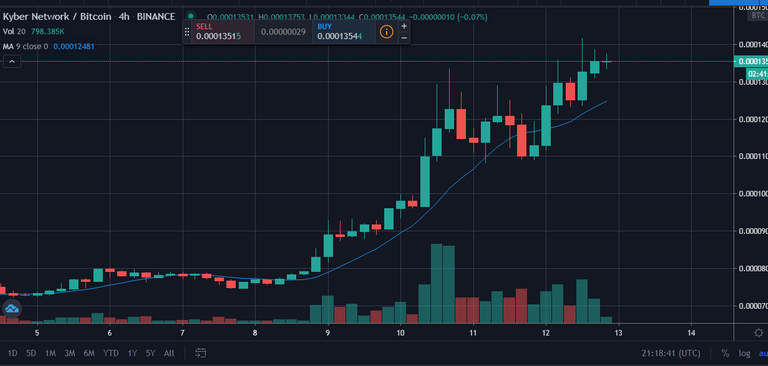
If the price is above the MA line on the chart, it means the market for that coin is bullish. If the price is below the line it means it is bearish.
Exponential Moving Averages
Where the simple moving average is a product of arithmetic mean, the exponential moving average or EMA is not.
Due to the possible errors that can result from using SMA's, EMA tends to focus on adding more weight to the most recent price of the coin being analyzed when calculating the EMA.
EMA's have a tendency to be more accurate than SMA's and is more favored by people who do long term trading.
EMA's can be added on the TradingView chart by following the same process for adding the SMA's.
Congratulations @michaelmaddof! You have completed the following achievement on the Hive blockchain and have been rewarded with new badge(s) :
You can view your badges on your board And compare to others on the Ranking
If you no longer want to receive notifications, reply to this comment with the word
STOPTo support your work, I also upvoted your post!
Support the HiveBuzz project. Vote for our proposal!