BTC, ETH, STEEM and HIVE analysis using Python (from 2020 to 2021)
Crypto Market study of BTC, ETH, STEEM and HIVE, from 2020 to 2021 (one full year). The main goal of this analysis, is to make a comparison of these four cryptocurrencies, using several python libraries and statistical analysis.
Import Python Libraries
import pandas as pd
import pandas_datareader.data as web
from datetime import datetime
import numpy as np
import seaborn as sns
from plotly.offline import iplot
import cufflinks as cf
import plotly.express as px
import matplotlib.pyplot as plt
cf.go_offline()
cf.set_config_file(offline=False, world_readable=True)
%config InlineBackend.print_figure_kwargs = {'bbox_inches':None}
%config InlineBackend.rc = {'font.size': 10, 'figure.figsize': (10.0, 7.0), 'figure.facecolor': (1, 1, 1, 0), 'figure.subplot.bottom': 0.125, 'figure.edgecolor': (1, 1, 1, 0), 'figure.dpi': 72}
%matplotlib inline
Define start and end date
start = datetime(2020, 3, 30)
end = datetime(2021, 3, 24)
Create Data Frames for each Cryptocurrency
BTC = web.DataReader('BTC-USD', 'yahoo', start, end)
ETH = web.DataReader('ETH-USD', 'yahoo', start, end)
STEEM = web.DataReader('STEEM-USD', 'yahoo', start, end)
HIVE = web.DataReader('HIVE-USD', 'yahoo', start, end)

cryptos = [BTC, ETH, STEEM, HIVE]

ticks = ['BTC', 'ETH', 'STEEM', 'HIVE']
Hive Data Frame Header
    High    Low Open    Close   Volume  Adj Close
Date
2020-03-29  0.214535    0.181311    0.193561    0.193029    37124.0 0.193029
2020-03-30  0.198990    0.164887    0.192400    0.178775    35451.0 0.178775
2020-03-31  0.203500    0.169290    0.178704    0.197060    35316.0 0.197060
2020-04-01  0.205896    0.170124    0.196492    0.182773    45439.0 0.182773
2020-04-02  0.191577    0.172460    0.182715    0.179288    60969.0 0.179288
Concatenate Data Frames for better visualization
cryptos_df = pd.concat(cryptos, axis = 1, keys = ticks)
cryptos_df.columns.names = ['Cryptos', 'Info']
cryptos_df.head()
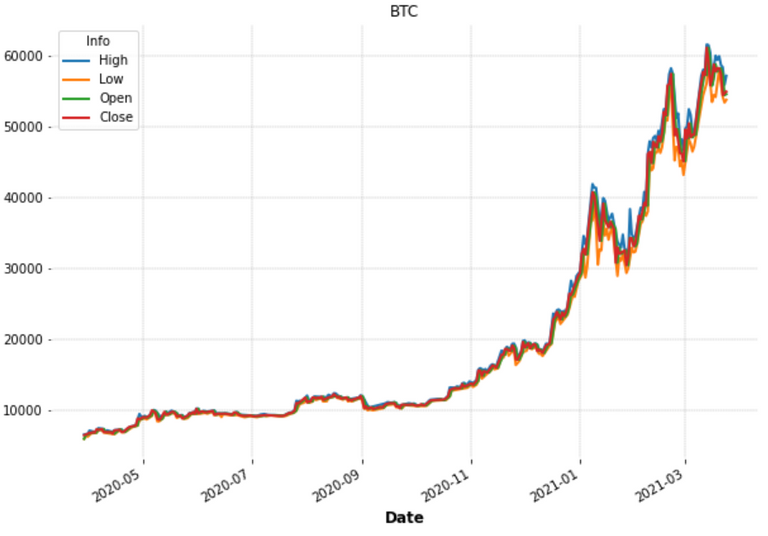
Plots of "Open", "Close", "High" and "Low" for each Cryptocurrency
for i in ticks:
    cryptos_df[i].drop(['Volume', 'Adj Close'], axis = 1).plot()
    plt.title(i)
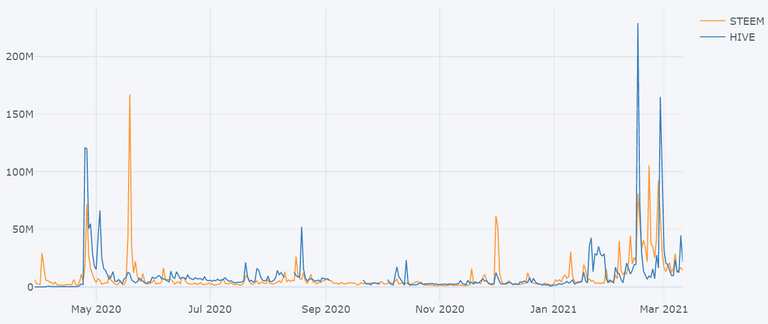
Volume of each cryptocurrency
volumes = pd.DataFrame()

for i in ticks:
    volumes[i] = cryptos_df[i]['Volume']

volumes[ticks[:2]].iplot()
volumes[ticks[2:]].iplot()
Obtain dates for the highest volumes
max_vols = []
for i in ticks:
    value = volumes[i].iloc[[volumes[i].argmax()]].to_frame()
    max_vols.append(value)

high_volume = pd.concat(max_vols, axis = 1)

high_volume.head()
| Date | Volume | |
|---|---|---|
| BTC | 2021-02-26 | 3.509679e+11 |
| ETH | 2021-01-11 | 6.073363e+10 |
| STEEM | 2021-03-22 | 475655991.0 |
| HIVE | 2021-03-23 | 846450368.0 |
We can see that both HIVE and STEEM had the highest volumes on this month (March 2021)
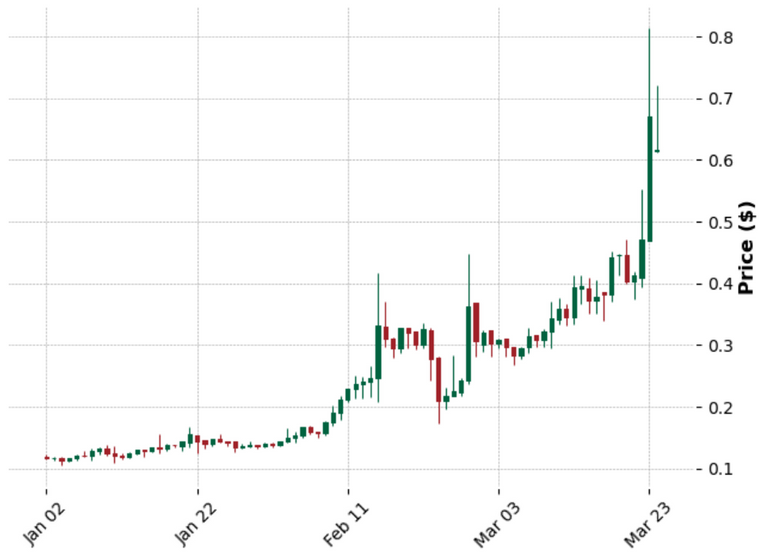
HIVE Candlestick Chart of 2021
import mplfinance as fplt
#from matplotlib.dates import DateFormatter, date2num, WeekdayLocator, DayLocator, MONDAY

fplt.plot(
            HIVE.iloc[250:],
            type='candle',
            style='charles',
            title='HIVE Candlestick (2021)',
            ylabel='Price ($)',
            )
Daily Percentage Change (Returns)
r = (P1/P2) - 1
returns = pd.DataFrame()

for i in ticks:
    returns[i + ' Returns'] = cryptos_df[i]['Close'].pct_change()

returns.head()
Returns Data Frame Header
BTC Returns ETH Returns STEEM Returns   HIVE Returns
Date
2020-03-29  NaN NaN NaN NaN
2020-03-30  0.001369    0.005184    -0.026310   -0.073844
2020-03-31  0.026113    0.015278    0.021583    0.102279
2020-04-01  0.028281    0.047146    0.001803    -0.072501
2020-04-02  -0.008867   0.000438    0.140814    -0.019067
Obtain maximum returns for each crypto
for i in range(len(ticks)):
    print('Date: ' + str(returns[ticks[i] + ' Returns'].idxmax())[:10] + " Max Return " + ticks[i] + ': ' + str(returns.iloc[:, i].max()))

Date: 2021-02-08 Max Return BTC: 0.18746473766529936
Date: 2021-01-03 Max Return ETH: 0.2594753293956862
Date: 2021-03-22 Max Return STEEM: 0.32037727117672854
Date: 2020-04-23 Max Return HIVE: 1.3697716791032435
Obtain worst returns for each crypto
returns.idxmin() # worst single day returns

BTC Returns     2021-01-21
ETH Returns     2021-01-21
STEEM Returns   2021-02-23
HIVE Returns    2020-04-26
Even though the coronavirus outbreak had a great impact in the single day returns, the highest and the minimum values for BTC, ETH, and STEEM were already in 2021, probably due to the beginning of the bull market. HIVE is the exception, the best and worst single day returns occurred in April 2020, when HIVE spiked due to the STEEM fork
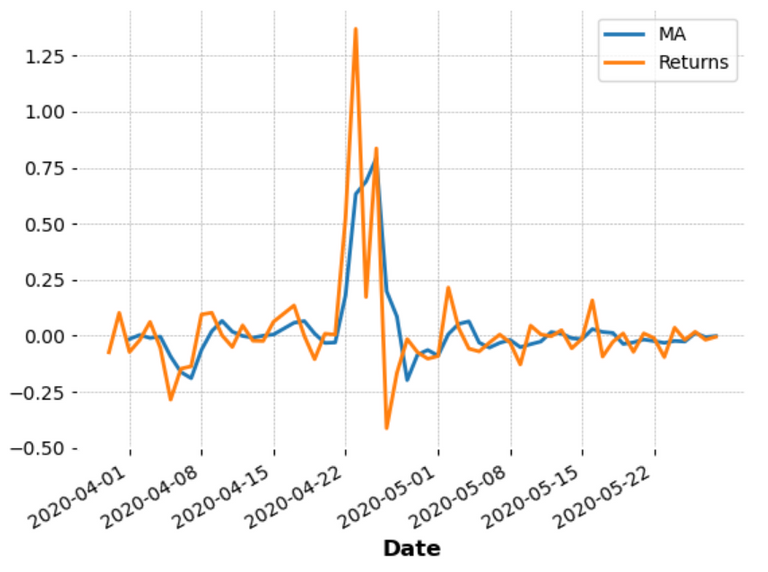
Moving average on HIVE around the maximum returns
HIVE['Returns'].argmax()

24

HIVE['MA'] = HIVE.iloc[:60]['Returns'].rolling(3).mean() # smoothing with Moving Average
HIVE.iloc[:60].drop(['High', 'Low','Open', 'Close', 'Volume', 'Adj Close', 'Total Trade'], axis = 1).plot()
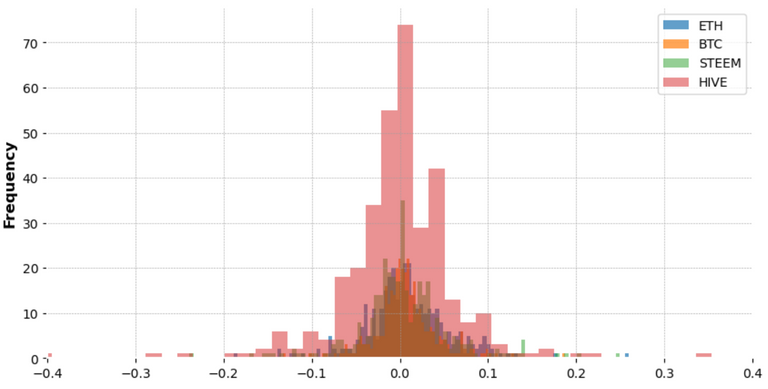
Volatility
fig = plt.figure(figsize=(10, 5))

returns['ETH Returns'].plot.hist(bins = 100, label = 'ETH', alpha = 0.7)
returns['BTC Returns'].plot.hist(bins = 100, label = 'BTC', alpha = 0.7)
returns['STEEM Returns'].plot.hist(bins = 100, label = 'STEEM', alpha = 0.5)
returns['HIVE Returns'].plot.hist(bins = 100, label = 'HIVE', alpha = 0.5)
plt.xlim([-0.4, 0.4])
plt.legend(fontsize = 10)
From the histograms above, we can see that all the cryptocurrencies are volatile because they show a big deviation. Nevertheless, HIVE is the one with higher volatility in the defined range. This volatility, might be related to the STEEM fork, some days after HIVE's launch, the price peaked to ATH very rapidly.
fig = plt.figure(figsize=(10, 5))

returns['BTC Returns'].plot(kind = 'kde', label = 'BTC')
returns['ETH Returns'].plot(kind = 'kde', label = 'ETH')
returns['STEEM Returns'].plot(kind = 'kde', label = 'STEEM')
returns['HIVE Returns'].plot(kind = 'kde', label = 'HIVE')
plt.xlim([-0.2, 0.2])
plt.legend(fontsize = 10)
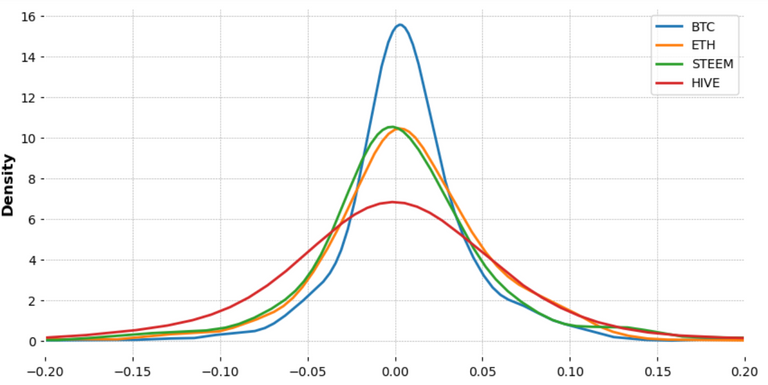
The kernel plots above confirm that HIVE is the one with higher volatility. Easily confirmed by the large distribution. BTC is the less volatile from the following cryptocurrencies, in the defined range.
Standard deviation of the Returns
returns.std()

BTC Returns      0.035037
ETH Returns      0.047000
STEEM Returns    0.056024
HIVE Returns     0.116130
dtype: float64
For this year only...
returns.loc['2021-01-01':].std()

BTC Returns      0.049388
ETH Returns      0.063443
STEEM Returns    0.080352
HIVE Returns     0.102327
dtype: float64
This year HIVE keeps on showing higher risk compared to the other cryptos. However, it is the youngest crypto of the four, so more risk/reward associated, but at the same time, more space to grow.
Congratulations @macrodrigues! You have completed the following achievement on the Hive blockchain and have been rewarded with new badge(s) :
Your next target is to reach 50 upvotes.
You can view your badges on your board and compare yourself to others in the Ranking
If you no longer want to receive notifications, reply to this comment with the word
STOPCheck out the last post from @hivebuzz:
I really love to read the tutorials in python which helps in analysis of the crypto currencies and financials as a whole
I should look into this :) thank you for sharing it . I had totally forgotten about the standard deviation function so yeah this will help .
Posted Using LeoFinance Beta