Crypto Data From Kucoin In Python
Hi there. In this programming post with Python I cover obtaining cryptocurrency data from the Kucoin exchange. This is a part of a series that I have doing which combines programming, data analysis and crypto.
In a previous post where I used Python for Binance crypto data, I used a Youtube reference video. This time around I used this documentation link.
You can also check out my code in the form a jupyterNotebook here.

Topics
- API Setup
- Testing Out Some Functions
- Obtaining Historical Data of ETHUSDT
- A Candlestick Price Chart Produced With mplfinance
- Creating A Function For Obtainin Crypto Data & Creating Candlestick Charts
API Setup
To start, API information can be obtained from this link. You need an API key, a passphrase and a secret API key. These three are needed for the Kucoin client.
from kucoin.client import Client
import pandas as pd

# Use API info into Client()

client = Client(api_key, secret, passphrase)

Testing Out Some Functions
Once the setup is done, you can play around with some functions.
Obtain Currencies
# Obtain currencies

currencies = client.get_currencies()

# Show first three cryptocurrencies.

currencies[0:3]

[{'currency': 'CSP',
  'name': 'CSP',
  'fullName': 'Caspian',
  'precision': 8,
  'confirms': 12,
  'contractAddress': '0xa6446d655a0c34bc4f05042ee88170d056cbaf45',
  'withdrawalMinSize': '2000',
  'withdrawalMinFee': '500',
  'isWithdrawEnabled': True,
  'isDepositEnabled': True,
  'isMarginEnabled': False,
  'isDebitEnabled': False},
 {'currency': 'LOKI',
  'name': 'OXEN',
  'fullName': 'Oxen',
  'precision': 8,
  'confirms': 10,
  'contractAddress': '',
  'withdrawalMinSize': '2',
  'withdrawalMinFee': '2',
  'isWithdrawEnabled': True,
  'isDepositEnabled': True,
  'isMarginEnabled': False,
  'isDebitEnabled': True},
 {'currency': 'NRG',
  'name': 'NRG',
  'fullName': 'Energi',
  'precision': 8,
  'confirms': 5000,
  'contractAddress': '',
  'withdrawalMinSize': '0.3',
  'withdrawalMinFee': '0.2',
  'isWithdrawEnabled': True,
  'isDepositEnabled': True,
  'isMarginEnabled': False,
  'isDebitEnabled': True}]
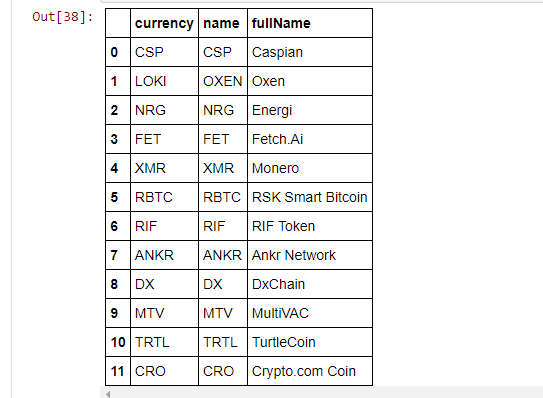
Obtaining Crypto Names
crypto_names = pd.DataFrame(currencies)[['currency', 'name', 'fullName']]

# Crypto Names as dataframe:

crypto_names.head(12)
Extracting Crypto Trading Pairs
Obtaining crypto trading pairs requires .get_symbols(). But it is not enough. To extract the crypto pairs, I use list comprehension. The first three crypto pairs are REQ-ETH, REQ-BTC, NULS-ETH.
# Crypto Trading Pairs:

crypto_pairs = client.get_symbols()

# Extract crypto pairs:

crypto_pairs_list = [x['symbol'] for x in crypto_pairs]

crypto_pairs_list[0:3]

# ['REQ-ETH', 'REQ-BTC', 'NULS-ETH']

Obtaining Historical Data of ETHUSDT
Obtaining historical data for a crypto trading pair involves the use of .get_kline_data(). The arguments required for .get_kline_data() are a crypto trading pair, a timeframe such as 1day, a start time in the UNIX format and an end time in the UNIX time format.
# Converting dates into UNIX time format:

import datetime
from datetime import date
import time


# Start timepoint:

first_time = datetime.date(2019, 4, 13)

unixtime1 = int(time.mktime(first_time.timetuple()))


# End timepoint:

today = date.today()

unixtime2 = int(time.mktime(today.timetuple()))
With .get_kline_data(), you can obtain price data on a crypto trading pair such as ETH-USDT.
# Obtain ETH-USDT daily candlestick prices with UNIX times:

eth_usdt_klines = client.get_kline_data('ETH-USDT', '1day', unixtime1, unixtime2)
When the data is converted into a pandas dataframe, the column names are named from the numbers 0 to 6. They have to be renamed to avoid confusion.
# Convert into a pandas dataframe:

eth_usdt_df = pd.DataFrame(eth_usdt_klines)

# Rename columns:

column_names = ['Start Time', 'Open', 'Close', 'High', 'Low', 'Transaction amount', 'Volume']
eth_usdt_df.columns = column_names
The data types for the values need to be converted into a numeric format. Start Time is converted from numeric into a datetime format. I also sort the values in ascending order by Start Time. This sorting is for making sure the candlestick price chart comes out right in the next section.
# Change columns to numeric:

eth_usdt_df = eth_usdt_df[column_names].apply(pd.to_numeric)

# Convert start time into date format:

eth_usdt_df['Start Time'] = pd.to_datetime(eth_usdt_df['Start Time'], unit = 's')

# Sorting in ascending order for Start Time to make sure mplfinance plot works out:

eth_usdt_df = eth_usdt_df.sort_values(by = "Start Time", ascending = True)

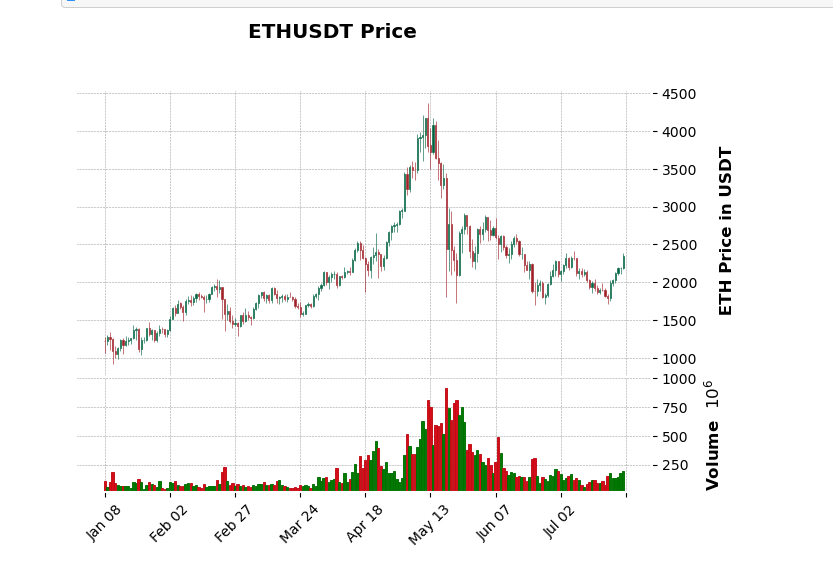
A Candlestick Price Chart Produced With mplfinance
Once the data is ready, you can create candlestick price charts with the help of Python's mplfinance package. You can produce a candlestick price chart with trading volume on the bottom like the one below.
import mplfinance as mpf

# Candlestick plot of ETHUSDT

mpf.plot(eth_usdt_df.set_index('Start Time').tail(200),
         type = 'candle', style = 'charles',
         volume = True,
         title = "ETHUSDT Price",
         ylabel = '\n ' + 'ETH Price in USDT'
)

Creating A Function For Obtaining Crypto Data & Creating Candlestick Charts
Like in the post for Binance crypto data into Python, I combine the previous steps and put them all together in a function. The output is a candlestick price chart for showing price movements and trading volume.
Inputs:
- Base Currency from Base/Quote like in BTC/USDT
- Quote Currency
- A timeframe of either
1min,1hour,12hour,1day,1week - Start date in a datetime format
- End date in a datetime format
- Number of time periods (default is 200)
# Create plotting function:
def kucoin_candlestick_chart(base_cur, quote_cur, timeframe, start_date, end_date, num_periods = 200):
# Get trading pair:
pair = base_cur + "-" + quote_cur
# Convert start and end dates into UNIX epoch time format:
unixtime1 = int(time.mktime(start_date.timetuple()))
unixtime2 = int(time.mktime(end_date.timetuple()))
# Obtain Kucoin Crypto Pairs:
crypto_pairs = client.get_symbols()
crypto_pairs_list = [x['symbol'] for x in crypto_pairs]
# Check if user crypto pair is in the list for Kucoin:
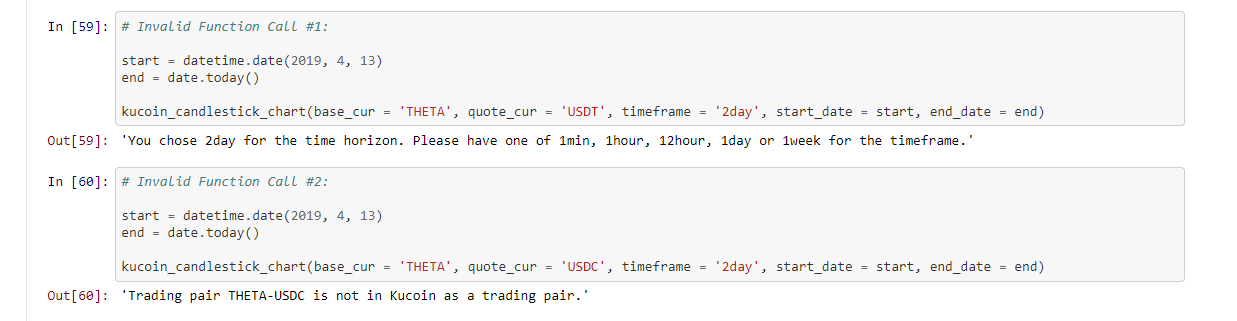
if pair not in crypto_pairs_list:
return("Trading pair " + pair +" is not in Kucoin as a trading pair.")
# Obtain kline_data if conditions are met:
if timeframe in ['1min', '1hour', '12hour', '1day', '1week']:
klines = client.get_kline_data(pair, timeframe, unixtime1, unixtime2)
else:
return("You chose " + timeframe + " for the time horizon. Please have one of "\
+ "1min, 1hour, 12hour, 1day or 1week for the timeframe.")
# Produce pandas dataframe from klines:
df = pd.DataFrame(klines)
# Column Names:
column_names = ['Start Time', 'Open', 'Close', 'High', 'Low', 'Transaction amount', 'Volume']
# Renaming column names:
df.columns = column_names
# Change columns from object to numeric:
df = df[column_names].apply(pd.to_numeric)
# Convert start time into date format:
df['Start Time'] = pd.to_datetime(df['Start Time'], unit = 's')
# Sorting in ascending order for Start Time to make sure mplfinance plot works out:
df = df.sort_values(by = "Start Time", ascending = True)
# Candlestick Plot, obtain last 200 time periods.
mpf.plot(df.set_index('Start Time').tail(num_periods),
type = 'candle', style = 'charles',
volume = True,
title = "Price of " + pair,
ylabel = '\n ' + base_cur + ' Price in ' + quote_cur)
I have include some if statements to check that a valid timeframe is inputted as well if a valid Kucoin crypto trading pair is there.
Invalid Function Calls
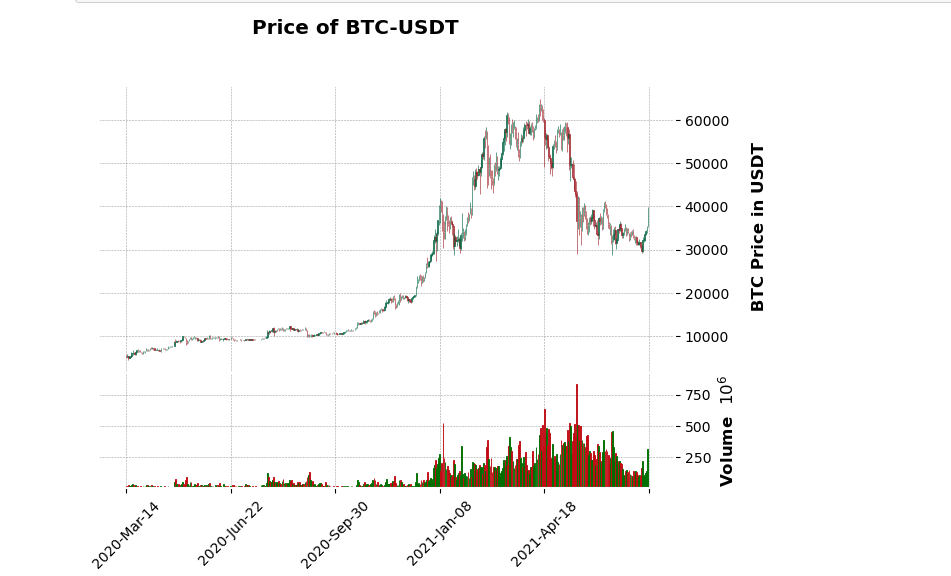
Function Calls
# Function Call #1 (Last 500 days) For Bitcoin - Tether

start = datetime.date(2018, 4, 13)
end = date.today()

kucoin_candlestick_chart(base_cur = 'BTC', quote_cur = 'USDT',
                         timeframe = '1day', start_date = start, end_date = end,
                         num_periods = 500)
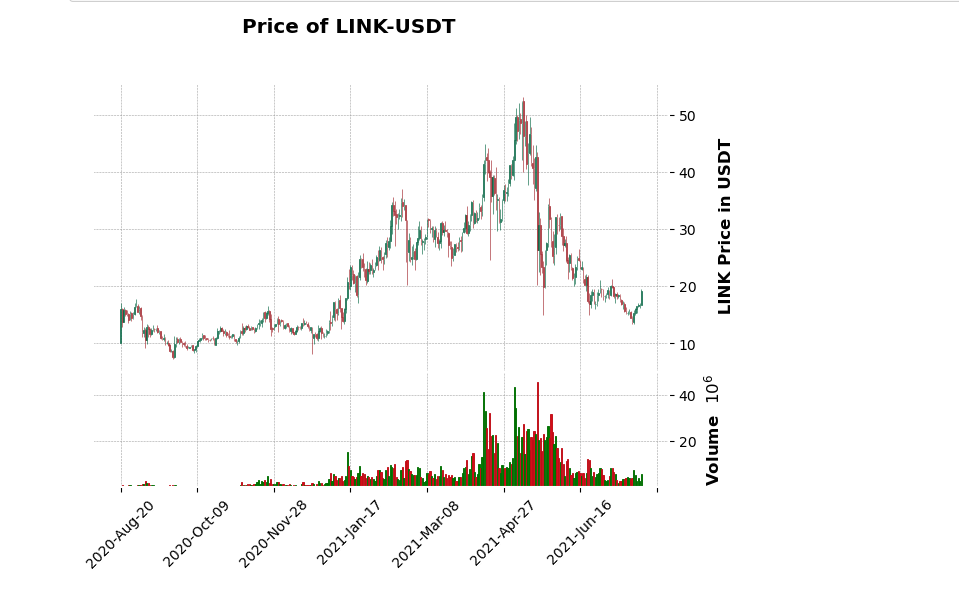
# Function Call #2 (Last 500 days) For Chainlink-Tether

start = datetime.date(2016, 1, 1)
end = date.today()

kucoin_candlestick_chart(base_cur = 'LINK', quote_cur = 'USDT',
                         timeframe = '1day', start_date = start, end_date = end,
                         num_periods = 500)

I upvoted you, thank you for posting!