Histogram equalization image
Histogram
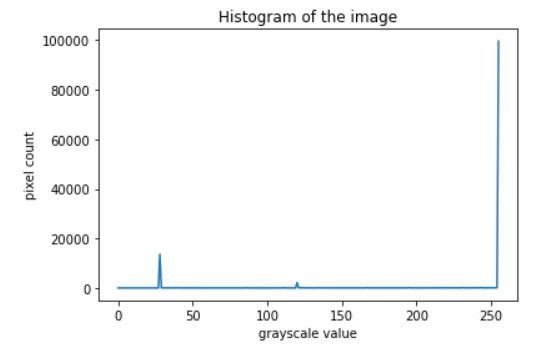
Histogram is a graphical representation of the intensity distribution of an image. In simple terms, it represents the number of pixels for each intensity value considered.
Histogram equalization is a method in image processing of contrast adjustment using the image’s histogram. This method usually increases the global contrast of many images, especially when the usable data of the image is represented by close contrast values. Through this adjustment, the intensities can be better distributed on the histogram. This allows for areas of lower local contrast to gain a higher contrast. Histogram equalization accomplishes this by effectively spreading out the most frequent intensity values. The method is useful in images with backgrounds and foregrounds that are both bright or both dark. OpenCV has a function to do this, cv2.equalizeHist(). Its input is just grayscale image and output is our histogram equalized image.
Tools Used: Jupyter NoteBook
Python Libraries: OpenCV, numpy, matplotlib
Program:
import cv2
import numpy as np
import matplotlib.pyplot as plt
read a image using imread
image = cv2.imread('D:\Pictures\BiggestLoser.png')
image = cv2.cvtColor(image,cv2.COLOR_BGR2RGB)
to show the original image
plt.title('Original image')
plt.imshow(image);
Converting the original image to grayscale
gray_image = cv2.cvtColor(image, cv2.COLOR_BGR2GRAY)
to show grey scale image
plt.title('Grayscale image')
plt.imshow(gray_image, cmap='gray', vmin = 0, vmax = 255);
find frequency of pixels in range 0d frequency of pixels in range 0--255255
histr = cv2.calcHist([gray_image],[0],None,[256],[0,256])
plotting histogram
plt.title('Histogram of the image')
plt.xlabel('grayscale value')
plt.ylabel('pixel count')
plt.plot(histr)
plt.show()
creating a Histograms Equalization of a of a image using cv2.equalizeHist()
equal = cv2.equalizeHist(gray_image)
stacking images side
result = np.hstack((gray_image, equal))
show image input vs output
cv2.imshow('BiggestLoserImage', result)
cv2.waitKey(0)
cv2.destroyAllWindows()

Explanation:
- Three Python Libraries OpenCv, numpy and matplotlib are used so we have to import it in the program.
- Matplotlib.pyplot is used to plot the histogram and display the original/grayscale image.
- The original image is converted to grayscale for histogram equalization.
- Imread function of OpenCv is used for reading the image and in it the path of the image and the flag value (0 which is for grayscale) is given.
- calcHist() function of OpenCv is used to calculate the histogram of the grayscale image. It contains various attributes: images : it is the source image of type uint8 or float32 represented as “[img]”. channels : it is the index of channel for which we calculate histogram. For grayscale image, its value is [0] and color image, you can pass [0], [1] or [2] to calculate histogram of blue, green or red channel respectively. mask : mask image. To find histogram of full image, it is given as “None”. histSize : this represents our BIN count. For full scale, we pass [256]. ranges : this is our RANGE. Normally, it is [0,256]
- We use the equalizeHist function of OpenCV which takes the greyscale image and converts to histogram equalized image.
- We use the hstack() function of the numpy to stack the sequence of input arrays horizontally (i.e. column wise) to make a single array.
- We use imshow method of OpenCV to display an image in a window. The window automatically fits to the image size.
- waitKey() will pause the screen and destroyAllWindows() will close all the windows if multiple windows are open.
References: wikipedia, personal prepared notes
Reference 1 Reference 2
I tried to make the code simple to understand and gave explanation of the various functions used in the program. Feel free to give your suggestions. Until we meet again in some other post, this is @biggestloser signing off....

I have no clue but the work put in the blog deserves a big vote
Thank you mam, you have always been a great support...
Congratulations @biggestloser! You have completed the following achievement on the Hive blockchain and have been rewarded with new badge(s) :
Your next target is to reach 400 upvotes.
You can view your badges on your board and compare yourself to others in the Ranking
If you no longer want to receive notifications, reply to this comment with the word
STOPTo support your work, I also upvoted your post!
Check out the last post from @hivebuzz:
Thank you sir
You're welcome @biggestloser 😊👍 Nice motivation!
BTW, it would be much appreciated if you support our proposal so we can continue our work!
https://peakd.com/me/proposals/147
Thank you!
Good job friend, greetings!!
Thank you mam🤗 🤗 🤗
!discovery 25
Thank you sir 🤗 🤗 🤗
This post was shared and voted inside the discord by the curators team of discovery-it
Join our community! hive-193212
Discovery-it is also a Witness, vote for us here
Delegate to us for passive income. Check our 80% fee-back Program
Thanks.....
You are welcome :)
I learned something here, which is always cool! Thank you for this informative post! 😃
Thank you mam, much appreciated....🤗 🤗 🤗
Hello @biggestloser!
Well, I do not understand what you say because I do not handle the program, however I suppose you say the following:
1- All images in the program are loaded in black and white
2- The codes paint the image adding the grayscale
3- Codes that stabilize the image
4- Codes that add color like red and blue to the image
5- Codes that add the measurement to the image
and all that together is called Histogram.
Every day something is learned, thank you for your article.
Hey @victoriaxl, I am very happy you read the blog entirely, histogram equalization basically deals with increasing the contrast of the image. The image was converted to grayscale so that we deal only with black and white.
Imagine you have done a x-ray but the quality is poor, means it is difficult to distinguish between the white part and black. So if somehow we manage to equalize the image in such a way that a brighter part appears brighter and the dark part appears darker, we can easily study the x-ray.
Histogram equalization thus have a great scope in image processing and computer vision
Hope my example of x-ray has made it more clear. Anyways if you have any other doubts feel free to ask I am a LOSER I have nothing better to do 😁 😁 😁 ..............
If the X-ray example makes it clear, then the program is very useful for medical science, that's great.
A gentleman who knows how to do what you explain in this article cannot be called a loser. Thank you for taking the time to clarify the meaning of the histogram.
That's so kind of you to say, I am thrilled right now.
I will have happy dreams tonight since I got someones appreciation😁 😁 😁 . Have a great life
and here is my token of gratitude !LUV
@victoriaxl, you've been given LUV from @biggestloser.
Check the LUV in your H-E wallet. (1/1)
Life at the present time is not easy for anyone, but from all experiences we must strive to lift our spirits, helping each other with affirmative words is a great incentive that we all need, nobody is perfect or strong enough but The goal is to work on oneself to climb one more step on the ladder of life in harmony and peace. Thank you for showing gratitude that is another of the important and valuable things in people's lives.
DEEP WORDS mam, you are great at writing 👌 👌 👌 . You are not only kind but a good writer too, I wish I could write like you ....