Programming My Own Trading Chart - Part 8
It's been a while since my last update in the trading chart. There's quite a bit of progress that has been made since then.
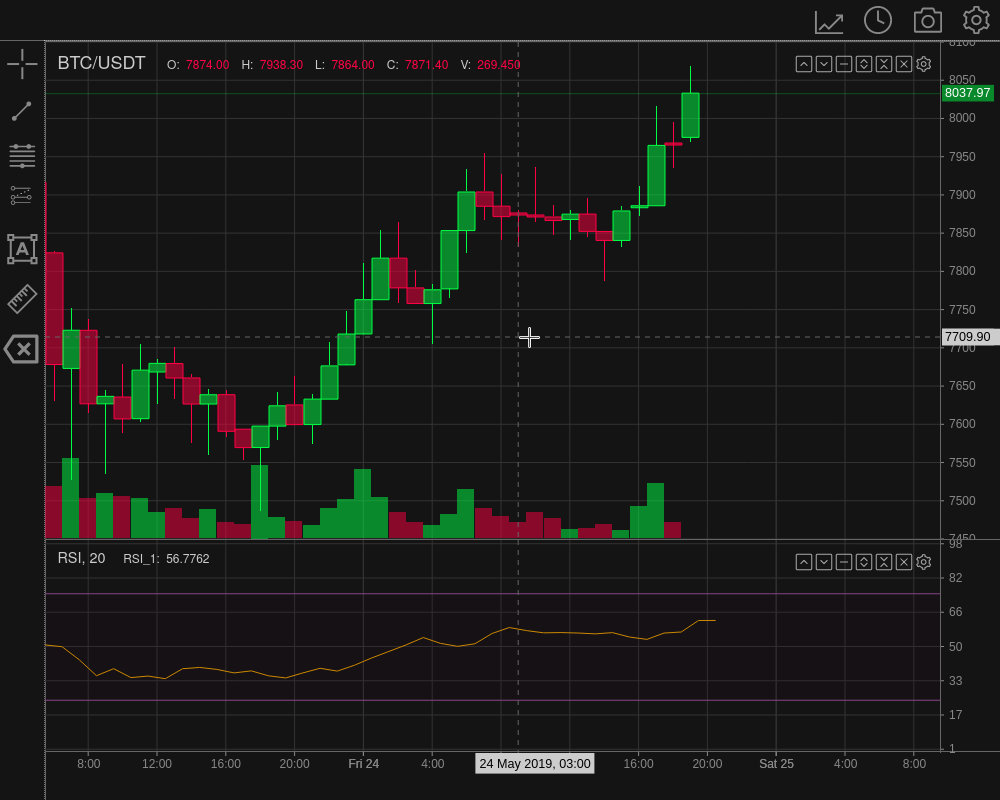
- The chart can now smooth scroll instead of jumping candles.
- Zoom the displayed price history range via the mouse wheel
- Chart panes, chart and off chart indicators (RSI ect.) can now be resized via the mouse
- The chart can now display a live (streaming) price feed
- It is / will use the TALib WASM library for indicator calculation.
These are the major advancements, but there many many more bug fixes and tiny additions added to the chart.
There is finally an online demo for testing out the chart.
The chart code is open source and accessible via the GitHub repository
It is still under heavy development and thus not production ready as it still missing features and has bugs.
I'm interested in constructive feedback (testing) or contributions.
Posted Using LeoFinance Beta
0
0
0.000
Dear @leoplaw,
May I ask you to review and support the Dev Marketing Proposal (https://peakd.com/me/proposals/232) we presented on Conference Day 1 at HiveFest?
The campaign aims to onboard new application developers to grow our ecosystem. If you missed the presentation, you can watch it on YouTube.
You cast your vote for the proposal on Peakd, Ecency, Hive.blog or using HiveSigner.
Thank you!
awesome post, inspiring❤️