Creating Custom Reports Using FinViz API
FinViz is a great website for stock market traders and investors. Even if you are not interested in programming and automating trading related tasks, but you are interested in stock markets you will find FinViz to be useful website. It provides information and tools that helps in evaluating trade ideas and analyzing stocks.
A list of valid stock tickers is needed to programmatically test various trading ideas and strategies. One of the ways I have used FinViz was to get a list of stock tickers using FinViz screener and a python code. I used to use Selenium to the list of tickers to use in other code scripts.
One of the problems of using the same list of tickers over an over is at some point the list will end up containing invalid tickers because some stocks get delisted from exchanges. For this reason, the ticker list needs to be updated from time to time. Since this tickers list is used in various different projects/codes, some of them would eventually end up not working properly due to an invalid ticker in the list.
One solution would be to create the list every time other codes/tasks are performed. But that would be inefficient. That's why I wanted to find a better way to keep tickers listed updated.
About a year ago, I have come across with FinViz API created by Mario Stoev. It is an unofficial Python API for FinViz. Feel free to visit the GitHub page for the project at https://github.com/mariostoev/finviz for details.
FinViz API has interesting functions that can be helpful for various projects and it is super easy to use.
To get a list of stocks and information about them:
from finviz.screener import Screener

stock_list = Screener()
print(type(stock_list))
stock_list.to_csv('finviz_stocks_list.csv')
The code above gets 8000+ stock tickers and other information about tickers and saves them as a csv file. The information saved is the same that is shown on FinViz Screener as shown in the image below.
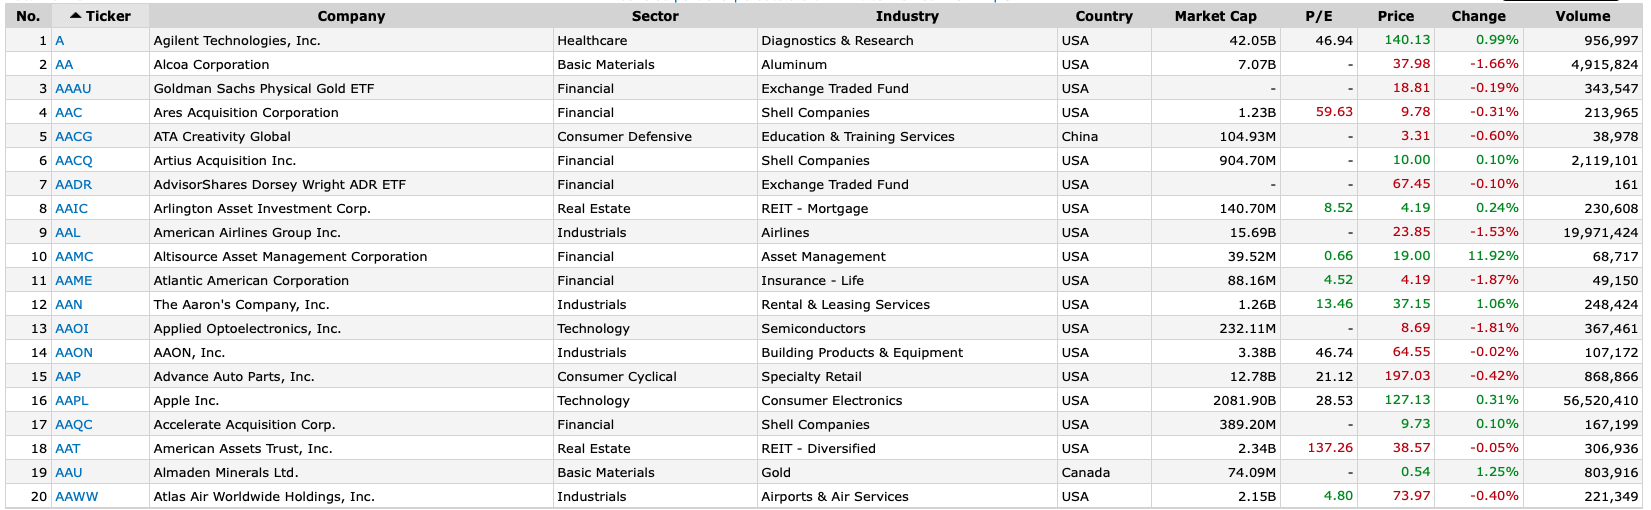
The Screener() has various parameters that can be used to sort, filter, and order the results. One of the interesting one is the filter parameter. The following code from their example, shows companies in NASDAQ which are in the S&P500, gets the performance table, and sorts it by price ascending.
filters = ['exch_nasd', 'idx_sp500']
stock_list = Screener(filters=filters, table='Performance', order='price')
I didn't use any filters for my initial list, because I wanted to get all available tickers. Not passing any arguments accomplishes that. Saved list has tables like sector, industry, country, market cap, p/e, price, price change, volume that can be used later to filter based on what's needed.
Let's see what other interesting information we can get using FinViz API.
import finviz

stock = finviz.get_stock('TSLA')
print(stock)
This will return a long dictionary format data that contains a lot more information about a specific stock ticker, in this case TSLA. The image below is an accurate representation of what is returned. In fact, the code is trying to get all of this data as shown on FinViz website and send back as result.
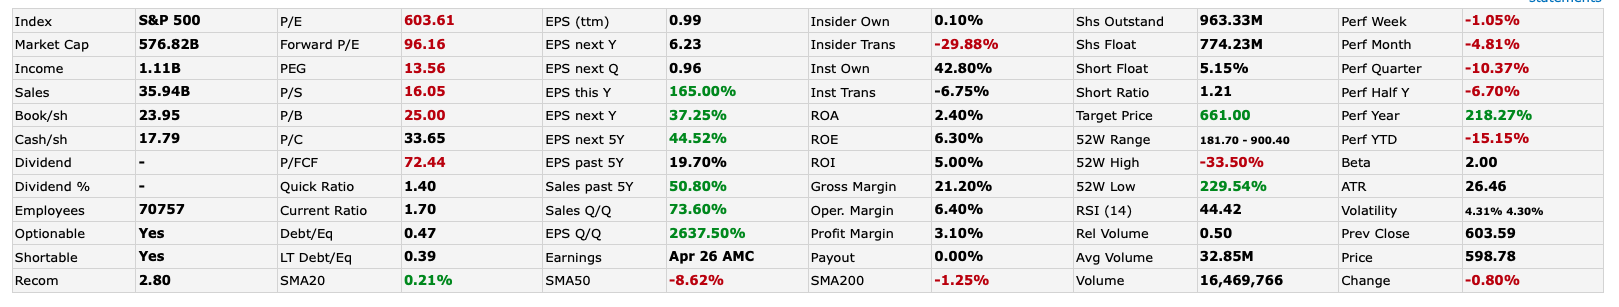
As you can see there is a lot of information listed in the image above. Getting this data programmatically may help us to use only the ones we need and perhaps create our own customized reports. Combined with the data returned with next few functions, we can have our own personal reports on specific stocks.
import finviz

insider = finviz.get_insider('TSLA')
print(insider)

news = finviz.get_news('TSLA')
print(news)

analyst_price_targets = finviz.get_analyst_price_targets('TSLA')
print(analyst_price_targets)
These functions are self-explanatory: get_insider() gets data about insider trades, get_news() gets lists of news articles titles and links for a specific stock ticker, and get_analyst_price_targets gets any information that analysts posted regarding their price targets for the stock ticker.
If we were to use any of these functions or data in our own customized reports or projects, it would also be great to get the charts for the stock tickers we are compiling information about. FinViz API makes that possible as well. Using the following few lines of code, we can download the charts for a list of stocks.
from finviz.screener import Screener

stock_list = Screener(tickers=['TSLA', 'SQ', 'COIN', 'TWTR'])

stock_list.get_charts(period='d', chart_type='c', size='l', ta='1')
The code above creates a folder named charts in users folder and stores charts as .png files.
First we need to create a stock list using Screener() and passing tickers argument with a list of stock tickers. Then by calling .get_charts() methods we saved the charts.
.get_charts() method has four main parameters: period, chart_type, size, and ta. Period is for timeframe and values can be 'd' for daily chart, 'w' for weekly chart, and 'm' for monthly charts. Chart_type can be 'c' for candle type chats or 'l' for lines. Size can be 'm' for small and 'l' for large.
ta stands for technical analysis. The value for ta can be '1' if we want technical analysis on charts like sma50, sma200, trendlines, etc. If we don't need any technical analysis on the saved charts, we can simply give ta value of '0'.
There is more that can be done with FinViz API. It all depends on what you are trying to accomplish. What I would like to do is create daily or weekly custom reports for certain stocks that fit the criteria described in another code. This project can be broken down into following steps:
- Get the list of all available stock ticker symbols.
- Use the list to run in an indicator script to find stocks that match certain criteria that is defined by the indicator. Usually result will be list of 5-6 stock tickers.
- Collect data like chart with ta, news, detailed stock info, insider trading, analyst price targets using FinViz.
- Using all the data collected format the results into report format with markdown and/or html.
- Either store the report in a local machine or publish online for on the go access.
First two steps are already complete with my ticker alert script. Third step is almost complete as well, thanks to FinViz. For example to get the details about the stock, I can get the results from FinViz and also would like to format them as a table, so they can be included in the report. This can be done with the following code:
def get_stock_data_table(ticker):
    stock = finviz.get_stock(ticker)
    stock_table = '<table>'

    for key,value in stock.items():
        row = f"<tr><td>{key}</td><td>{value}</td></tr>"
        stock_table += row

    stock_table += '</table>'
    return stock_table
The result would look like this for $COIN:
| Company | Coinbase Global, Inc. |
| Sector | Technology |
| Industry | Software - Application |
| Country | USA |
| Index | - |
| P/E | 23.50 |
| EPS (ttm) | 9.79 |
| Insider Own | 0.30% |
| Shs Outstand | 209.60M |
| Perf Week | -0.99% |
| Market Cap | 49.12B |
| Forward P/E | 33.20 |
| EPS next Y | -46.97% |
| Insider Trans | -76.51% |
| Shs Float | 152.43M |
| Perf Month | -10.94% |
| Income | 2.28B |
| PEG | - |
| EPS next Q | 1.78 |
| Inst Own | 35.40% |
| Short Float | 2.30% |
| Perf Quarter | -18.03% |
| Sales | 5.93B |
| P/S | 8.29 |
| EPS this Y | 519.50% |
| Inst Trans | 0.50% |
| Short Ratio | 0.65 |
| Perf Half Y | 4.27% |
| Book/sh | 25.57 |
| P/B | 9.00 |
| ROA | 18.50% |
| Target Price | 385.50 |
| Perf Year | - |
| Cash/sh | 29.75 |
| P/C | 7.73 |
| EPS next 5Y | - |
| ROE | 70.30% |
| 52W Range | 208.00 - 429.54 |
| Perf YTD | -8.85% |
| Dividend | - |
| P/FCF | 4.41 |
| EPS past 5Y | - |
| ROI | 33.40% |
| 52W High | -46.45% |
| Beta | - |
| Dividend % | - |
| Quick Ratio | 1.70 |
| Sales past 5Y | - |
| Gross Margin | 86.20% |
| 52W Low | 10.59% |
| ATR | 13.90 |
| Employees | 1249 |
| Current Ratio | 1.70 |
| Sales Q/Q | 315.90% |
| Oper. Margin | 53.00% |
| RSI (14) | 38.05 |
| Volatility | 5.68% 5.03% |
| Optionable | Yes |
| Debt/Eq | 0.63 |
| EPS Q/Q | 293.50% |
| Profit Margin | 39.30% |
| Rel Volume | 0.80 |
| Prev Close | 228.23 |
| Shortable | Yes |
| LT Debt/Eq | 0.63 |
| Earnings | Nov 09 AMC |
| Payout | 0.00% |
| Avg Volume | 5.40M |
| Price | 230.03 |
| Recom | 2.10 |
| SMA20 | -6.67% |
| SMA50 | -19.09% |
| SMA200 | -13.01% |
| Volume | 4,309,452 |
| Change | 0.79% |
Not all of this information is needed. Most of this data will be removed and only the most useful ones will be included in the report. It also depends on personal preferences when it comes to determining which data is more important. Other data will be formatted in a similar way.
Downloading charts for stock tickers is one of best features of FinViz. Charts are stored in a charts folder and files are named based on the stock ticker symbol and date in represented in seconds. Next step is to put all the scripts together and create the final report.
Posted Using LeoFinance Beta
This is the first time I will be hearing of finviz and I believe it will be really helpful when using it.
Finviz will be of great use and help to people. But can it only be used by traders?
Anybody can use it.
Ok... Very well then.
I’m curious to how you got all technical and it surprises me a lot since all this technical post is coming from a lady.
Hehe you are one in a million or maybe billion.
Only a financial technical person would understand most of your post haha 😂
Am not really into stock trade because I need more information about it. With your explanation it means FinViz is one of the best website to learn about stock trading and also best to generate stock ticker. Thanks for sharing. I'll be following the above link to study more about the FinViz.
Stock screeners is an useful tool with which you can list the stocks you have been searching for. FinViz provides a quick analyze for users.
I think registering with Finviz is free.
You don’t need to register to use its basic features.
already forget about finviz, thanks to remembering me about that :P I use most time tradingview and some other screener :P
This post has been manually curated by @bhattg from Indiaunited community. Join us on our Discord Server.
Do you know that you can earn a passive income by delegating your Leo power to @india-leo account? We share 100 % of the curation rewards with the delegators.
Please contribute to the community by upvoting this comment and posts made by @indiaunited.
I don't do stocks but this tool sounds very useful.
finviz looks like a great tool. How long have you been trading? Do you daytrade or longer term? I trade only SPX 0dte, but have just started trading MES also.
I swing trade sometimes. Became a hodler as of late. Used to trade stocks a little bit.
u know, for a long time i thought 'hodl' was just a typo for HOLD. :P