How to stress test your Raspberry Pi

If you read some of my recent posts I have been showing some really pretty charts like this as a result of my testing with the Pi 4.
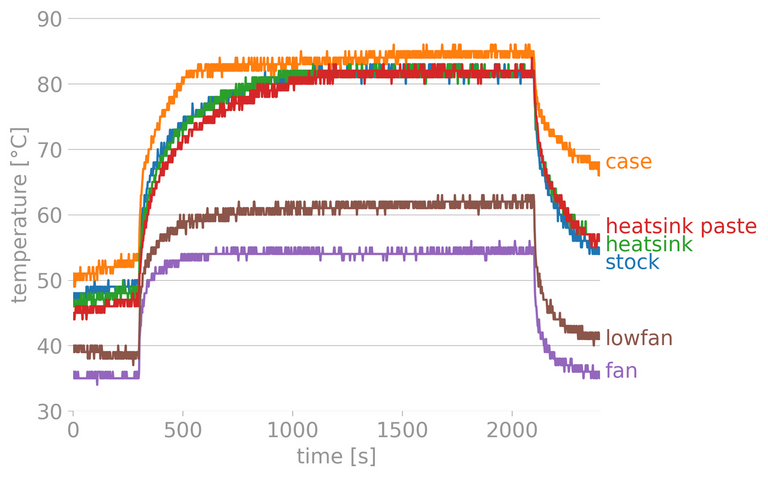
I didn't create these charts myself, I used a utility called Stressberry which is really easy to use and allows you to graph the results of your test. You can even combine the results of your test as I did above.
I'll walk you through the basics of using Stressberry and testing your own Raspberry Pi under different conditions.
How to install Stressberry
Installation is simple but you do need to have Python installed. I recommend Python 3 because I'm so done seeing Python 2 around.
First, install the Linux package *Stress.
sudo apt install stress
Then install the Python package Stressberry
pip install stressberry
That's it!
Using Stressberry
Using Stressberry is a two step process. You first run a stress test that outputs a data file. You then use the plotting tool to create a chart with your results. You can use the results from multiple tests to combine them in a chart like the one you see at the beginning of this post.
In the simplest form, you can run these two commands to stress and plot.
stressberry-run out.dat
MPLBACKEND=Agg stressberry-plot out.dat -o out.png
If you want to plot multiple tests at once, just add them as a plot argument.
MPLBACKEND=Agg stressberry-plot test1.dat test2.out test3.out -o alltests.png
Super easy, but there are a few arguments you might be interested in.
Stress Arguments
Name - -n
I recommend this argument so you can have a label on your chart and keep track of which test is which.
Duration - -d
This option will set how long the test will be run in seconds. I recommend 1800 so you can do a standard 30-minute test.
Idle - -i
This argument sets how long the run idles before and after the test. I recommend 300 (5-minutes).
Cores - -c
This specifies how many cores to use, on the Raspberry Pi you want to set this to 4.
Putting it together
Stressberry will not be in your path so you will need to run /home/pi/.local/bin/stressberry-run
/home/pi/.local/bin/stressberry-run -n "case" -d 1800 -i 300 -c 4 case.out
Plot Arguments
Display Frequency - -f
This will output the frequency of your CPU, this is needed if you want to monitor throttling.
Frequency Limits - -l
Specify the lower and upper limits to plot frequency. I recommend 400 1600 unless you are overclocking, then I would go up to 2200.
Temperature Limits - -t
Specify the lower and upper limits of temperature. I recommend 30 90 for these limits. I don't see a scenario you would want anything else.
Output file - -o
Name of the png file you want to output your chart to.
Disable transparency - --not-transparent
This is optional but I would recommend try with and without to see which you prefer.
Putting it all together
MPLBACKEND=Agg /home/pi/.local/bin/stressberry-plot case.out -f -l 400 1600 -t 30 90 -o case.png --not-transparent
Conclusion
Stressberry is an awesome test kit to try different scenarios with your Raspberry Pi. It is really easy to use and effective.
A typical test I do the following two commands changing the name in the first command to describe my current test.
/home/pi/.local/bin/stressberry-run -n "case" -d 1800 -i 300 -c 4 case.out
MPLBACKEND=Agg /home/pi/.local/bin/stressberry-plot case.out -f -l 400 1600 -t 30 90 -o case.png --not-transparent
I also have a script I use to upload an image to imgur but you can use sftp.
imgur case.png

Congratulations @themarkymark! You received a personal badge!
You can view your badges on your board And compare to others on the Ranking
Support the HiveBuzz project. Vote for our proposal!