Exploratory Data Analysis on HIVE
It was already time to play with Beem, a python library designed to allow developers to easily access HIVE's network without dealing with all the related blockchain technology.

The following shows some Exploratory Data Analysis done using Jupyter Notebooks.
Gathering Data
Let's start by the necessary imports:
from beem import Hive
from beem.discussions import Query, Discussions
from beem.comment import Comment
import pandas as pd
Get queries and discussions:
q = Query(limit=10, tag="")
d = Discussions()
Get the generator containing the posts:
# post list for selected query
iter = 10000000
posts = d.get_discussions('hot', q, limit=iter)
Above you can see that I used a big iteration number, to get a decent Data Frame to work with.
Then I built a dictionary containing only the posts where the Pending Payout Value was bigger than 20 HIVE:
amount = 20
data = [
    {
        'ID': post['post_id'],
        'Author': post['author'],
        'Created': post['created'],
        'Title': post['title'],
        'Category': post['category'],
        'Reputation': post['author_reputation'],
        'Votes': len(post['active_votes']),
        'Body Length': post['body_length'],
        'Tags': post['tags'],
        'Metadata': post['json_metadata'],
        'Pending payout value': post['pending_payout_value'].amount,
        'Community': post['community']} \
    for post in posts if post['pending_payout_value'].amount > amount ]
Then I converted the data into a dictionary, and saved as a .csv.
df = pd.DataFrame.from_dict(data)
df.to_csv('hive_data.csv')
Gathering the data took some time, because of so many iterations.
Analysing the Data
More imports:
import pandas as pd
import seaborn as sns
import plotly as px
import matplotlib.pyplot as plt
import warnings
warnings.filterwarnings('ignore')
Convert the .csv back into a Data Frame and sort by Pending Payout Value.
df = pd.read_csv('hive_data.csv')
df.drop([df.columns[0]], axis = 1, inplace = True)
df = df.sort_values(by=df.columns[-2], ascending=False)
Categories that generate the most value per post
The following results, don't show the categories that generate the most value, only the ones where the posts raised more than 20 HIVE. In addition I'm working with a "small" Dataset, taking into account the history of the blockchain.
I grouped by Category and did a sum of the cells. Then I took the 20 best performing categories.
df_cat = df.groupby(by=['Category'])\
    .sum().sort_values(by=df.columns[-2], ascending=False)
df_cat_best = df_cat.head(20)
A bar plot displaying the results:
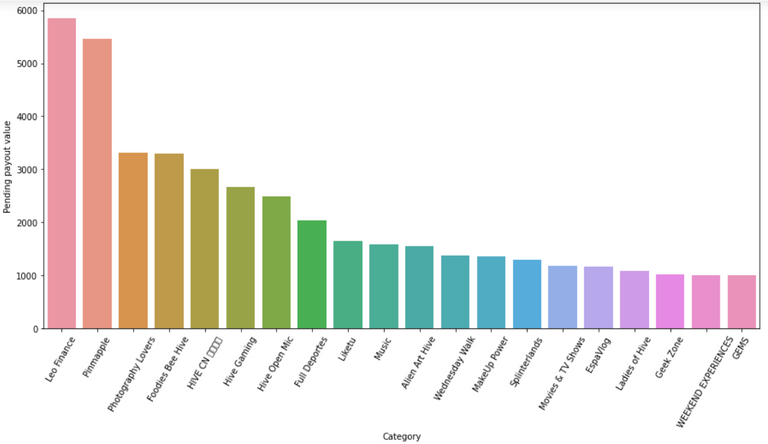
Any surprises?
Leo Finance and Pinmapple, clearly stand out compared to the other categories.
Correlations
Do the features correlate? Number of votes with Pending Payout Value? Reputation?
import ast

df_corr = df[['Reputation', 'Votes', 'Body Length', 'Tags', 'Pending payout value']]
df_corr['Tags'] = df_corr['Tags'].apply(lambda x: ast.literal_eval(x))
df_corr['Number of Tags'] = df_corr['Tags'].apply(lambda x: len(x))
Above, I used the library "ast" to use the function ast.literal_eval(). Because when saving a list in a .csv cell, it is saved as a string instead. This function allows me to convert it back into a list. I also created another feature called "Length of Tags".
Plotting a heatmap:
sns.heatmap(df_corr.corr(), cmap="YlGnBu");
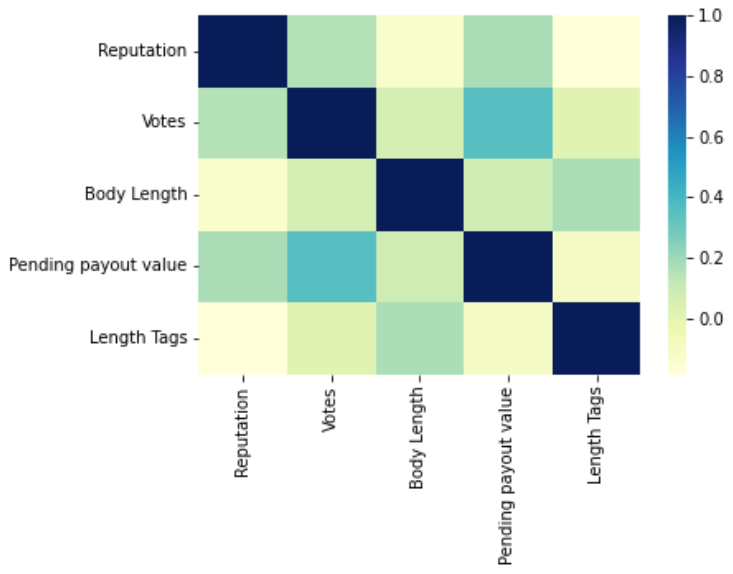
From the heatmap above we can see that there aren't any strong correlation between features. The number of votes it's slightly correlated with the payout value. But reputation, number of tags and body length do not seem to affect the amount of rewards.
What about the tags?
Taking into account the column having the list of tags, it was interesting to see which ones are contributing to the most value. Obviously this is not a proper analysis, because the tags should be in equal value along the sample, to know exactly which ones have the strongest influence, which is not the case.
df_temp_tags = df_corr.explode('Tags')\
    .drop(['Length Tags', 'Reputation', 'Body Length'], axis=1)
df_temp_tags['Tag Counts'] = df_temp_tags['Tags'].apply(lambda x: 1)
df_tags = df_temp_tags.groupby('Tags')\
    .sum().sort_values(by='Pending payout value', ascending=False)
df_tags
Above, I "exploded" the list of tags inside the lists and then I counted them.
With the new features, I did a new heatmap:
sns.heatmap(df_tags.corr(), cmap="YlGnBu");
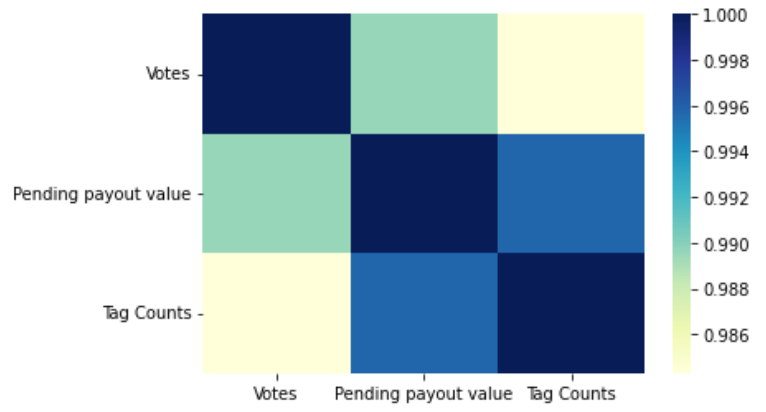
As expected, the "Tag Counts" is correlated with the Pending Payout Value, once again this doesn't mean that the tags with the most counts are the most effective, it can mean that most of the posts use the same tag. Let's still see a bar plot of the best performing tags in this analysis:
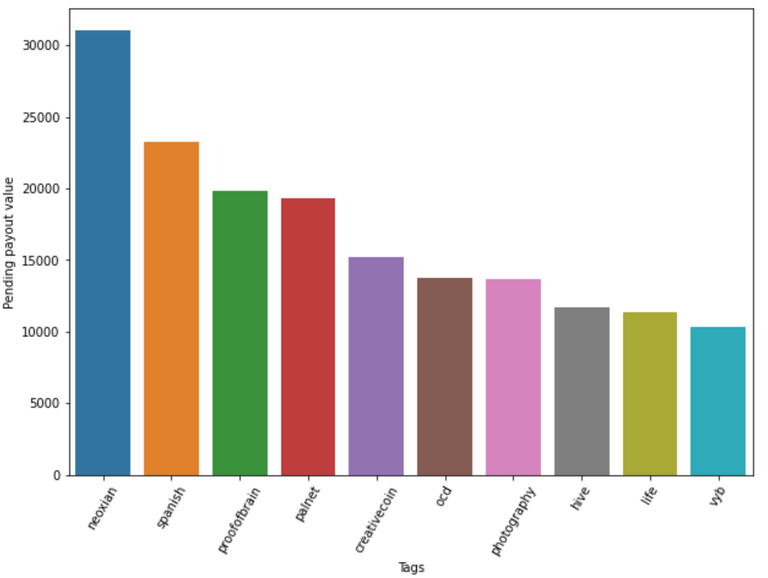
The "neoxian" tag seems to be the best performing between all. Might be using it for this post, along with "proofofbrain" 😁
Expect more content on Exploratory Data Analysis using Beem, I'm not done yet with this library. See you soon!
Thanks for your contribution to the STEMsocial community. Feel free to join us on discord to get to know the rest of us!
Please consider delegating to the @stemsocial account (85% of the curation rewards are returned).
You may also include @stemsocial as a beneficiary of the rewards of this post to get a stronger support.
https://twitter.com/HiveTrending/status/1564625098748809217
The rewards earned on this comment will go directly to the people( @hivetrending ) sharing the post on Twitter as long as they are registered with @poshtoken. Sign up at https://hiveposh.com.
Congratulations @macrodrigues! You have completed the following achievement on the Hive blockchain and have been rewarded with new badge(s):
Your next target is to reach 1750 upvotes.
You can view your badges on your board and compare yourself to others in the Ranking
If you no longer want to receive notifications, reply to this comment with the word
STOPCheck out the last post from @hivebuzz:
Support the HiveBuzz project. Vote for our proposal!
Wonderful post! Have a !PIZZA
I gifted $PIZZA slices here:
@cryptothesis(3/15) tipped @macrodrigues (x1)
Please vote for pizza.witness!