Sum Of Two Mario Party Dice In Excel & R
Hi there. In this post, I cover probabilities from the sum of two Mario Party dice. I use Microsoft Excel and R software in computing probabilities from the ten-sided Mario Party dice.
From a gameplay perspective, computing probabilities of two dice can help with decision making when moving your character on the Mario Party Board. Some sums are more likely than others. You can find out if there is a good chance of rolling a twelve or higher in order to get a star.
This post is a preview of a bigger post that is coming up on Mario Party, dice and math.

Using R For The Sum Of Two Mario Party Dice
R programming can be used for dealing with probabilities for the sum of two Mario Party Dice. Start with library(dplyr) to load the dplyr package for data wrangling and manipulation similar to pandas from Python.
I start with initializing the Mario Party Dice. The seq(1, 10) function will output the numbers 1, 2, 3, to 10 and I save this to the variable mp_dice.
Using expand.grid(mp_dice, mp_dice) will have all possible arrangements for the two ten sided dice. You will have 1 and 1, 1 and 2, all the way to 10 and 10. I turn this into a table with the use of data.frame().
##### Mario Party Two Dice:

# Ten sided die in Mario Party
mp_dice <- seq(1, 10)

# Combination of dice

two_mp_dice <- data.frame(expand.grid(mp_dice, mp_dice))
In the next lines of code, I add a sum column for the two dice values. With the use of the table() function in R, a frequency table can be produced to display frequencies for each sum from 2 to 20.
two_mp_dice$Sum <- two_mp_dice$Var1 + two_mp_dice$Var2

# Compute probabilities for sum of two MP dice:
mp_sumDice <- data.frame(table(two_mp_dice$Sum))

# Show occurrences:
mp_sumDice
> mp_sumDice
   Var1 Freq
1     2    1
2     3    2
3     4    3
4     5    4
5     6    5
6     7    6
7     8    7
8     9    8
9    10    9
10   11   10
11   12    9
12   13    8
13   14    7
14   15    6
15   16    5
16   17    4
17   18    3
18   19    2
19   20    1
In the next lines, I obtain probabilities based on the frequencies for the sum of two Mario Party dice. Another column is made which contains cumulative probabilities.
# Change Var1 Column:
colnames(mp_sumDice) <- c('Sum_TwoDice', 'Frequency')

# Create probability column: Frequency / #combinations (36)
mp_sumDice$Chance_Percent <- round(mp_sumDice$Frequency / 100, 3)

# Cumulative Probability (Running Total)
# Probability of getting the sum of that number or lower.
mp_sumDice$cumulativeProb <- cumsum(mp_sumDice$Chance_Percent)

# Show occurrences:
mp_sumDice
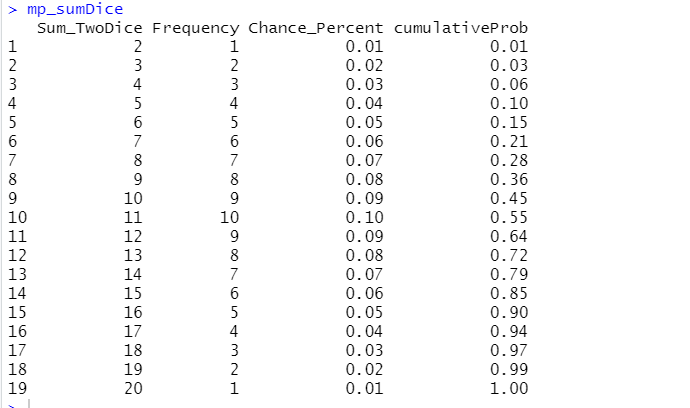
The most likely sum of two dice is 11 with a frequency of 10 and a probability of 10%.
Consider the cumulative probability example for the sum of 9 from two dice. The cumulative probability is 36% which represents the chance of rolling a 9 or less on two mario Party dice.
For the sum of 16 the cumulative probability is 90%. There is a 90% chance that you roll a 16 or lower with the double dice in Mario Party Superstars. Also there is a 10% chance of rolling higher than 16.
Microsoft Excel For The Sum Of Two Mario Party Dice
As much I like R, Excel is much more accessible to a larger audience. You can see things a little bit better in Excel versus R.
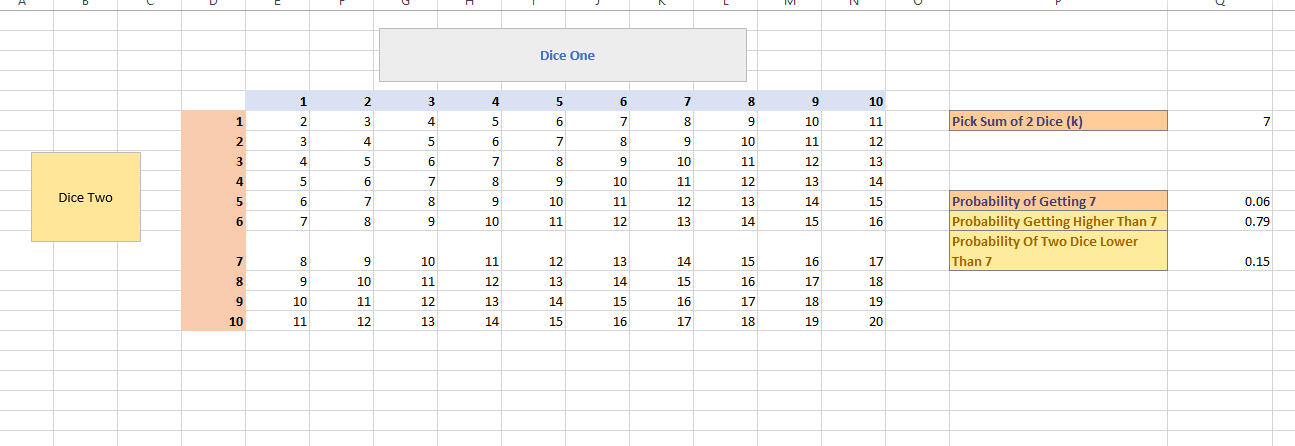
In the screenshot below, I showcase my setup for finding the sum of two Mario Party dice. There is a two way table with the sum values based on all possible dice values. On the right sight side I have a user input for the sum of two dice, the probability of obtaining that sum, the probability or rolling higher than the sum and the probability of the two dice lower than the user amount.
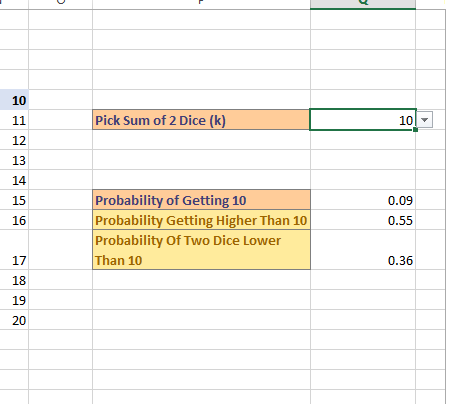
The second screenshot shows the user input of 10 for the sum of two dice. This user input is actually a drop down menu. This drop down has sum values from 2 to 20. Having the drop down menu prevents users from entering values outside of 2 to 20.
Obtaining the probability of the user inputted sum is not too difficult. I use =COUNTIF() to count the instances from the two way table that have the inputted sum divided by the number of sums in the table (which is 100). The Excel formula here is =COUNTIF(E6:N15,$Q$6)/COUNT(E6:N15). The sum values is in the table E6:N15. The user input value is from cell Q6.
The probability of two Mario Party dice being higher than the user inputted sum is obtained with COUNTIF() again. This formula is =COUNTIF(E6:N15, ">" & $Q$6) /100. It is important to have ">" & $Q$6 to get the greater than operator to work. For less than use "<" & $Q$6.
Some Insightful Results
With this Excel setup, it is easier to extract some key results that can help with decision making in Mario Party. A lot of decisions in the game are probabilistic in nature.
With double dice, there is a 79% chance of rolling higher than 7. Compare this with a single die where there is a 30% chance of rolling higher than 7. If you want rolling at least a seven this is the probability of getting 7 which is 6% plus the 79% which is 85%. Use the double dice for an increased likelihood of moving many spaces or avoid spots near the character.
The probability of rolling higher than 10 with double dice is 55%. This is better than a fair coin flip.
This is not shown on a screenshot but rolling a 15 or higher on a double dice is a 21% chance.

Posted with STEMGeeks