Plotting Linear Equations
Hi there. In this mathematics post, I would like to cover the topic of plotting linear equations. When I was younger this topic is introduced in grade nine high school mathematics. Other places may cover this before grade nine.
Math text rendered with LaTeX with QuickLaTeX.com, graphing screenshots from the Symbolab and Desmos websites.

Topics
- Reviewing Patterning
- The Equation Of A Line
- Slope As Rise Over Run
- Plotting Points On A Line
- Application Questions Examples
Reviewing Patterning
From early mathematics, you may have been asked to continue number patterns from something like this:
2, 5, 8, 11, 14, __, __, __
You can easily see that the next number goes up by 3. The next numbers after 14 would be 17, 20 and 23.
Around middle school and before high school you may see more structure in how the above pattern is displayed. A table like the one below would be shown perhaps.
| Term Number | Number |
|---|---|
| 1 | 2 |
| 2 | 5 |
| 3 | 8 |
| 4 | 11 |
| 5 | 14 |
| 6 | 17 |
| 7 | 20 |
| 8 | 23 |
The Equation Of A Line
In order to find the equation of a line from the table above, the table needs to be adjusted to include an independent variable such as x.
| Value of x | Number (y) |
|---|---|
| 0 | 2 |
| 1 | 5 |
| 2 | 8 |
| 3 | 11 |
| 4 | 14 |
| 5 | 17 |
| 6 | 20 |
| 7 | 23 |
For every increase by 1 for x, the number y increases by 3. Also for every decrease by 1 for x, the number y decreases by 3. This number 3 can be referred to as a first difference. More importantly, this number 3 is the slope for the equation of the line corresponding to the above table. The above table can be modified to include negative numbers for x.
| Value of x | Number (y) |
|---|---|
| -3 | -7 |
| -2 | -4 |
| -1 | -1 |
| 0 | 2 |
| 1 | 5 |
| 2 | 8 |
| 3 | 11 |
| 4 | 14 |
| 5 | 17 |
| 6 | 20 |
| 7 | 23 |
When x is equal to 0, the value of y is 2. The number 2 here is called the y-intercept.
From the above table, the equation of the line is y = 3x + 2.
The General Equation Of A Line
Given a slope m and a y-interecept b, the equation of the line is given by:

The dependent variable y depends on the value x given the values of the slope and the y-intercept.
When the y-intercept is 0, the equation of the line becomes just y = mx.

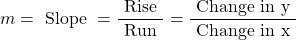
Slope As Rise Over Run
From the table of values, slope is referred to as the difference between the y-values when x is increased by 1. For graphing purposes, slope can be viewed as the change between two y-values divided by the change between the two x-values that correspond to the y-values. This slope is the ratio of the rise over the run.
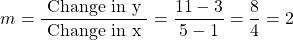
Computing The Slope Between Two Points Example
Given two (x, y) co-ordinates, you can find the slope of a line that goes through the two points. This is done with the slope formula as listed above.
Consider the two points (1, 3) and (5, 11), the slope calculation for the line that goes through these two points is shown below.
Plotting Points On A Line
Given the equation of the line of the form y = mx + b, you can plot points on the line. There are two ways that I know of for plotting.
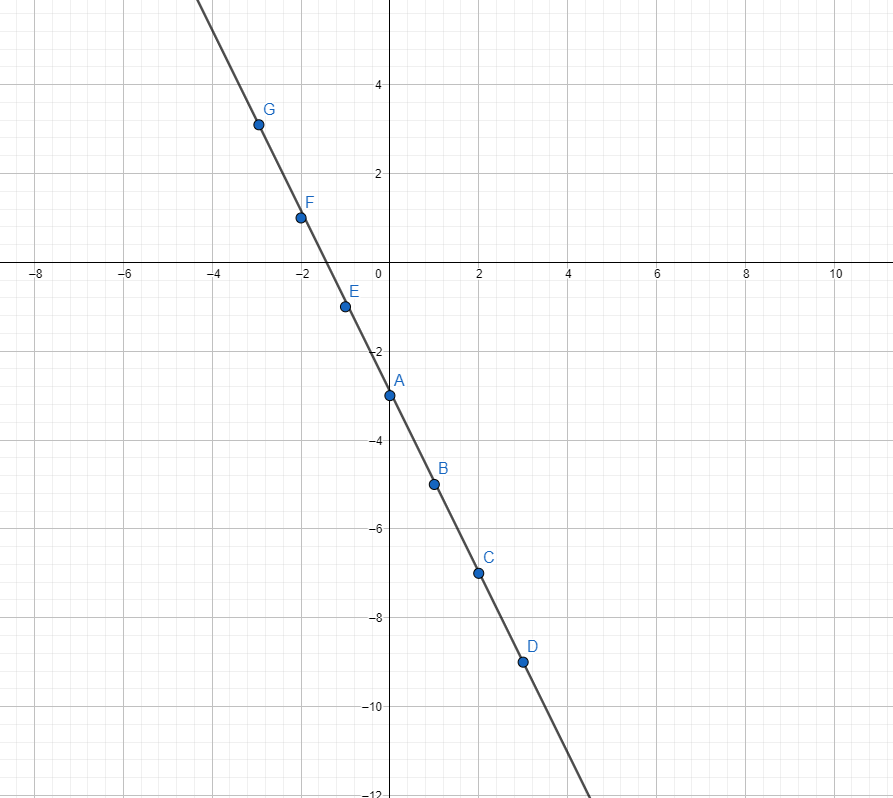
For this section, consider the linear equation of y = -2x - 3. This line has a slope of -2 and a y-intercept of -3.
Method One - Table Of Values Approach
This first method involves using a table of values. I like to use about five to seven values for x with their corresponding values for y. A natural question would be what kind of values can I use for x? Using simple values such as -3, -2, -1, 0, 1, 2, 3 are safe choices unless you are dealing with strange equations.
| Value of x | Value of y | (x, y) Co-Ordinate |
|---|---|---|
| -3 | 3 | (-3, 3) |
| -2 | 1 | (-2, 1) |
| -1 | -1 | (-1, -1) |
| 0 | -3 | (0, -3) |
| 1 | -5 | (1, -5) |
| 2 | -7 | (2, -7) |
| 3 | -9 | (3, -9) |
The co-ordinates can be plotted on graphing paper on with plotting software. Once five or so points are plotted, you can easily see that the points are laid out in a line. The line can be graphed on top of the points.
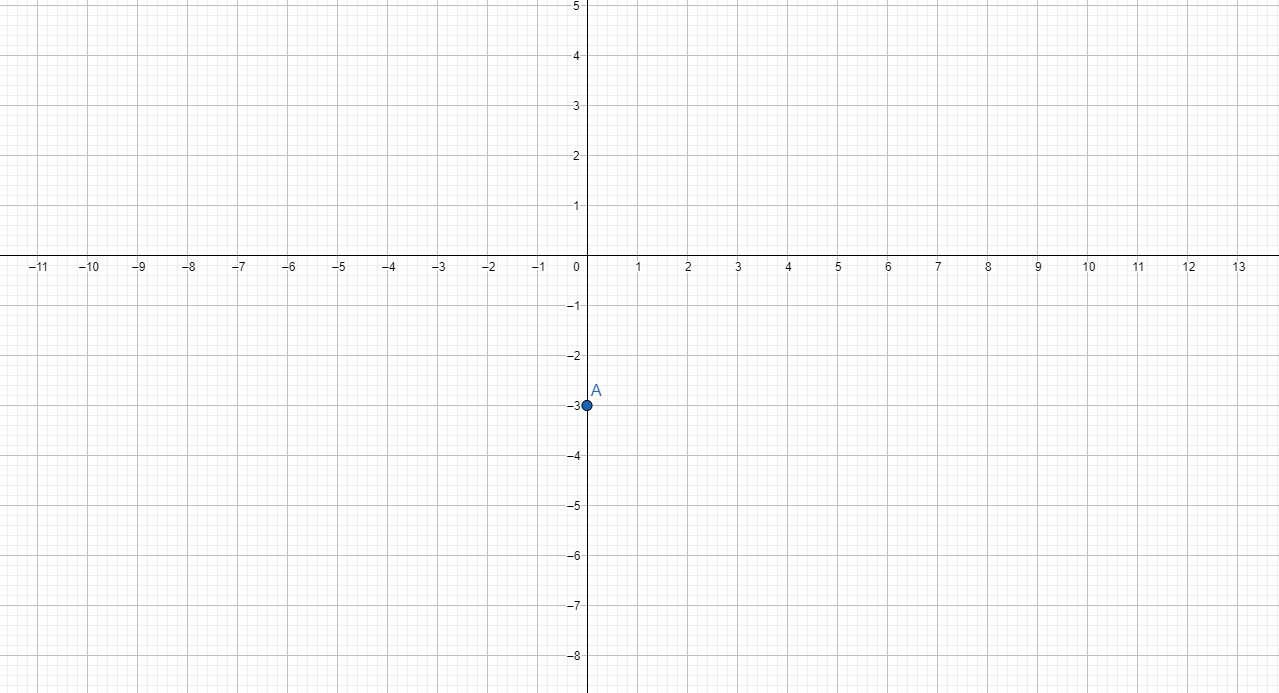
Method Two - Plot The Y-Intercept First From The Equation
The table of values approach is simple and easy to follow. However, it can be time consuming for some. A faster way to plot a line given the linear equation y = mx + b is to plot the y-intercept point first. Once the y-intercept point is plotted, the slope can be used to plot the next points.
From y = -2x - 3, the y-intercept is (0, -3). Plot this point first and then apply the slope of negative 2 to obtain the next points.
An increase of 1 for x corresponds to a decrease of 2 in the y-coordinate. This point would be (1, -5). The next points moving from left to right area (2, -7), (3, -9).
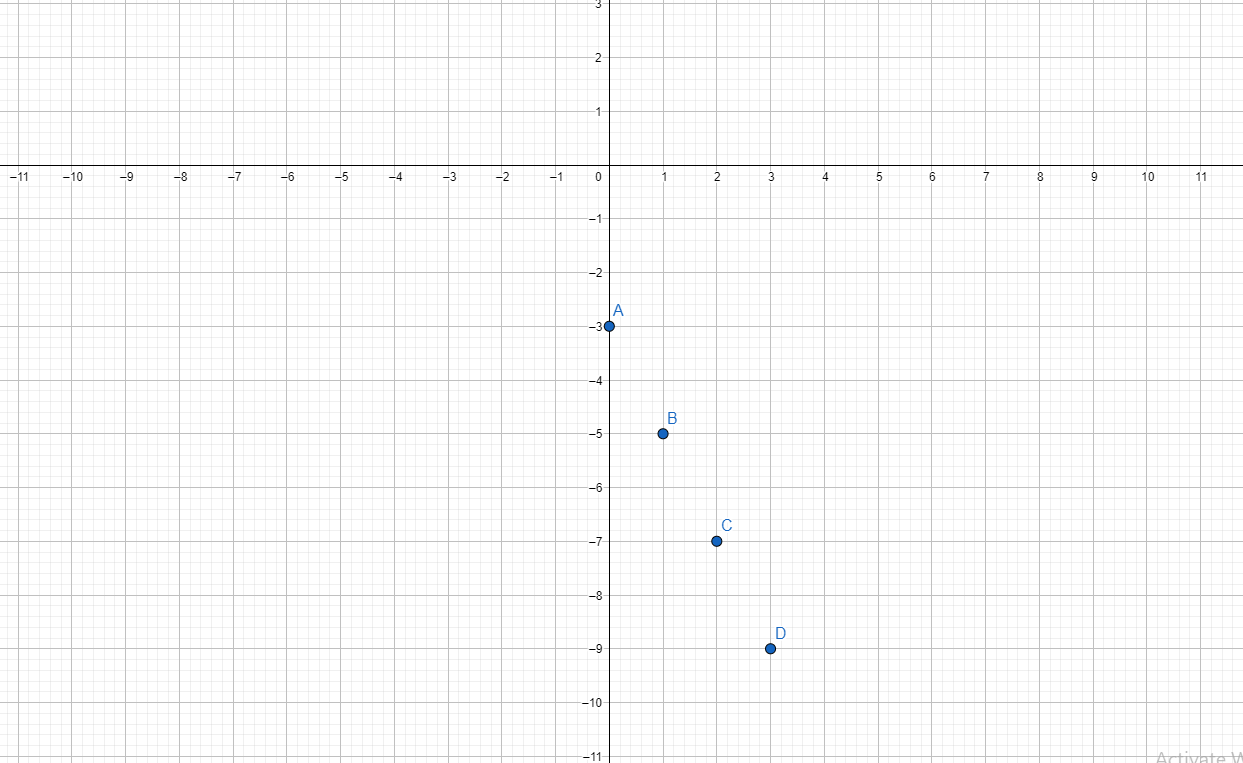
The slope can be applied in the opposite direction. A slope of -2 means that for every increase of 1 for x, the y-coordinate decreases by 2. If x decreases by 1, the y-coordinate goes up by 2. The points on the left of (0, -3) are (-1, -1), (-2, 1) and (-3, 3). At this point you can see the points laid out in a linear fashion. A line can be drawn through the plotted points.
Application Questions Examples
When it comes to linear equations and applications, I think of mostly pricing plans from membership services and phone plans. The examples here will be based on monthly plans and their pricing plan.
Phone Plan Example
Phone prices in Canada are expensive. It is because we have Bell, Telus and Rogers as a cartel and Freedom Mobile as a big 4th provider. There is a lack of competition in the mobility market here.
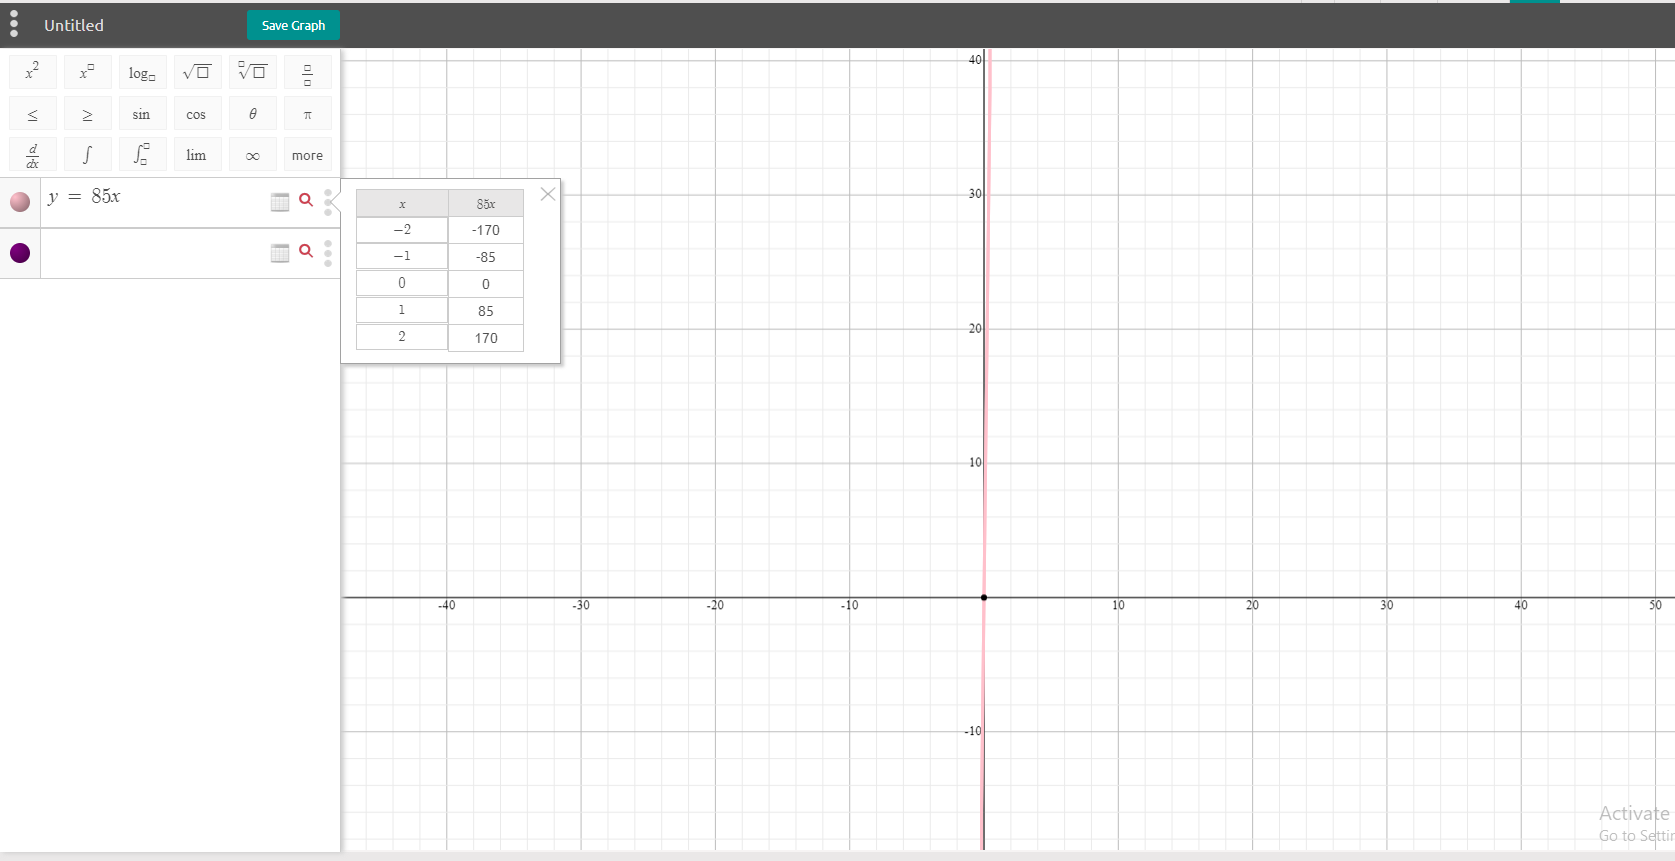
The Bell.ca website has some strange pricing plans and conditions when it comes to pricing with their phones. For this example, I will do a linear equation based on the Unlimited $85 a month phone plan in the middle of the screenshot. I assume a zero y-intercept but in real life you would need to add one if you are buying a phone outright. (A lot of phone plans in Canada have reduced prices on the device itself but you pay more per month.)

We have the linear equation as:

where C is the total amount of expenses for the phone plan after n months, n is the number of months and the number 85 is the cost of the phone plan per month (without overage fees)
Here is a sample table of values.
| Number of Months (n) | Amount Paid After n Months ($CAD) |
|---|---|
| 0 | 0 |
| 1 | 85 |
| 2 | 170 |
| 3 | 255 |
| 4 | 340 |
| 5 | 425 |
| 6 | 510 |
The screenshot graph (Symbolab) for this does not look great but here it is. The slope of 85 is quite steep which makes the red line nearly vertical. I was not able to find a way to limit the domain to exclude nonnegative values for n.
VPN Subscription
Lately, I have been kind of looking at VPN subscriptions and shopping around. I am looking at ExpressVPN, NordVPN, ProtonVPN and Surfshark. For this example, I am looking at Surfshark. A screenshot of Surfshark's prices in Canadian dollars is provided below.

- One month of Surfshark is $16.34 on a monthly basis.
- A six month plan costs $49.15 which comes to $8.19 per month. (Billed every 6 months)
- The 2 year plan costs $75.43 which comes to $3.14 per month.
Here is a table of values for the cost when paying on a month to month basis.
| Number of Months (n) | Amount Paid After n Months ($CAD) |
|---|---|
| 0 | 0 |
| 1 | 16.34 |
| 2 | 32.68 |
| 3 | 49.02 |
| 4 | 65.36 |
| 5 | 81.70 |
| 6 | 98.04 |
In the Desmos screenshot graph below, I have included points based from the table of values. I have also included two horizontal lines representing the cost of the 6 month plan at $49.15 and the cost of the 2 year plan at $75.43.
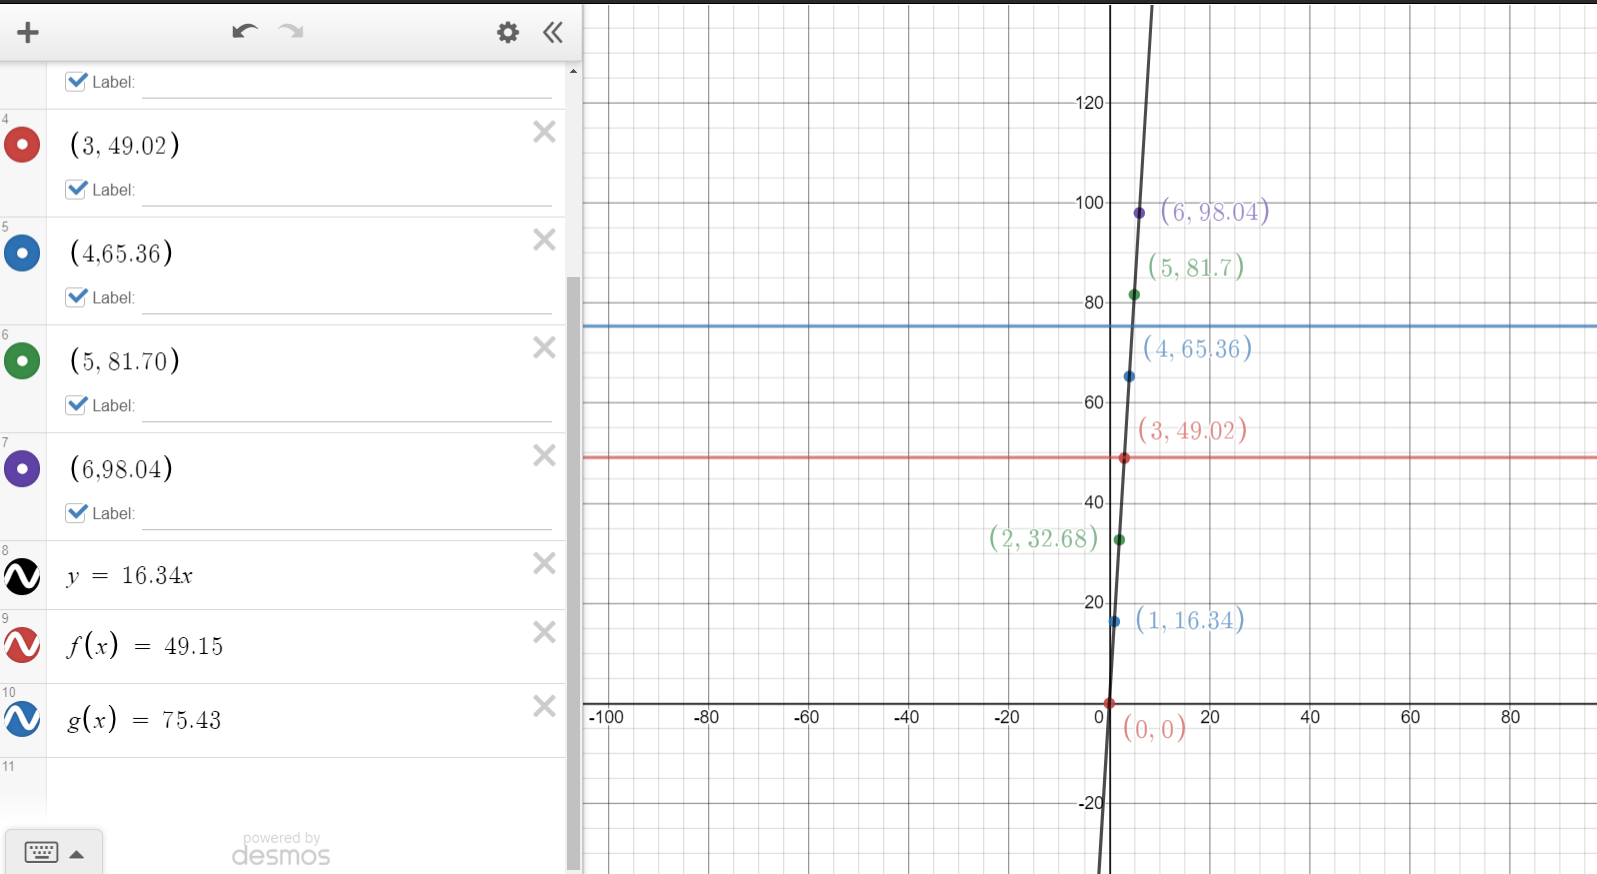
Although the topic of points of intersection and decision making is another math topic, I have included here for this application example.
A six month plan at $49.15 provides more value if you plan to use this VPN service for 3 months or more.
Instead of paying $16.34 a month on a month to month basis for 5 months which comes to $81.70, why not consider the Surfshark two year plan at $75.43. Get more while paying less.
In summary, you save more money in the long run when you are on a longer term plan. Doing one month of Surfshark can be okay if you want try out the VPN before thinking about paying more for a longer term plan.
Posted with STEMGeeks