Plotting Coordinates On A Grid
Hi there. In this education post, I cover the topic of plotting coordinates on a grid. This topic can be taught to students from grade six to eight. It can also be taught to younger students in grade three to five which would be a bit ambitious.
Screenshots of the plotted points are on Desmos.
Topics
- Points In The Positive (x,y) Quadrant
- Points With The Full Grid
- Summary
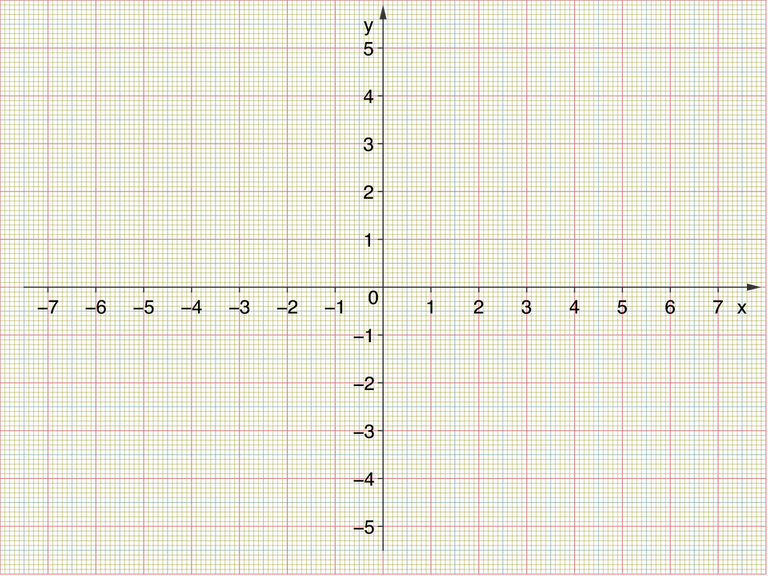
Points In The Positive (x,y) Quadrant
Instead of going right into the full quadrant, I start with the positive x and positive y quadrant. The point (x, y) refers to a single point on the Cartesian co-ordinate grid. The value of x refers to the horizontal (left to right) position on the grid while the value of y is for the vertical position on the grid.
Origin Point
One of the most important points is the origin. The origin has a point of (0, 0). This point is the intersection of the horizontal x-axis and the vertical y-axis.
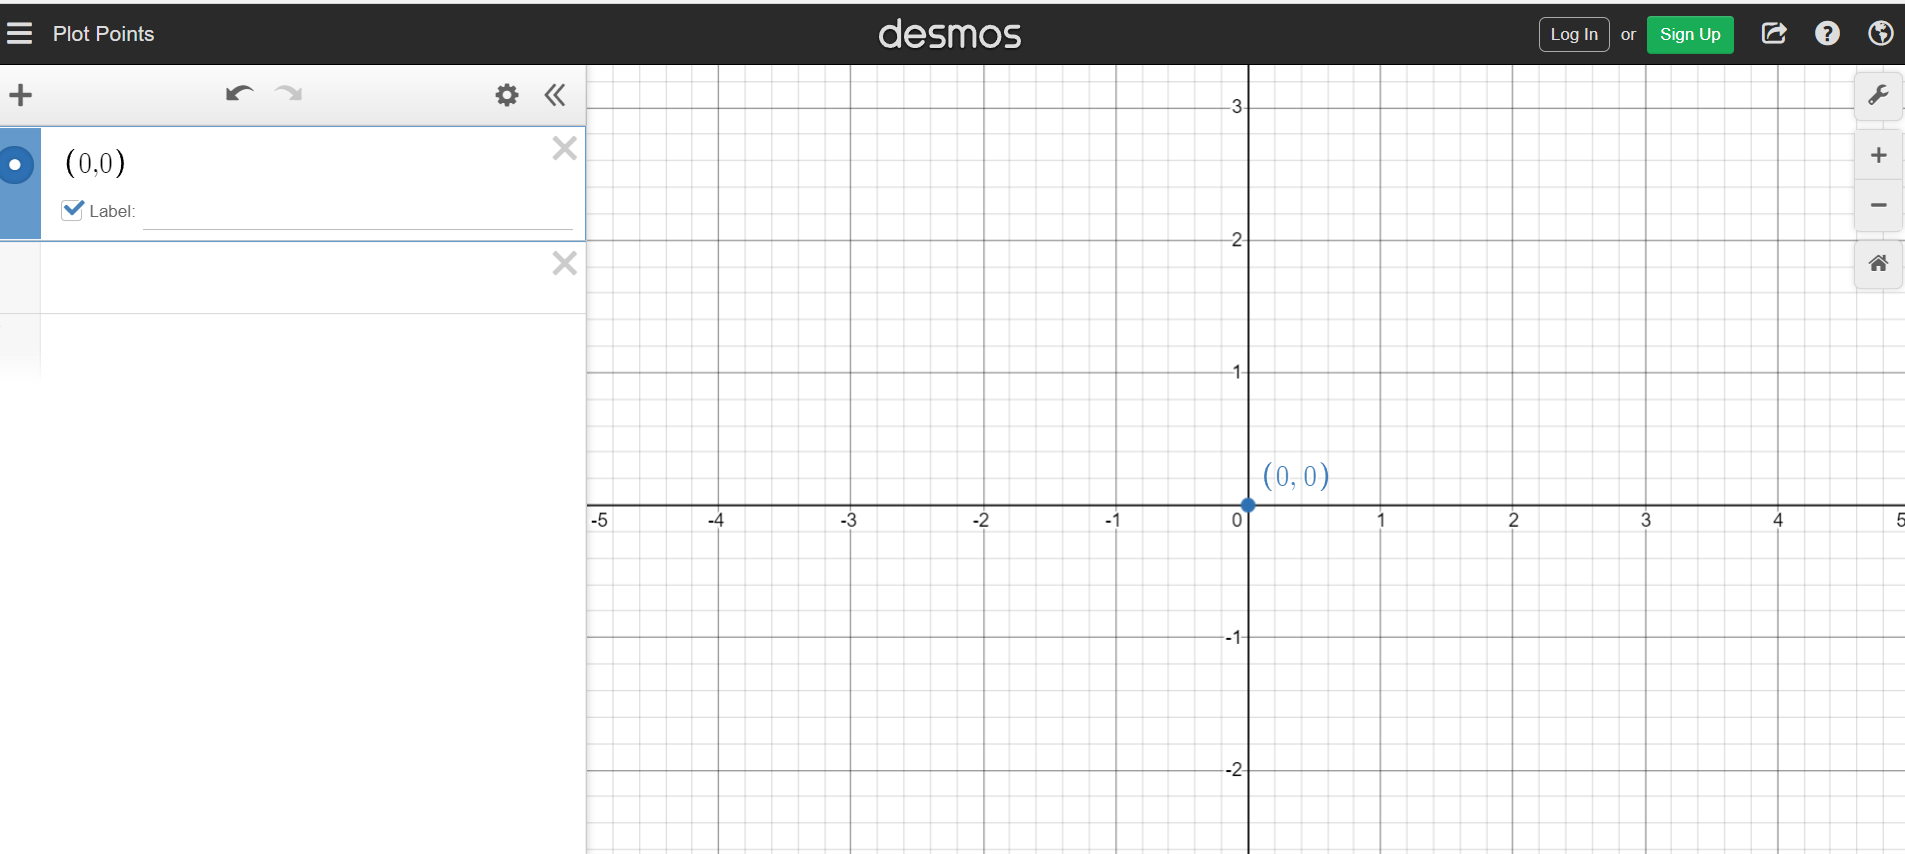
Example One
Mark the point (3, 0) on the grid.
Start from the origin point (0, 0). The first value is a three which means three units to the right from the origin.
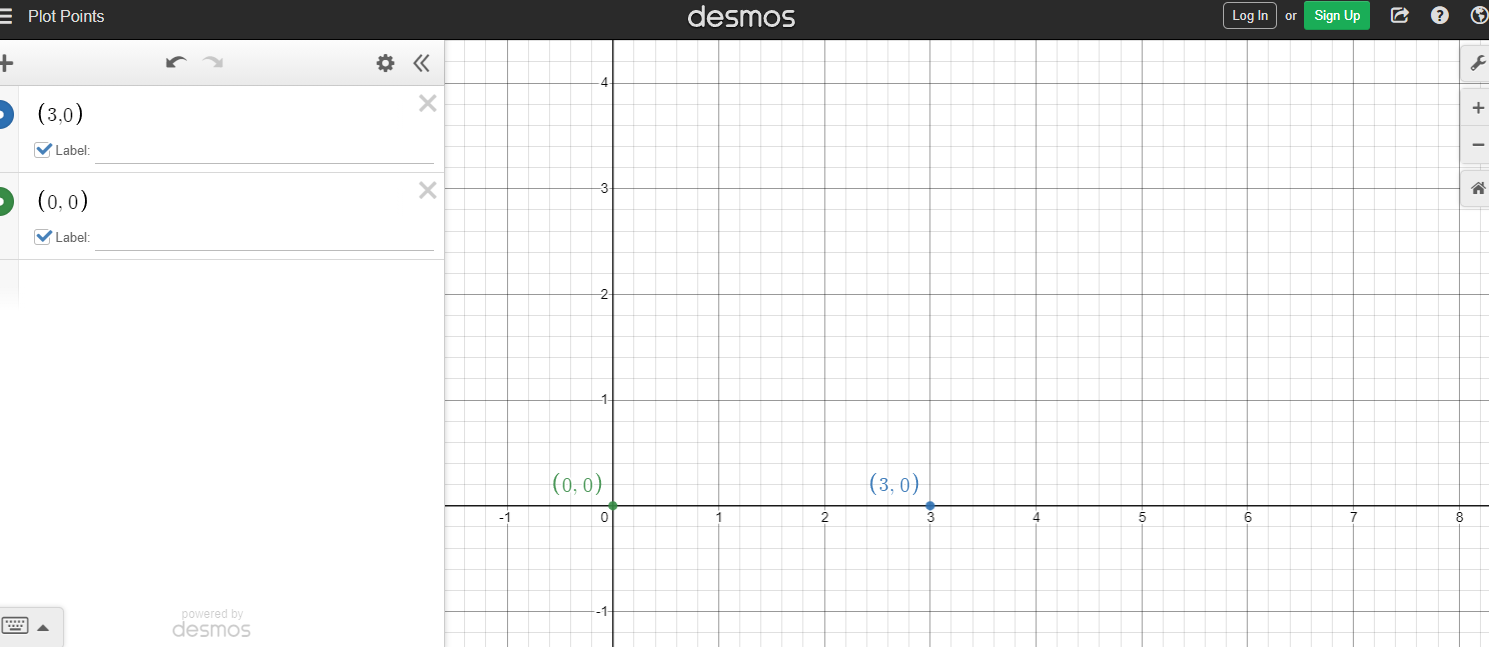
Example Two
Plot the point (0, 7).
From the origin, do not move any units left or right. The seven from the y-value in (0, 7) means to move up 7 units up.
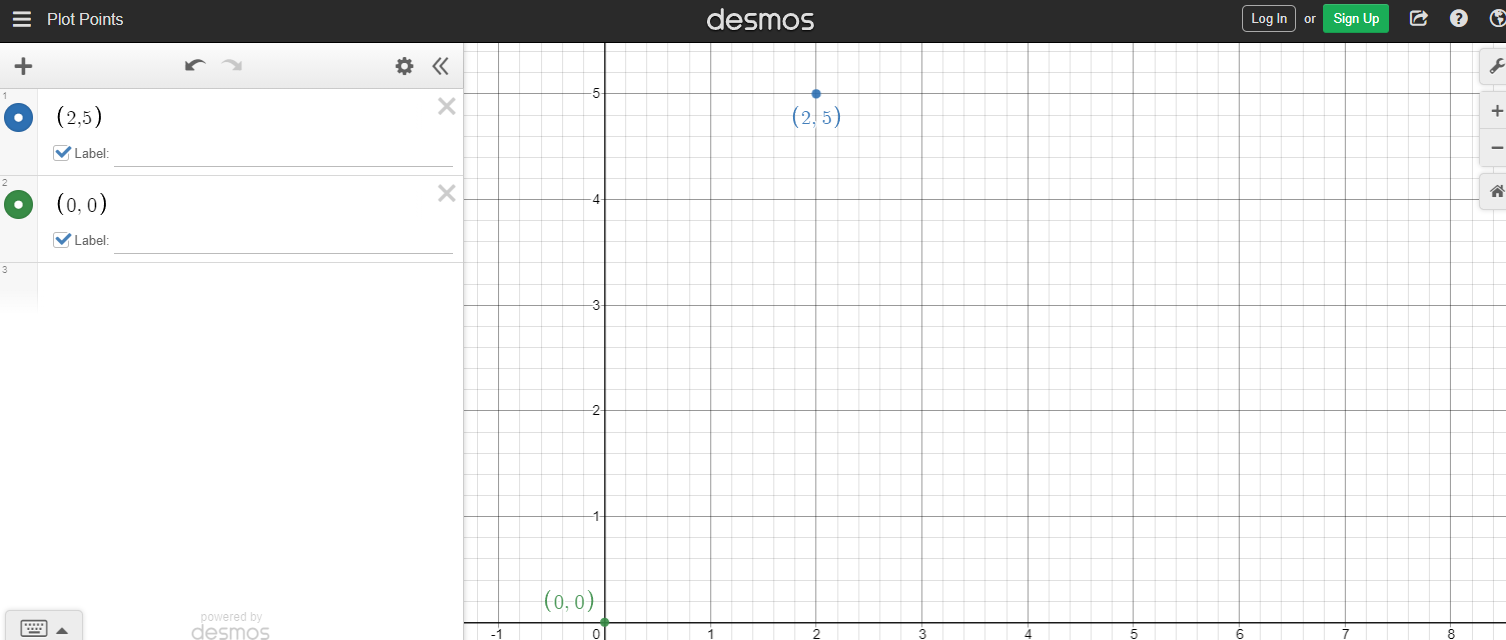
Example Three
Plot the point (2, 5) on the grid.
With this case, move 2 units right and five units up from the origin (0, 0). You can also do the other order where you move up 5 units and move 2 units right.
Points With The Full Grid
The points so far dealt with positive numbers for x and y. The inclusion of negative numbers gives the full grid. In the full grid we have four quadrants.
- Top right is positive x, positive y
- Top left is negative x, positive y
- Bottom left is negative x, negative y
- Bottom right is positive x, negative y.
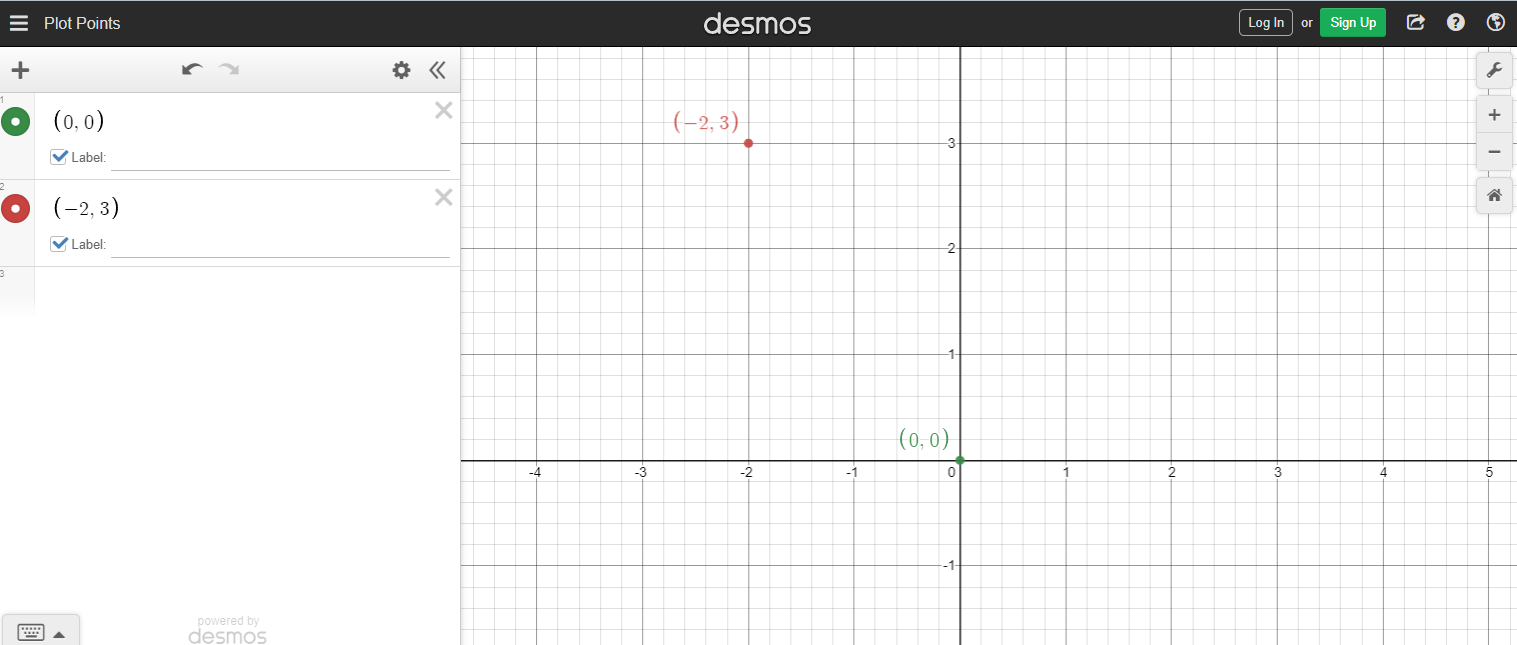
Example One
On the full grid, plot (-2, 3).
The x-value in (-2, 3) is -2. Negative two for x means move two units left from the origin. For vertical movement, a y-value of 3 means move up 3 units.
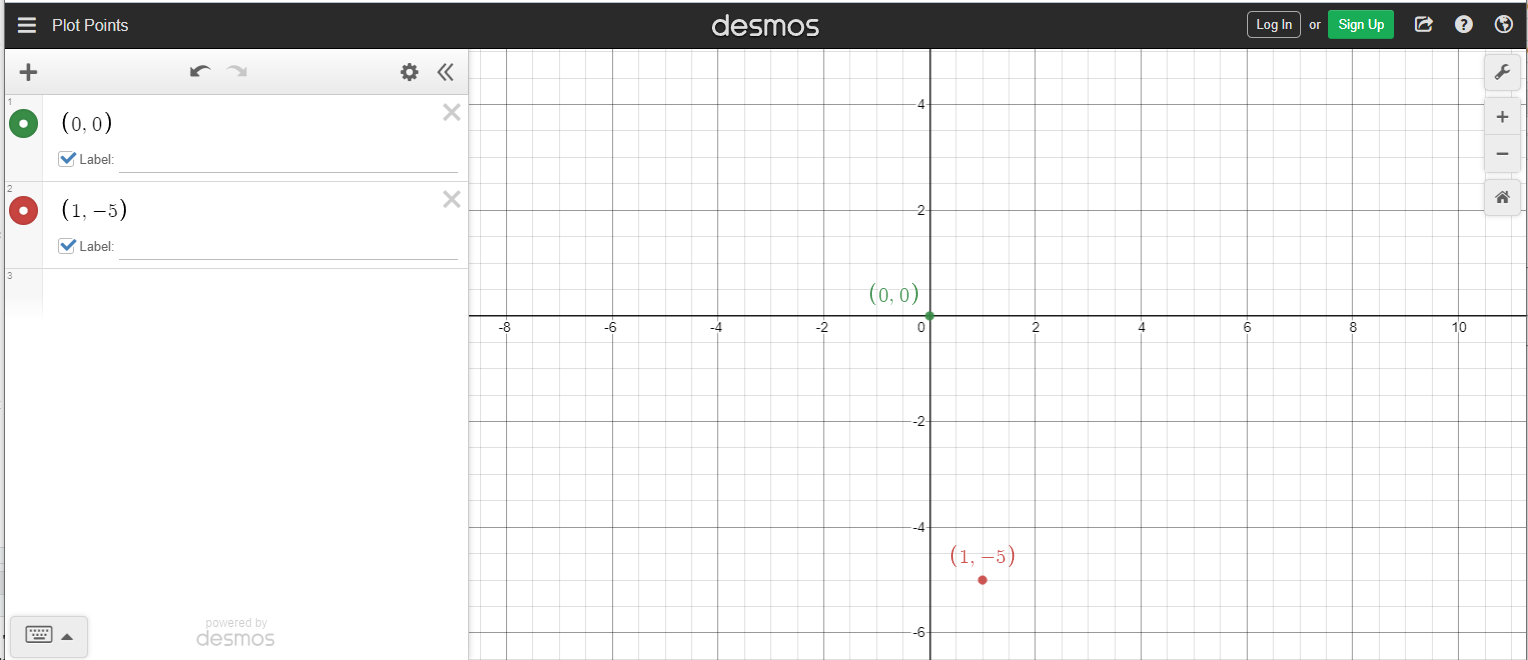
Example Two
Plot (1, -5) on the full grid.
With (1, -5), move one unit to the right from the origin (0, 0). Afterwards move down 5 units to obtain the point (1, -5).
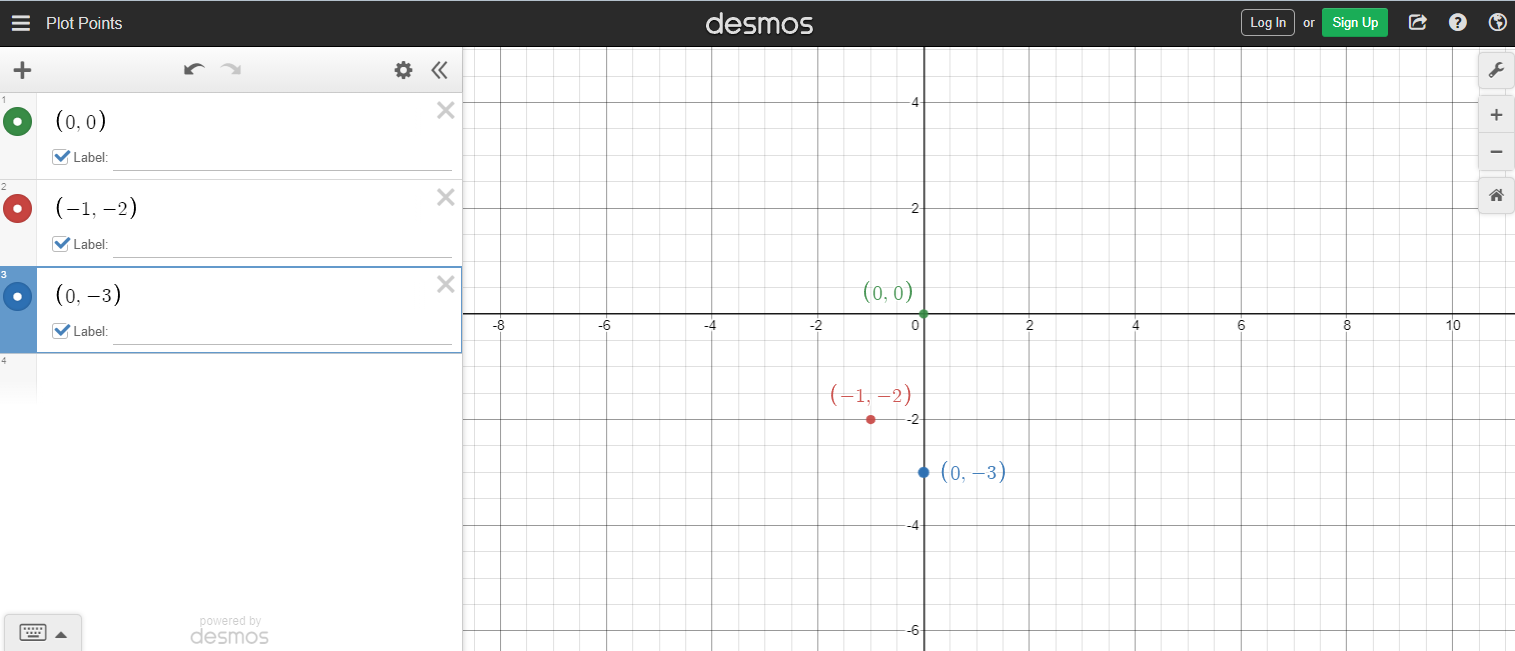
Example Three
With the full grid, plot the points (-1, -2) and (0, -3).
The second point of (0, -3) is not too hard to plot. It is no left or right movement and down 3 units. For the (-1, -2), move left 1 unit from the origin and then down 2 units.
Summary
- Positive x means go right.
- Negative x means go left
- Positive y is up.
- Negative y is down.
- Zero for x means no movement left or right.
- Zero for y means no movement up or down.

Posted with STEMGeeks
I remember plotting with graphing paper.
Same here. With graphing paper, lined paper and blank paper (worst case).