Linear Equations From Table of Values
Hi everyone. In this post, I cover the math topic of determining linear equations from a table of values. As long a table of values meets some conditions we can determine a linear function that passes these points.

Topics
- What Is A Linear Function?
- Determining Linear Functions From A Table Of Values
What Is A Linear Function?
A linear function is a function where the inputs correspond in such a way where the rate of increase or decrease stays the same every time the input value increases by one. The general form of the linear function is:

where
- x is the independent variable or input
- m is the slope or the rate of increase/decrease for every 1 unit increase in x
- y is the output from x given a slope m
Example One
One apple costs 50 cents. Two apples would cost 100 cents. For every 1 apple increase the cost for the apples goes up by 50 cents. Let n be the number of apples. The cost for the apples (A) would be A = 0.5 x n.
Example Two
Consider a second example. A taxi fare has a cost for going into the cab and a variable cost that depends on the number of kilometres traveled. I am using price data from numbeo.com for Toronto. Getting in a taxi costs $4.25 CAD and it costs $2.00 CAD for every kilometre traveled.
Let y be the cost of taxi trip and let x be the number of kilometres travelled. The linear function for this Toronto taxi fare case would be:
The 4.25 CAD amount is called the y-intercept. It is the y-value when x = 0. In this case, $4.25 CAD would be the entry cost or base fee of the taxi ride. Each kilometre travelled costs $2 each on top of the $4.25 initial cost.

Determining Linear Functions From A Table Of Values
What if all you have are a table of values? From the table of values, you would need to determine the slope and the y-intercept to obtain a corresponding linear function.
Here are a few examples. These two examples are not too difficult (I think).
Example One
Given a table of values, what is the equation of the line that passes these points?
| x | y |
|---|---|
| -2 | -11 |
| -1 | -6 |
| 0 | -1 |
| 1 | 4 |
| 2 | 9 |
For every 1 unit increase for x, the value of y increases by 5. The rate of change or slope is 5. This five is the slope or the value for m.
With the equation of a line, we have:

The y-intercept can be quickly determined from the table of values. It is the value for y when x = 0. Negative one would be the y-intercept.
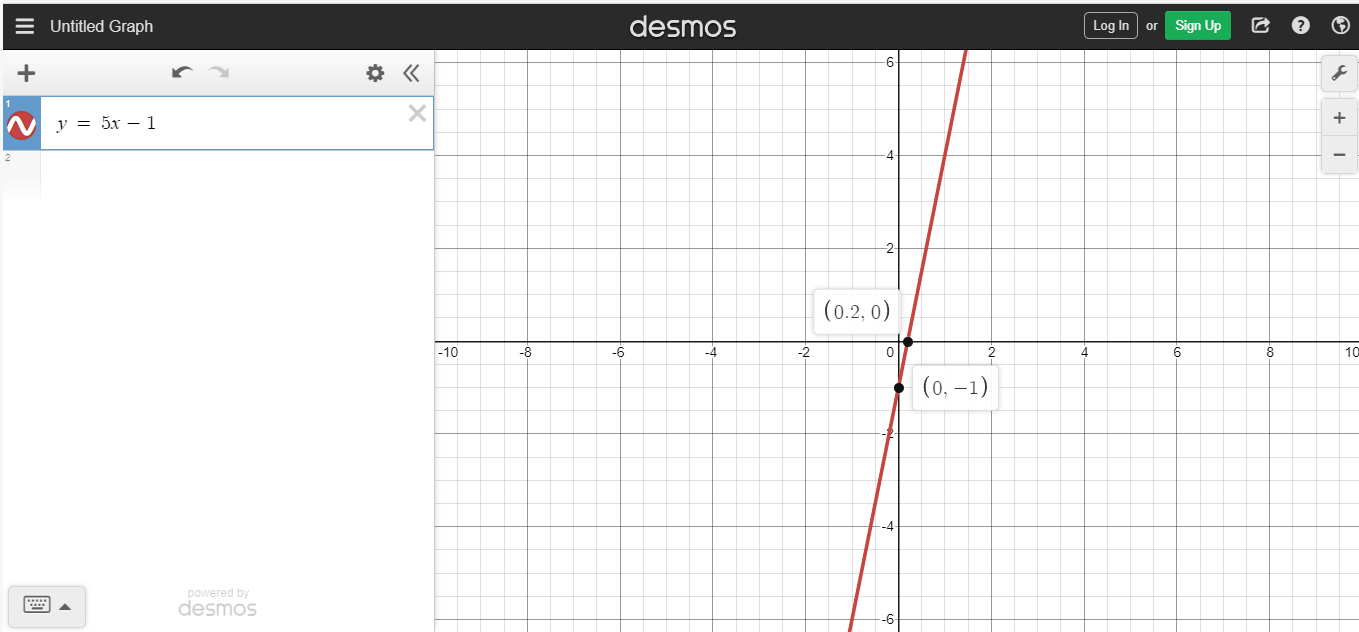
For this example, the equation of the line is y = 5x -1. A graph of this line would look something like this Desmos screenshot.
Example Two
Determine the equation of the line that passes these 3 points given in the table below.
| x | y |
|---|---|
| 1 | 40 |
| 2 | 30 |
| 3 | 20 |
From the table, a one unit increase for x corresponds to a decrease of 10 for y. The slope here for the equation of a line is just negative ten.
So far we have:
The value of the y-intercept b needs to be determined. Select an (x, y) point from table of values, substitute accordingly for x and y and then solve for b. I choose (1, 40) as my (x, y) point.
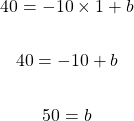
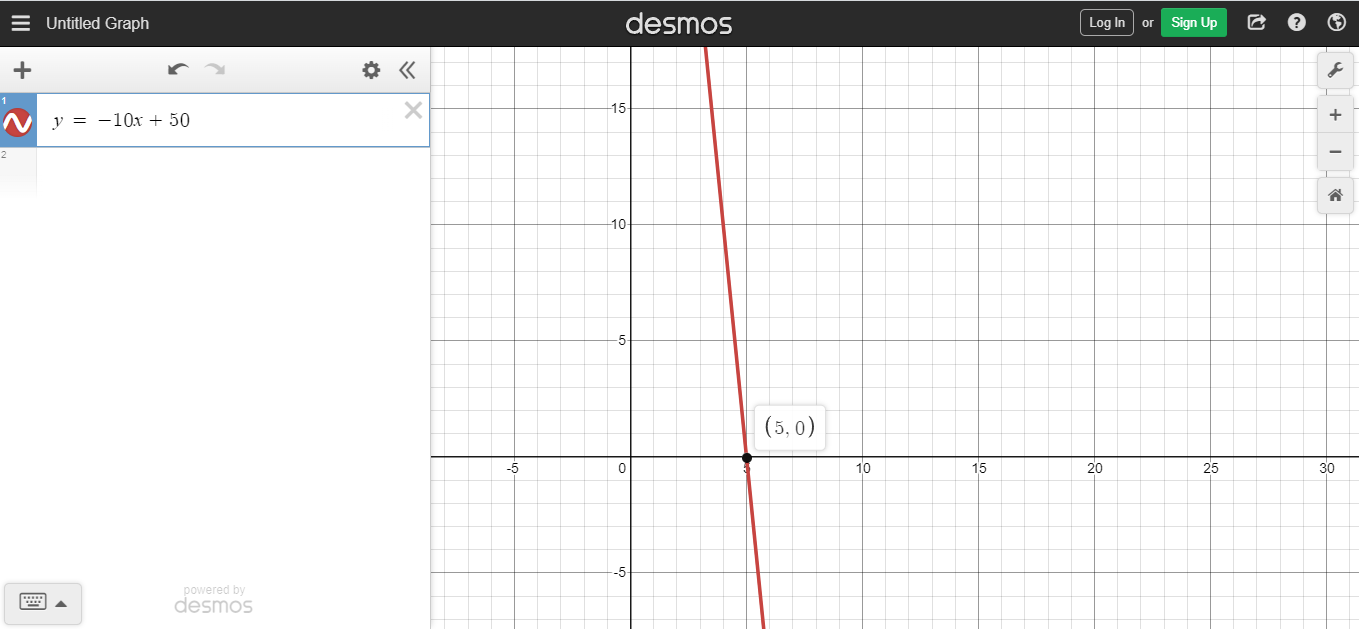
With the value of b being 50 and a slope of -10, the equation of the line that passes through the 3 points from the table is y = -10x + 50.
Posted with STEMGeeks