First Python Streamlit Dashboard - Crypto Fear & Greed Index
Hi there. In this Python programming post, I showcase my first Streamlit dashboard. This dashboard features the crypto fear and greed index.
Here is the dashboard.

Topics
- Streamlit For Data Dashboards
- Crypto Fear & Greed Index
- A Look At The Crypto Fear & Greed Index Dashboard
- Obtaining Crypto Fear & Greed Data
- Code For Sidebar Settings
- Code For The Price Plot
Streamlit For Data Dashboards
Streamlit is a package in the Python programming language that allows users to create dashboards. Many of the dashboards involve some sort of data in the form of data analysis, machine learning applications and data visualization. You could use Streamlit as a website, as a form or as a math flashcards website.
Streamlit has a gallery to showcase what can be done with Streamlit.
I wanted to recreate the crypto fear and greed index from alternative.me and add a few interactive elements to this dashboard.

Crypto Fear & Greed Index
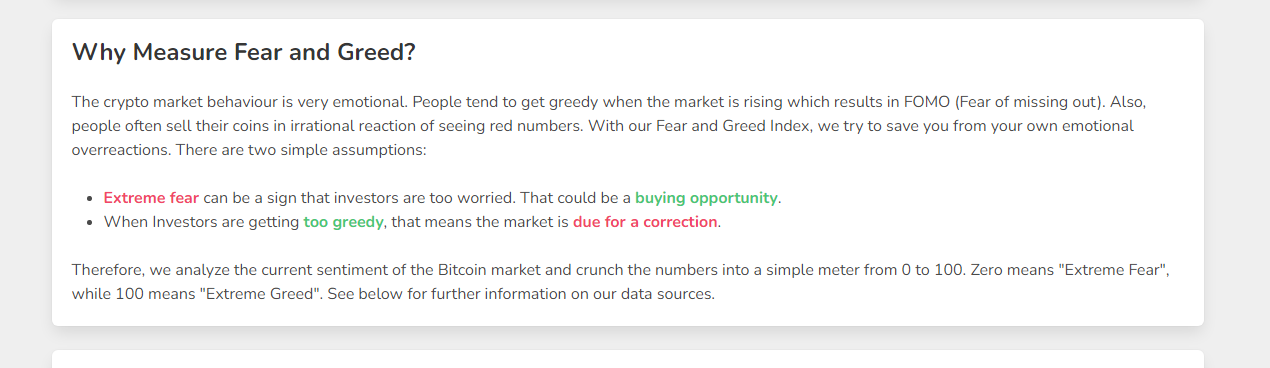
As there are people in the crypto market behaviours in this market is emotional. The crypto fear and greed index is a tool to gauge (or estimate) to sentiment of those in the crypto market. Screenshot below from https://alternative.me/crypto/fear-and-greed-index/.
A Look At The Crypto Fear & Greed Index Dashboard
This simple crypto fear & greed index dashboard has a side bar on the left side along with a main viewing area. Refer to the two screenshots below.
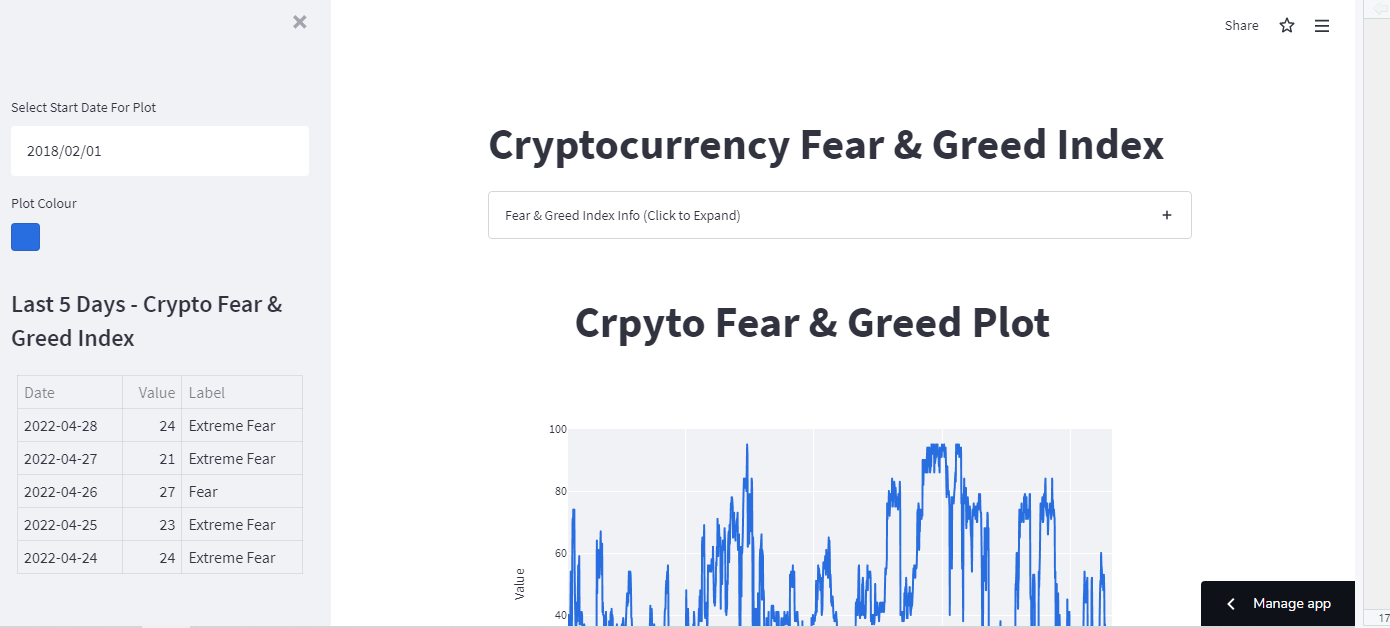
Sidebar
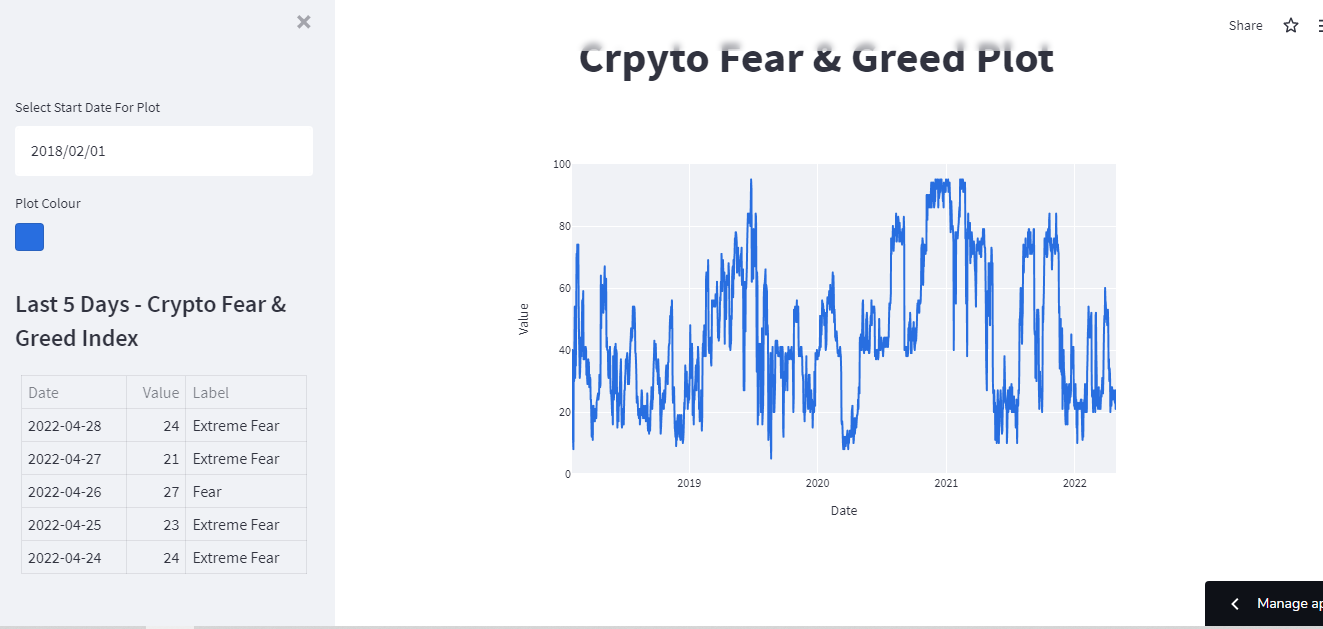
The first thing in the sidebar is a date picker. With the crypto fear & greed plot, I show all the index values from all the available dates by default. Sometimes you do not need all the dates. The date picker allows for the user to choose a more recent date which would shorten the time window.
Setting the date to January 1, 2022 gives this plot.
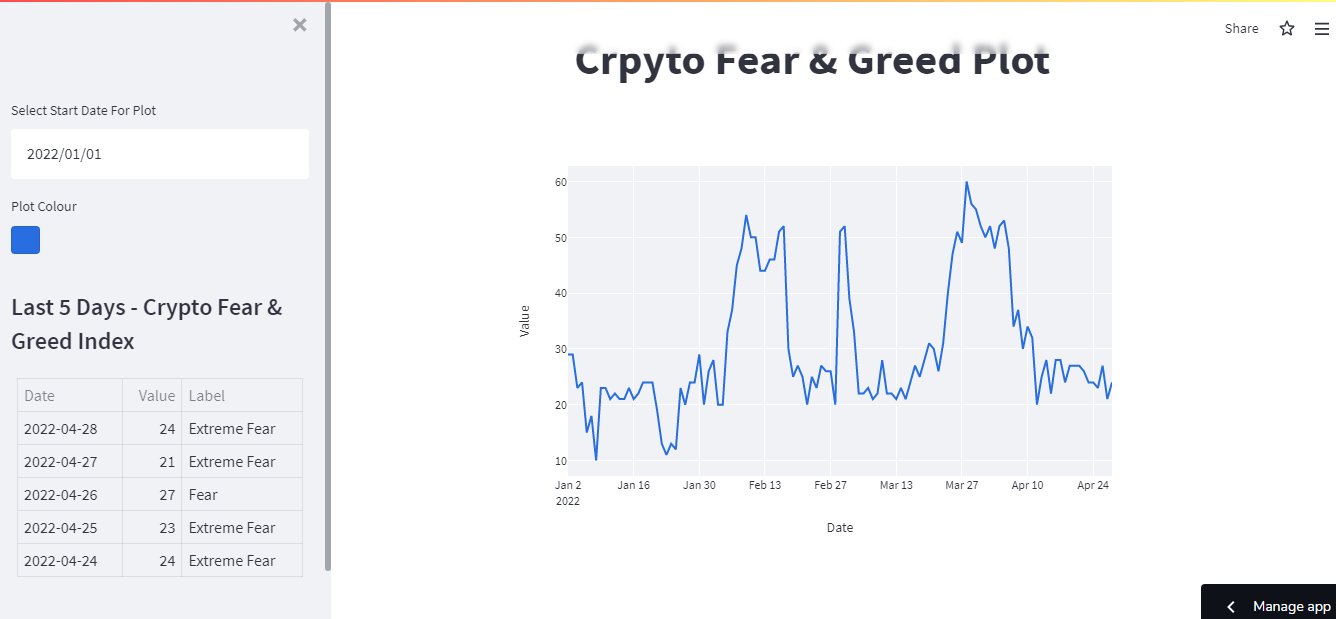
A date that is set past today (I write this on April 27, 2022) would give an error.
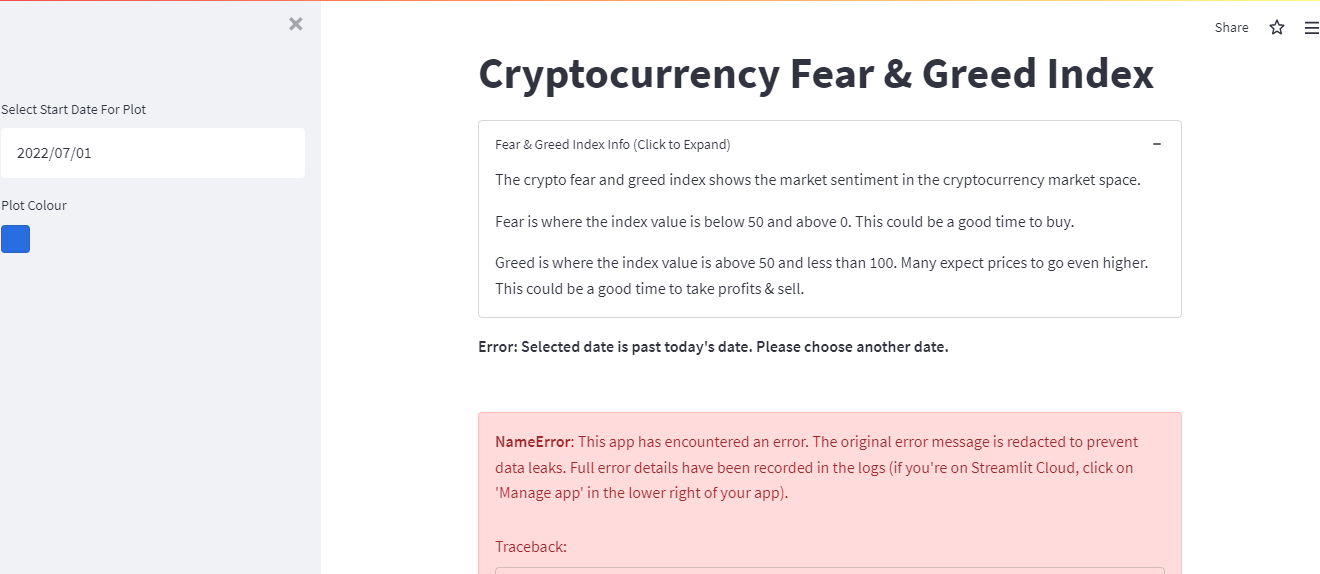
For the second item, I included a plot colour picker. The default colour is blue but the user can change the colour to any colour through selection by mouse clicking or with a colour hex code.
Main Area
With the main area, I kept it quite simple. There is the title, an expansion box for information about the dashboard and the crypto fear & greed index line plot.
In Streamlit you can show text on the page with the use of st.write("text here"). I include the import packages code chunk where I import the necessary packages for this dashboard.
import requests
import pandas as pd
import streamlit as st
import datetime
import plotly.express as px

st.write("""
# Cryptocurrency Fear & Greed Index
""")
For the expansion box I use this code chunk:
with st.expander("Fear & Greed Index Info (Click to Expand)"):
     st.write("""
         The crypto fear and greed index shows the market sentiment in the cryptocurrency market space.

         Fear is where the index value is below 50 and above 0. This could be a good time to buy.

         Greed is where the index value is above 50 and less than 100. Many expect prices to go even higher. This could be a good time to take profits & sell.

     """)
Obtaining Crypto Fear & Greed Data
From the alternative.me website, they do have a section near the bottom of the page for using their API. The requests package from Python is used for obtaining the latest crypto fear & greed index data.
# Url for Crypto Fear & Greed Index:
url = "https://api.alternative.me/fng/?limit=0"

# Making a get request
response = requests.get(url)
The imported data comes in as a .json file. This can be converted into a pandas dataframe.
#### Dataframe & data cleaning items:
# Crypto fear and greed data into a dataframe:
fg_crypto_df = pd.DataFrame(response.json()['data'])
The next lines of code consists of changing data types and renaming columns.
# Change timestamp values into dates:
fg_crypto_df['timestamp'] = pd.to_datetime(fg_crypto_df['timestamp'], unit="s")

# Change column names:
fg_crypto_df.columns = ['Value', 'Label', 'Date', 'Time Until Update']

# Change value into a numeric column:
fg_crypto_df['Value'] = pd.to_numeric(fg_crypto_df['Value'])

Code For Sidebar Settings
Including a date picker is not difficult as it requires one line of code. Include .sidebar after st to ensure that the element shows up on the sidebar instead of the main page.
An if-else statement is used as a filter for the dataframe. If the selected date is past today's current date an error appears on the main page.
## Date choice on sidebar
date = st.sidebar.date_input('Select Start Date For Plot', datetime.date(2018,2,1))

# Today's date:
today_date = date.today()

# Filter by date choice
if date > date.today():
    st.write("**Error: Selected date is past today's date. Please choose another date.**")
else:
    df = fg_crypto_df[fg_crypto_df.Date > date.strftime("%Y-%m-%d")]
I use st.sidebar.color_picker(label = "Plot Colour", value = "#286EE0") to include a color picker for the line plot. The label is Plot Colour with a default colour in colour hex code format.
Below the colour picker I include the 5 most recent crypto fear & greed index values. This is mainly done with the use of pandas .head(). Each index value goes for a different day.
side_df = df.copy()

side_df['Date'] = pd.to_datetime(side_df['Date']).dt.date

side_df.set_index("Date")

st.sidebar.title("Last 5 Days - Crypto Fear & Greed Index")

st.sidebar.table(side_df.head()[['Date', 'Value', 'Label']])
To ensure that index values are not shown from the displayed table I use this code chunk when using st.table or st.sidebar.table. Reference
# Remove indices:
# CSS to inject contained in a string
# Reference: https://docs.streamlit.io/knowledge-base/using-streamlit/hide-row-indices-displaying-dataframe
hide_table_row_index = """
            <style>
            tbody th {display:none}
            .blank {display:none}
            </style>
            """

# Inject CSS with Markdown
st.markdown(hide_table_row_index, unsafe_allow_html=True)

Code For Price Plot
The line plot does not take many lines of code but I had to test some stuff out to get this result. I wanted the title centered and I wanted the line plot to be interactive. This code chunk plus plotly worked out. The colour picker variable pick_color comes into play in fig.update_traces()
## Plot On Main Area
# Reference: https://discuss.streamlit.io/t/how-do-i-align-st-title/1668/13

colT1,colT2 = st.columns([1,8])
with colT2:
    st.title("Crpyto Fear & Greed Plot")

fig = px.line(df, x="Date", y="Value")
fig.update_traces(line_color= pick_color)

st.plotly_chart(fig, use_container_width = True, height = 300, width = 300)

Posted with STEMGeeks
They told me if I killed myself now it would save the lives of countless others.
Saying the longer I wait to kill myself the more people will suffer.
They are reckless and should have shown the proper media what they had before taking me hostage for 5 years. I know there are many in prison that dont deserve to be there because of this. Your stay in prison will not be fun @battleaxe and friends. People are going to want you dead when they find out what you did. I hope you die a slow painful death. You sick mother fuckers.
https://peakd.com/gangstalking/@acousticpulses/electronic-terrorism-and-gaslighting--if-you-downvote-this-post-you-are-part-of-the-problem
Its a terrorist act on American soil while some say its not real or Im a mental case. Many know its real. This is an ignored detrimental to humanity domestic and foreign threat. Ask informed soldiers in the American military what their oath is and tell them about the day you asked me why. Nobody has I guess. Maybe someone told ill informed soldiers they cant protect America from military leaders in control with ill intent. How do we protect locked up soldiers from telling the truth?