Crypto Fear & Greed Index With R Programming
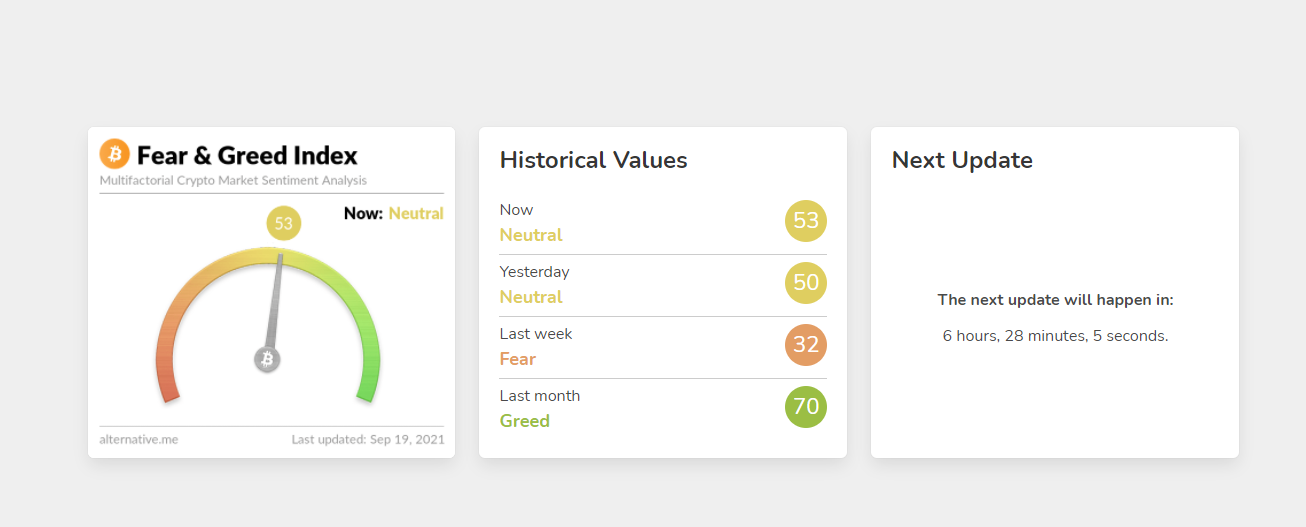
Hi there. In this post, I talk about working with the crypto fear and greed index data into R programming. The crypto fear and greed index is one metric that captures the sentiment of the crypto market. This website from alternative.me is what I refer to for the Crypto Fear & Greed index.
If the market is fearful, it would be a good idea to buy when the prices are low. When the market is feeling greedy, it would be a good idea to take the opposite of the trade and sell. Sell could also means to convert cryptos into stablecoins so you have some to buy dips. Do invest/trade at your own risk and do research.
The main contents of this post can also be found on my website. The plots on my website has interactive plotly plots while this post contains screenshots.
Topics
- Obtaining Crypto Fear & Greed Index Data
- Preparing The Data For Plotting
- Crypto Fear & Greed Plotting
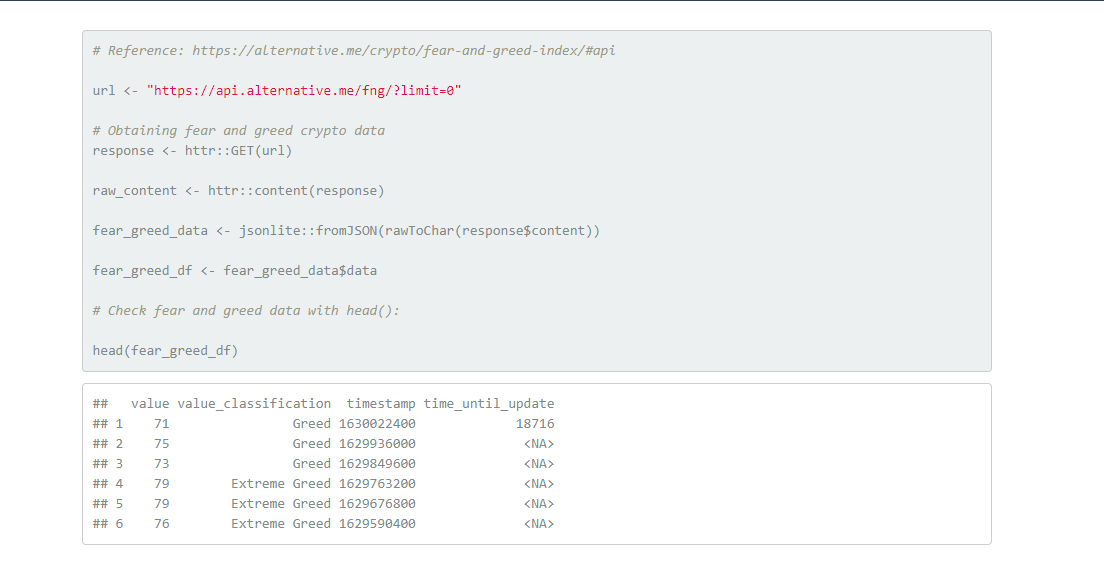
Obtaining Crypto Fear & Greed Index Data
Start with loading these three libraries into R
# Load packages, use install.packages("rjson") to install rjson
library(httr)
library(plotly)
library(jsonlite)
The httr library in R is needed to pull data from the alternative.me website. Plotly is needed for plotting once the data is prepared. Having jsonlite is needed as the data pulled from the website is in the JSON format. This JSON format would be converted into a R dataframe.
Preparing The Data For Plotting
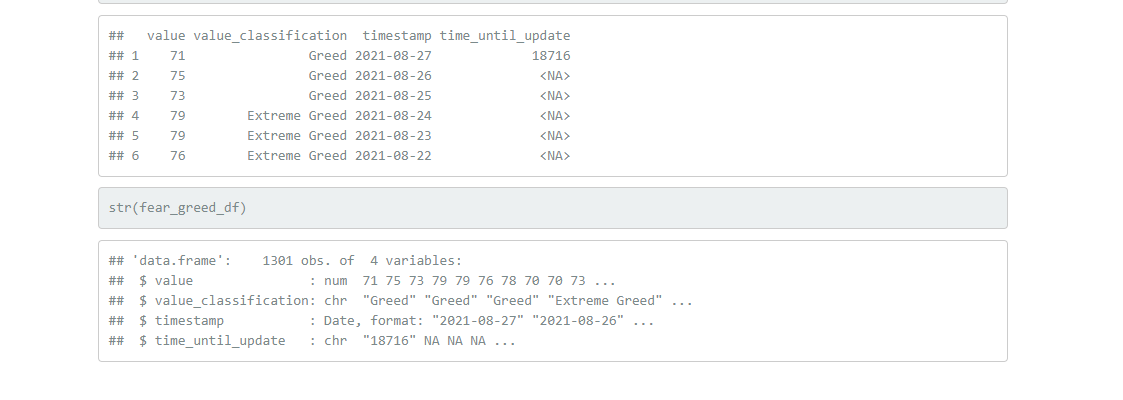
The extracted data contains values in the character format. The value column needs to be in a numeric format as well as the timestamp values in that column. Once the timestamp is a numeric, this column needs to be converted into a column of dates.
# Convert into numeric for value and timestamp columns

fear_greed_df$value <- as.numeric(fear_greed_df$value)
fear_greed_df$timestamp <- as.numeric(fear_greed_df$timestamp)

# Convert timestamp into date format:
# Example: as.Date(as.POSIXct(1629763200, origin = "1970-01-01"))

fear_greed_df$timestamp <- as.Date(as.POSIXct(fear_greed_df$timestamp, origin = "1970-01-01"))

# Check dataframe:

head(fear_greed_df)

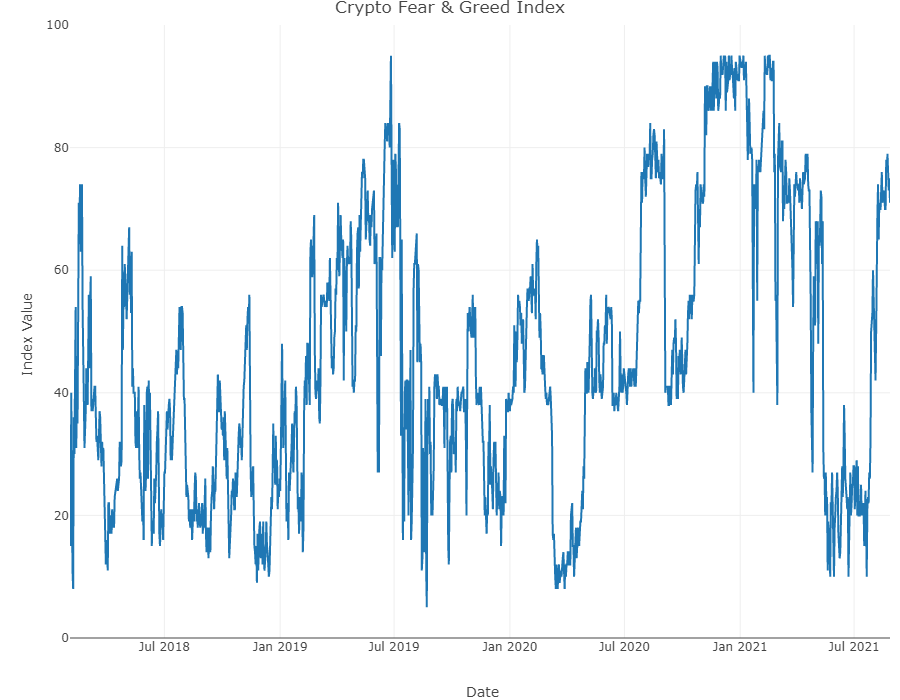
Crypto Fear & Greed Plotting
Once the data is prepared, you can produce a line plot with the use of plotly in R. The code and the plot in the form of a screenshot is provided below.
###### Line Graph Plotting:

fear_greed_df %>%
  plot_ly(x = ~timestamp, y = ~value, type = 'scatter', mode = 'lines',
          width = 900, height = 700) %>%
  layout(title = "Crypto Fear & Greed Index",
         xaxis = list(title = "\n Date"),
         yaxis = list(title = "Index Value \n"))
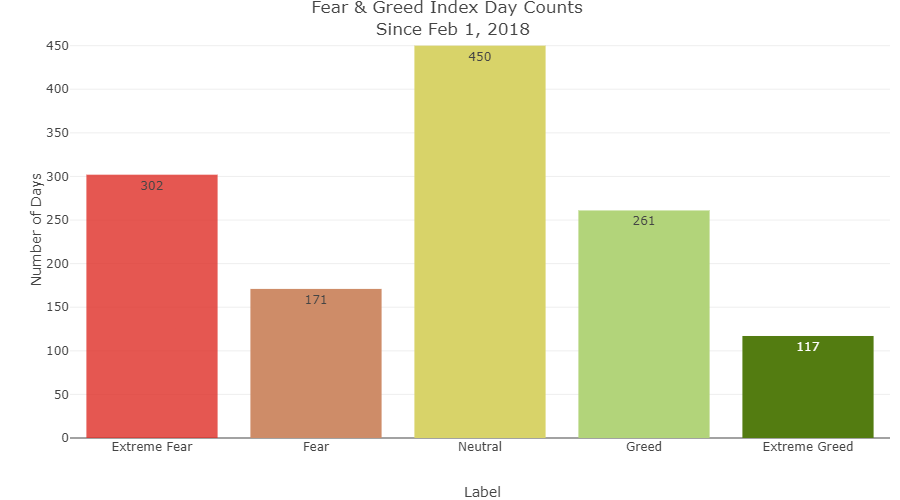
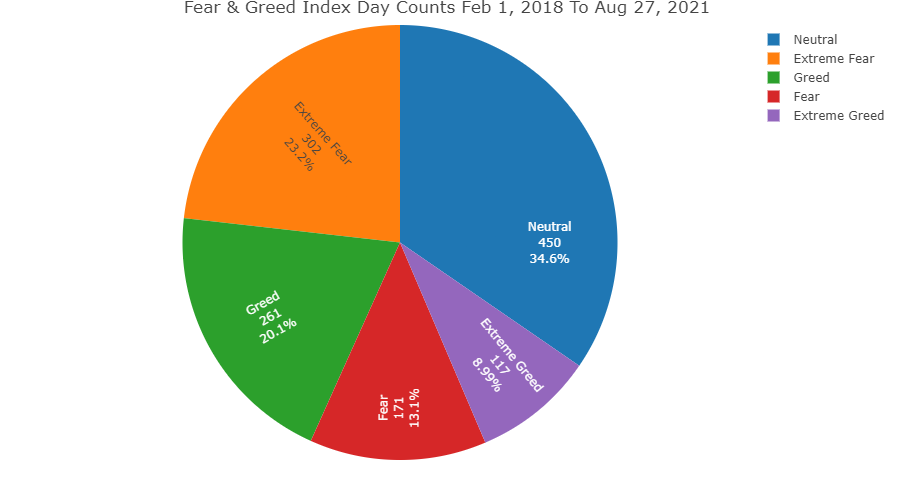
From curiousity and experimentation I have produced a bar graph and a pie chart based on the Fear and Greed Index labels. Plot only shown here and no code provided. Full details in my website page.

Posted with STEMGeeks