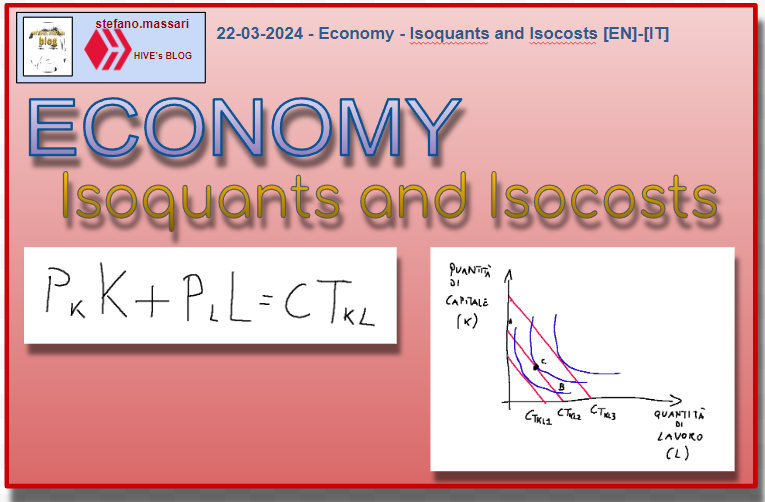
22-03-2024 - Economy - Isoquants and Isocosts [EN]-[IT]

~~~ La versione in italiano inizia subito dopo la versione in inglese ~~~
ENGLISH
22-03-2024 - Economy - Isoquants and Isocosts [EN]-[IT]
Isoquants and Isocosts
Isoquant = the set of different combinations of production factors that allow the same quantity of total production to be produced.
iso = same
quantity = quantity of product
Each isoquant curve is associated with a different production level.
Isocost = the set of combinations of two production factors that determine the same overall production cost.
The isocost equation can be represented graphically on the Cartesian plane.
The production process is set on an equilibrium dictated by capital and labor.
During its life, the company must always find its production balance. To do this we make use of the study of isoquants and isocosts.
A company must try to identify the indifference curves and the budget constraint of consumers.
Let's remember that it is necessary to create endogenous growth, that is, a company must always try to grow internally.
Isoquant example
We think we need to produce 500 units of a good, so Q = 500.
Below are two isoquants:
1-I can produce 500 goods with 5 units of machines and 5 units of work
2-I can produce 500 goods with 2 units of machines and 10 units of labor
The production is the same, but the balance between machine units and work units is different.
Marginal Rate of Technical Substitution
The slope of an isoquant represents the Marginal Rate of Technical Substitution (SMST)=ΔK/ ΔL.
This term makes the company understand how much it can cost to replace people with machines and vice versa.
Isocost lines
Isocosts are similar to isoquants. Isoquants tell us how we can combine production factors and their replacement, while isocosts tell us how much production factors cost depending on their combination.
Each isocost line indicates the cost of all the different combinations that can be purchased with the same budget constraint. Essentially the budget constraint is what the quantity in the isocost curve was.
Formula:

Where:
PkK = cost (example: cost of the energy needed to operate a machine)
PlL = labor cost for a given cost constraint
CTkL = total cost for a given budget constraint
Example:
Cost of capital = 1000 euros
Price of a work unit = 500 euros per month
Capital unit usage = 3
Work unit usage = 9
If we replace the terms in the formula described above we will have that:
1000K + 500L = CTkl
1000 x3 + 500 x 9 = 3000 + 4500 = 7500 euros
Combined isoquants and isocosts
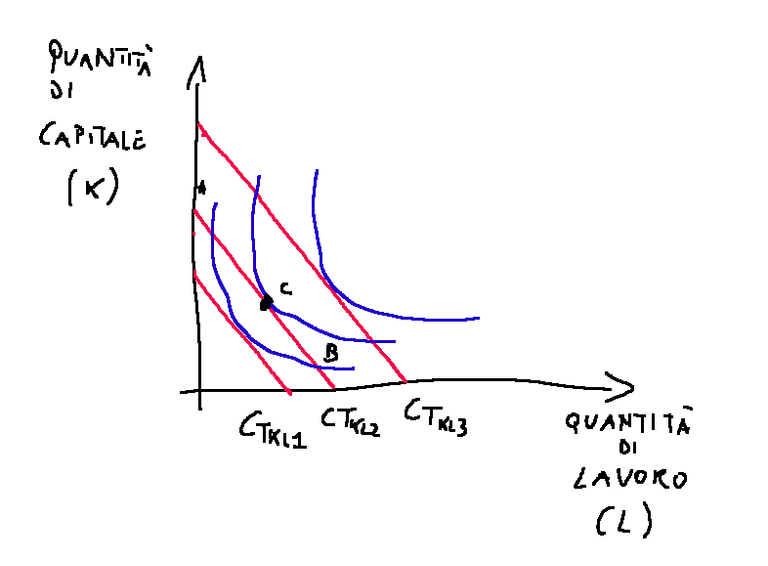
By combining the data, i.e. the isocost and isoquant graphs, one is able to determine the minimum cost equilibrium.
The minimum cost condition is given by the point of tangency between the isoquant curve and the isocost line.
At the point of tangency, the combination of minimum cost factors is given by the Marginal Rate of Technical Transformation (SMST) = factor price ratio.
Example of a graph with isoquant and isocost curves

Below is a link where you can see another example of a graph with isoquant and isocost curves
https://www.okpedia.it/allocazione_ottimale_dei_fattori#:~:text=Come%20gi%C3%A0%20sappiamo%20la%20curva,fattori%20x1%20e%20x2.
Conclusions
Isoquants and isocosts are very important data regarding the production of a company. By cross-referencing the isoquant and isocost data, the minimum cost equilibrium can be determined.
Request
Have you already heard of isoquants and isocosts?

ITALIAN
22-03-2024 - Economia - Isoquanti ed Isocosti [EN]-[IT]
Isoquanti ed Isocosti
Isoquanto = l'insieme delle diverse combinazioni dei fattori produttivi che consentono di produrre la stessa quantità di produzione totale.
iso = stessa
quantità = quantità di prodotto
Ogni curva di isoquanto è associata a un livello di produzione differente.
Isocosto = l'insieme delle combinazioni di due fattori produttivi che determinano lo stesso costo di produzione complessivo.
L'equazione di isocosto può essere rappresentata graficamente sul piano cartesiano.
Il processo di produzione è impostato su un equilibrio dettato dal capitale e dal lavoro.
Durante la sua vita, l'impresa, deve sempre trovare il suo equilibrio di produzione. Per fare questo ci si avvale dello studio degli isoquanti e isocosti.
Un impresa deve cercare si individuare le curve di indifferenza ed il vincolo di bilancio dei consumatori.
Ricordiamo che serve creare una crescita endogena, cioè un impresa deve sempre cercare di crescere all'interno.
Isoquanto esempio
Pensiamo di dover produrre 500 unità di un bene, quindi Q = 500.
Qui di seguito due isoquanti:
1-Possiao produrre 500 beni con 5 unità di macchine e 5 unità di lavoro
2-Possiao produrre 500 beni con 2 unità di macchine e 10 unità di lavoro
La produzione è la stessa, ma il bilancio tra le unità di macchine e le unità di lavoro è diverso.
Saggio Marginale di Sostituzione Tecnica
La pendenza di un isoquanto rappresenta il Saggio Marginale di Sostituzione Tecnica (SMST)=ΔK/ ΔL.
Questo termine fa comprendere all'azienda quanto può costare la sostituzione di persone con delle macchine e viceversa.
Rette di isocosto
Gli isocosti sono simili agli isoquanti. Gli isoquanti ci indicano come possiamo combinare i fattori produttivi e la loro sostituzione, mentre gli isocosti ci indicano quanto costano i fattori produttivi a seconda della loro combinazione.
Ogni retta di isocosto indica il costo di tutte le diverse combinazioni che possono essere acquistate con lo stesso vincolo di bilancio. In sostanza il vincolo di bilancio è quello che era la quantità nella curva dell'isocosto.
Formula:

Dove:
PkK = costo (esempio: costo dell'energia necessaria per il funzionamento di una macchina)
PlL = costo del lavoro per un dato vincolo di costo
CTkL = costo totale per un dato vincolo di bilancio
Esempio:
Costo del capitale = 1000 euro
Prezzo di un unità di lavoro = 500 euro al mese
Utilizzo unità capitale = 3
Utilizzo unità di lavoro = 9
Se sostituiamo i termini alla formula descritta sopra avremo che:
1000K + 500L = CTkl
1000 x3 + 500 x 9 = 3000 + 4500 = 7500 euro
Isoquanti e isocosti combinati
Combinando i dati, quindi i grafici degli isocosti e degli isoquanti, si è in grado di determinare l'equilibrio di costo minimo.
La condizione di minimo costo è data dal punto di tangenza tra la curva di isoquanto e la retta di isocosto.
Nel punto di tangenza, la combinazione dei fattori di minimo costo è dato dal Saggio Marginale di Trasformazione Tecnica (SMST)= rapporto prezzi dei fattori.
Esempio di un grafico con le curve isoquanti e isocosti

Qui di seguito un link dove si può vedere un altro esempio di un grafico con le curve isoquanto ed isocosto
https://www.okpedia.it/allocazione_ottimale_dei_fattori#:~:text=Come%20gi%C3%A0%20sappiamo%20la%20curva,fattori%20x1%20e%20x2.
Conclusioni
Gli isoquanti e gli isocosti sono dati importantissimi che riguardano la produzione di un'impresa. Incrociando i dati degli isoquanti e degli isocosti si può determinare l'equilibrio di costo minimo.
Domanda
Avevate già sentito parlare di isoquanti e isocosti?
THE END
Isoquants - same quantity
Isocosts - same cost
I've just learned about that today.
Hi @mfontom, Exact! You understood very well!!! If the isoquants show us how we can combine the production factors and their replacement, the isocosts instead show us how much the production factors cost us depending on their combination. This could be similar to a kind of corporate budget constraint.
Each isocost line indicates the cost of all the different combinations that can be purchased with the same budget constraint.
@tipu curate
Upvoted 👌 (Mana: 25/55) Liquid rewards.
Grazie claudio per il tipu, sto cercando di inserire in HIVE una serie di contenuti tecnici. I miei follower sono calati un pochino, ma non drasticamente come mi aspettavo. !LUV
claudio83, stefano.massari sent you LUV. 🙂 (1/5) tools | trade | connect | wiki | daily
Made with LUV by crrdlx.
I’m glad I learned about Isocost equations
The formula is easy
Thanks for being here. We can summarize this article in the following way. Isoquants tell us how we can combine production factors and their replacement, while isocosts tell us how much production factors cost us depending on their combination.
In the isoquant graph we will have the number of work units on the abscissas and the machines on the ordinates.
In the isocost graph we will have the number of labor units on the abscissae and the capital units on the ordinate.
The production cost seems it has a long way to decide how the product will be sold right?
Thanks for being here. Managing the production of a company is something extremely complicated. In a section of this article I talk about isocosts. An isocost is essentially a graph that represents the infinite combinations of two production factors that give rise to the same production cost. Example: in order to produce a quantity Q=600, 4 machine units and 1 work unit could be used, but also, for example, 2 machine units and 2 work units. In both cases we will have the same production cost.
!DHEDGE
!ALIVE
@tipu curate
@stefano.massari! You Are Alive so I just staked 0.1 $ALIVE to your account on behalf of @ libertycrypto27. (3/10)
The tip has been paid for by the We Are Alive Tribe through the earnings on @alive.chat, feel free to swing by our daily chat any time you want, plus you can win Hive Power (2x 50 HP) and Alive Power (2x 500 AP) delegations (4 weeks), and Ecency Points (4x 50 EP), in our chat every day.

Grazie Liberty per essere passato di qua. Isoquanti ed isocosti sono due analisi che permettono di impostare correttamente un processo di produzione per tirar fuori un prodotto che possa affrontare il mercato, cioè che sostanzialmente abbia un costo per cui si possa applicare un ricarico (prezzo finale) e riuscire a venderlo creando un utile. !LOLZ
lolztoken.com
But at least it puts food on the table.
Credit: reddit
@libertycrypto27, I sent you an $LOLZ on behalf of stefano.massari
(1/6)
Delegate Hive Tokens to Farm $LOLZ and earn 110% Rewards. Learn more.
Ho già iniziato, NON ,ho sentito parlare di questo argomento :)
Grazie per aver risposto. Il concetto più complicato di questo articolo è il seguente. La condizione di minimo costo è data dal punto di tangenza tra la curva di isoquanto e la retta di isocosto.
Nel punto di tangenza, la combinazione dei fattori di costo minimo è dato dal Saggio Marginale di Trasformazione Tecnica. (SMST)= rapporto prezzi dei fattori.