R Language - How to Create Venn diagram with ggVennDiagram in R
In this post, we take a look at How to Create Venn diagram with ggVennDiagram in R. This chart can be effective for various stats and the math related works. You would be able to use them for plotting the venn diagram in R.
Previously I covered how to create Bump chart. It was one of those charts which are pretty cool to view and also a lot of datasets can be represented with that chart. Now today the venn diagram chart is another that I wish to cover in R language.
In this chart, I wish to use the RStudio for the plotting and for the code. This could be a good option for you in context for the plot. Another thing is that I am making use of the simple code here you can choose to even use either my option from the video or you can try your own dataset.
I have created a video to give you an overview on How to Create Venn diagram in R. You should give this one a try.
Let's try and get the library used for the venn diagram design. So we are going to be calling that for the design of the venn diagram. The package used here is - ggvenndiagram.
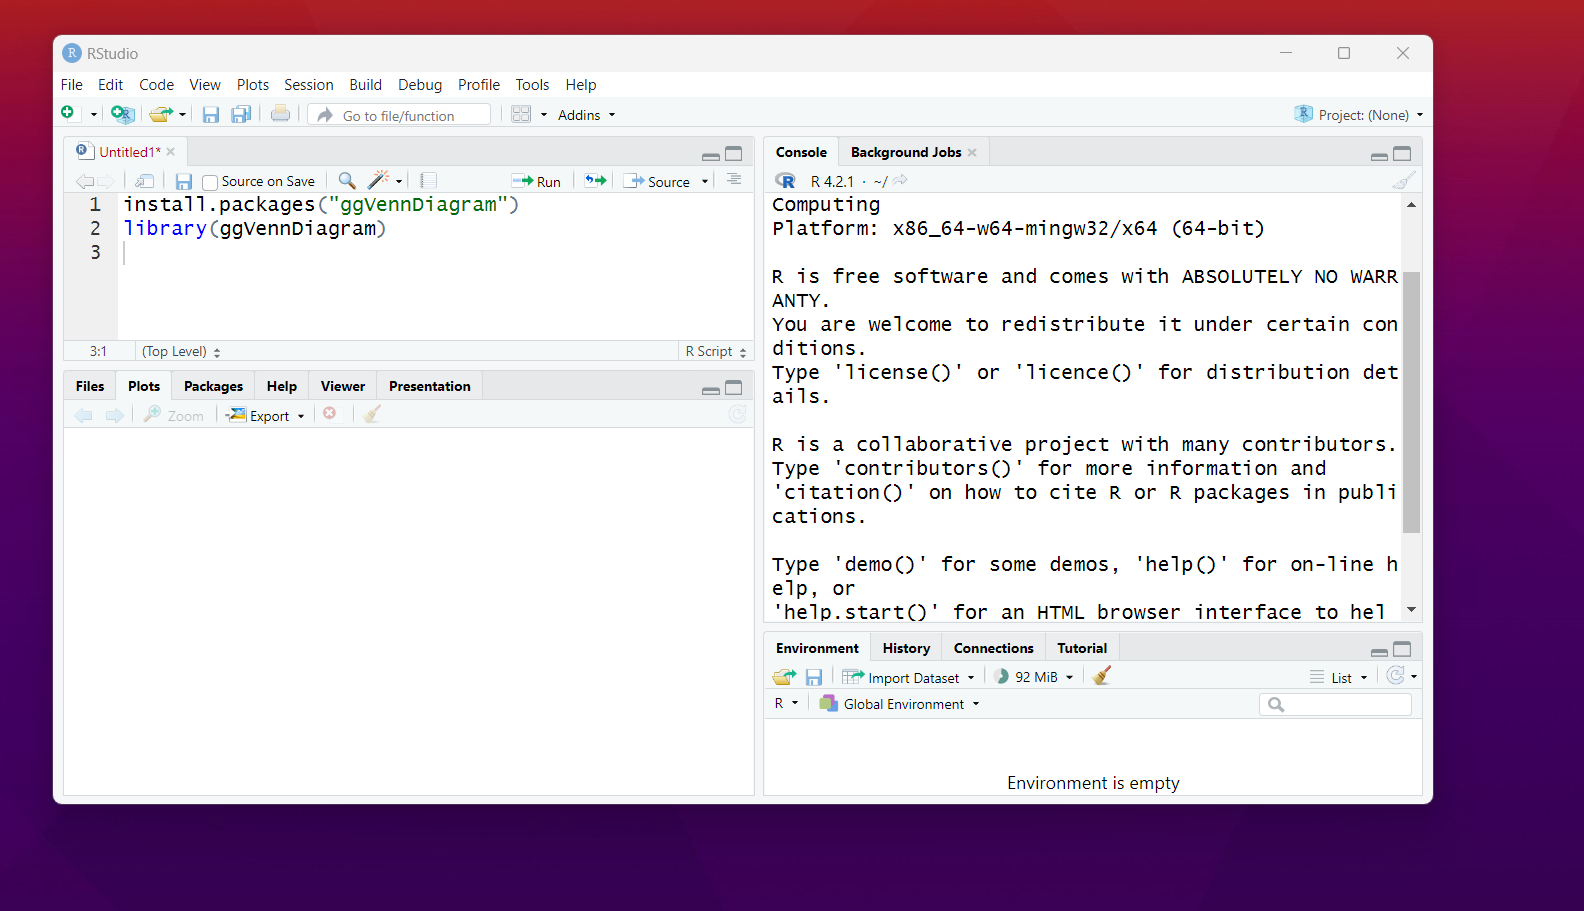
install.packages("ggVennDiagram")
library(ggVennDiagram)
This should be pretty easy for you to check with the RStudio.
Now that we have the packages, the next thing we are going to be needing is the sample data.
So let's get some sample data.
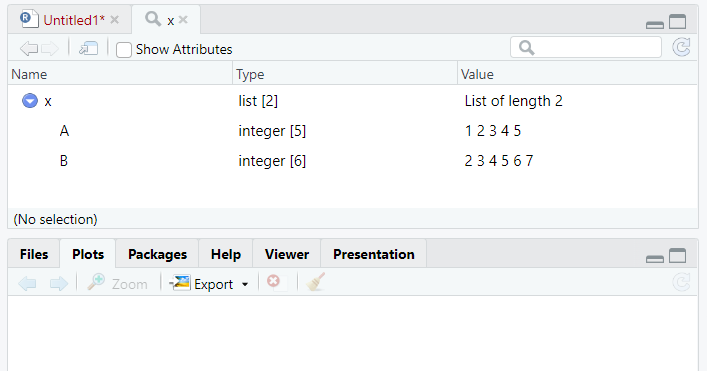
x <- list(A = 1:5, B = 2:7)
Here x would be holding the list of the values in A and B.
Now let's plot the venn diagram.
ggVennDiagram(x)
You can check out the plot that appears below. It is pretty cool plot that you can customize more as you plan on changing some of the properties in the function.
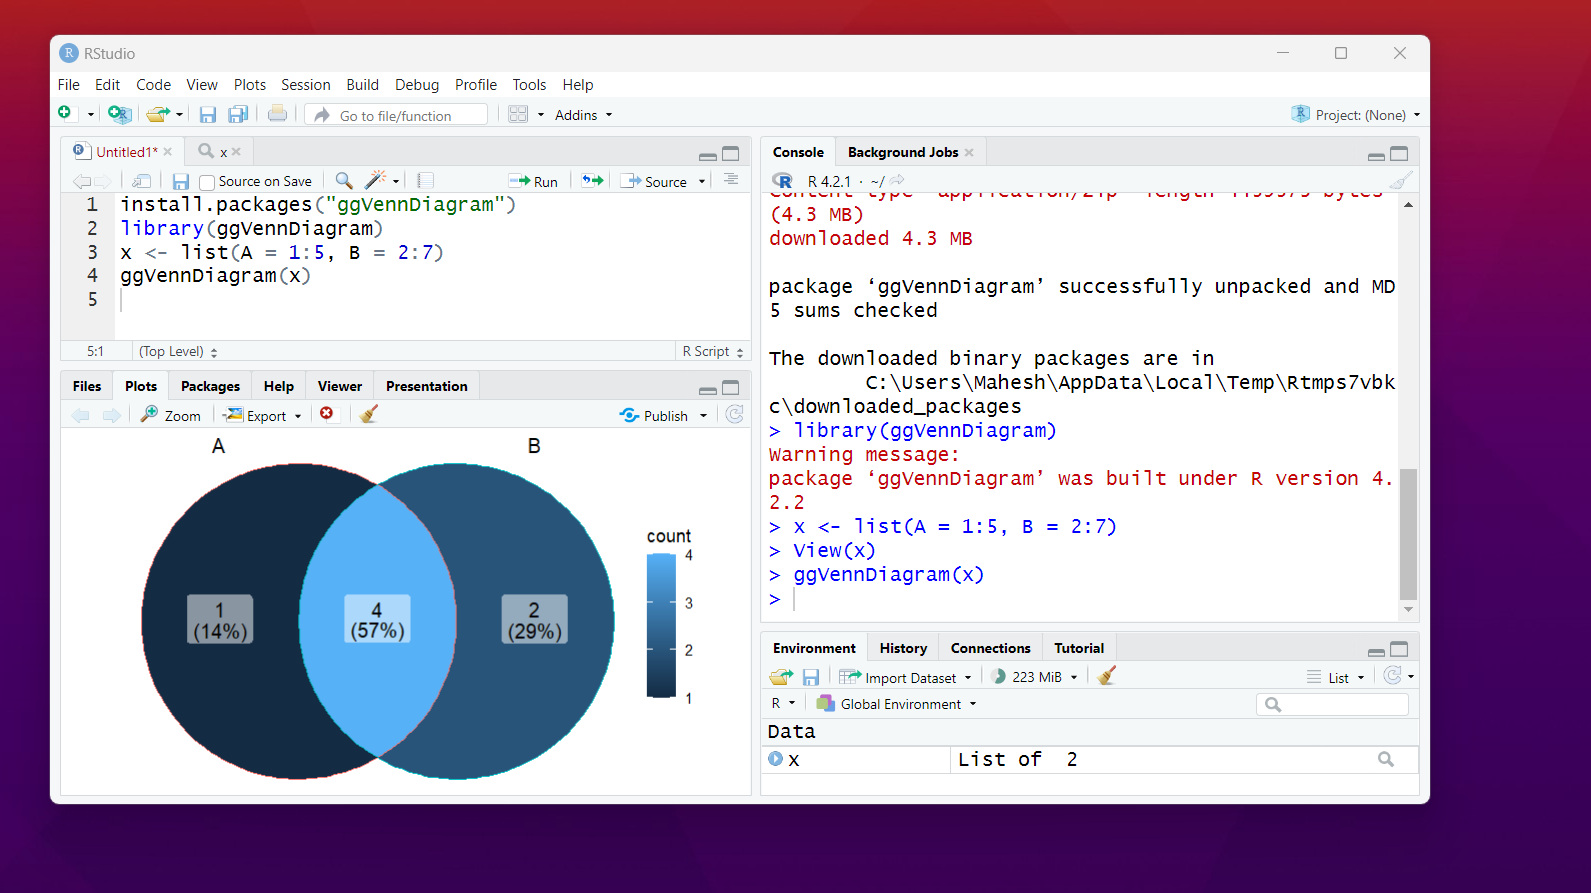
That's it. You can see the venn diagram and now you can modify the color, border, the percentage and other values like caption. Some of them would be easier for you to use and work around with as well.It would make things easier for you to work with as well.
I would be covering the heatmap and the waffle chart next few tutorials. I am sure you would be loving some of these charts. And you can use multiple libraries for plotting those charts. So you are going to find it useful for your plotting use case.
I recently got few new lectures up for the natural language processing. But I have not much covered in this space. I may consider covering some really good lectures and also may find making use of the chapters here as a part of the tutorial.
Now the next things would be covering some of the new charts and then change the libraries like ggmap and the other where it would be easier for me to use it for the basic plots.Like say the plotly library which would be worth covering in the data science topics.
If you happen to like this content, do give me feedback over there and that would help me improve my efforts in near future.
Thanks for your contribution to the STEMsocial community. Feel free to join us on discord to get to know the rest of us!
Please consider delegating to the @stemsocial account (85% of the curation rewards are returned).
You may also include @stemsocial as a beneficiary of the rewards of this post to get a stronger support.