Learn how to Group Data in Excel and use Subtotals
Grouping Data
Last week we looked at the Outline feature in Excel. While the automatic outlining capabilities in Excel 2013 work very well with numerical data, it is not so effective when working with non-numerical values or data that has no distinctive totals. Luckily, you have the option to manually group data in Excel.
In the workbook image below, there are no formulas or numeric totals, so you will need to group the data manually. For this example, let’s begin by grouping the members in the East Division together. Select cells A5:E7 and then click Data → Group → Group:
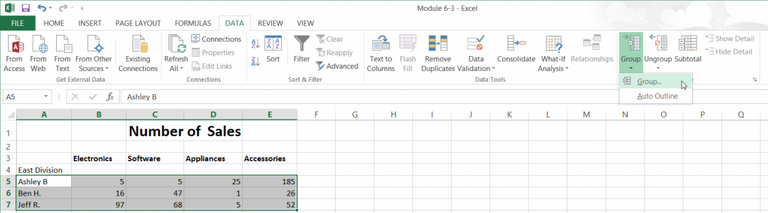
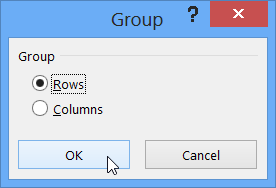
This action will display a dialog box that asks you if you want to group by rows or columns. For this example, ensure that Rows is selected and then click OK:
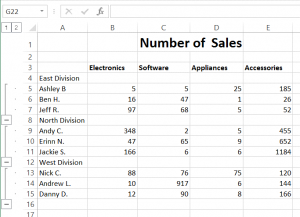
An outline indicator and a collapse/expand button will be created for the new group:

Follow the same procedure for cells A9:E11 and again for cells A13:E15. Your worksheet will now look like this:
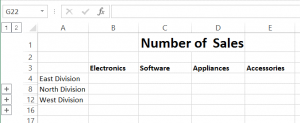
Clicking the number 1 button will display the highest level view (lowest detail) of the manual groupings:
Creating Subtotals
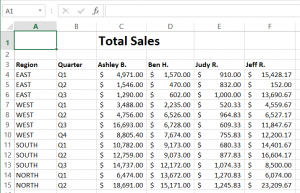
Yet another outlining technique available in Excel 2013 is the Subtotals feature. Using this tool, you can create automatic subtotals and grand totals for numeric data that is organized with clear column and row headings. For example, the sample workbook contains sales information for different regions and time periods:
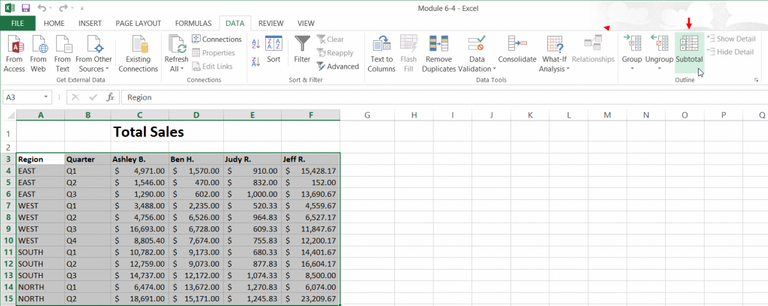
To use the subtotal feature, you first need to select a range of cells that you would like to work with. For this example, select A3:F15. Next, click Data → Subtotal:
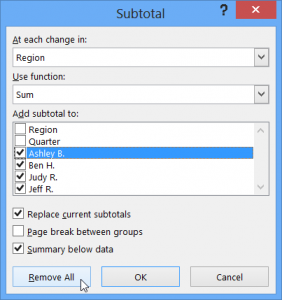
This action will open the Subtotal dialog box:
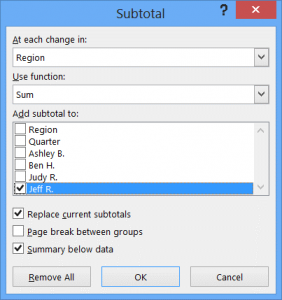
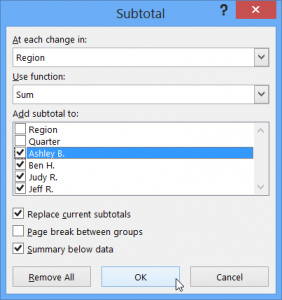
In the “Add subtotal to” section, you can select the columns you want totals for. For this example, ensure that only the names are selected. Click OK:
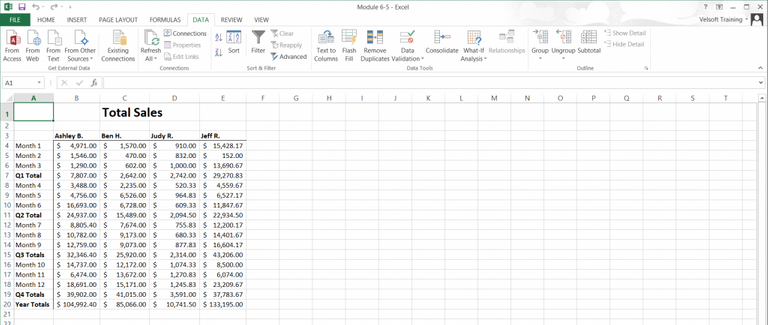
Your worksheet will now look like this:

You will see that new subtotals for each region have been created, as well as a grand total that adds all of the values together. In addition, Excel has automatically grouped this data together in a numbered outline. The outline commands work exactly the same as they do elsewhere in Excel: the lower the number on the button you click, the less detail will be shown.
To remove subtotals, select the range of data in question and then click Data → Subtotal. This action will display the Subtotal dialog box. In this dialog, click the Remove All button:
Removing Outlining and Grouping
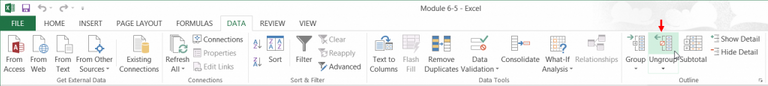
To remove the outlining from a worksheet, click Data → Ungroup → Clear Outline:

The outlining for the current worksheet will be removed:
If you would like to remove individual groupings from your current worksheet, select a cell inside the group. Next, click Data → Ungroup:
This action will open the Ungroup dialog box. Choose the object type you would like to ungroup (rows or columns) and then click OK:
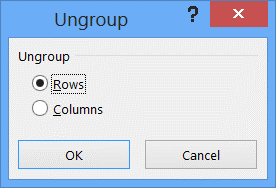
The selected grouping will then be removed.
SIGN UP NOW
In return for this Tip – Learn how to Group Data in Excel and use the Subtotal feature – I ask that you share this post with your friends and colleagues
Cross posted from my blog with SteemPress : https://theexcelclub.com/group-data-in-excel/
Follow the link https://sophuc.com I know this article. It was really rewarding. Thank you for sharing
- Ngaan Le
Follow the link http://sophuc.com/
I know this article. It was really rewarding. Thank you for sharing
- Ngaan Le
very good
- Ngaan Le
Congratulations @theexcelclub! You have completed the following achievement on the Hive blockchain and have been rewarded with new badge(s) :
You can view your badges on your board and compare to others on the Ranking
If you no longer want to receive notifications, reply to this comment with the word
STOPDo not miss the last post from @hivebuzz:
Vote for us as a witness to get one more badge and upvotes from us with more power!
Too funny! I was just writing about subtotals and how awesome it is in excel. I’ll read this in more detail in the morning!