Excel fun part 2 - Pivot Table work
Hi fellow Excel users and fans,
Back with my second edition of the first post, found here for the last part of my recent excel epiphany.
One thing I wanted to note was that the data I was working with, I had to break it into multiple sheets so that each sheet only contained one filtered subset of information to keep things easy to handle, with less or no in-sheet filtering and extra work that could mess things up in the future.
A Pivot Table, what is it????
Now that I had all of that information at my finger tips in the entirely new dataset I was working with, came my next Excel epiphany of sorts. I was doing lots of jumping that day. Originally, I was using Power query to get the data columns transformed to then calculate averages at the bottom of the excel sheet to then pull into the pivot table. Boy was I overjoyed when I learned that pivot tables do that calculation for you!
If you haven't used pivot tables and use excel often, you are certainly missing out! My wife raved about them for years and I sort of yawned and "yes"'d her to death when she told me stories like I told her. She laughed and told me "now you finally understand why I was so excited but you didn't seem to understand what I was talking about :P"
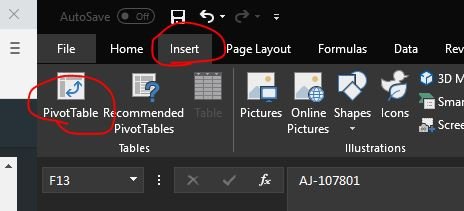
When you are in Excel, have the file open then click the "Insert" tab then "Pivot Table" to coordinate the data you want to put into a pivot.
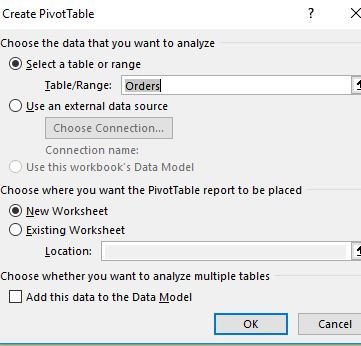
For the first time doing a pivot table in a workbook, you usually want to insert it into a new sheet. For an existing pivot sheet, change it to "existing sheet" and tell it where you want to go.
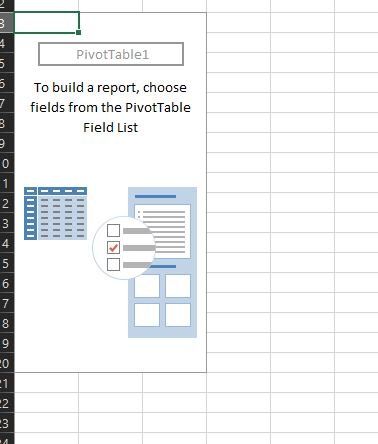
I'm not going to lie, the first time I opened a pivot table I was very intimidated by all the choices. Can't excel just do it for me and I tweak it? Well no, there is so much great variability that it requires you to guide it along. Once you get a basic understanding of how it gets laid out when you put pieces of information in each spot, it makes more sense. For me, each piece of data requires me to figure out where I want to lay it out in the pivot, so trial and error is the name of the game.
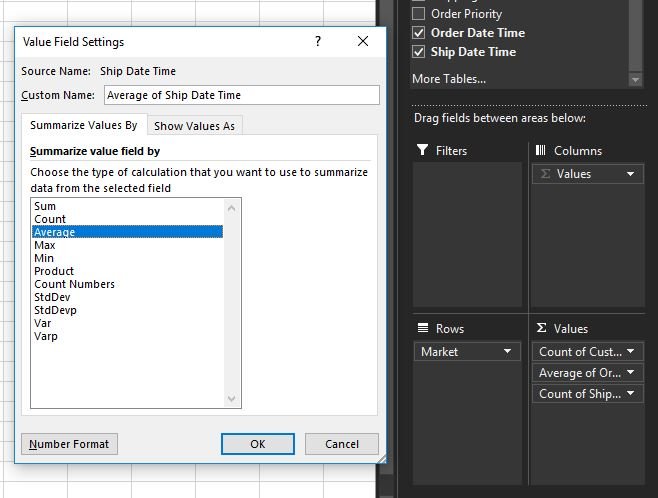
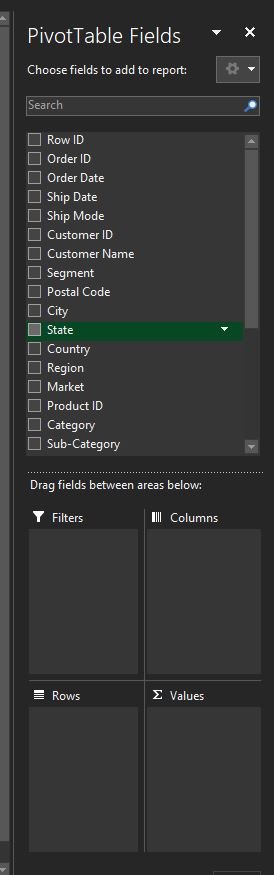
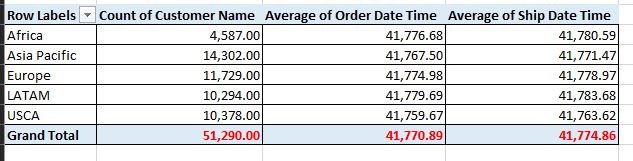
The awesome part of my two-part epiphany with pivot tables is that you can change what a pivot is doing with the values you are looking at. As you can see, if you insert something numerical in the "Values" section of the pivot, it provides you with lots of numerical representations. For my particular scenario I wanted to show a count of one value for overall "grand total" type data, but I also wanted to show some TAT (average, to be precise) data as well. I thought I would have to manually go into each sheet and calculate it and put it at the bottom and create a new row for averages. Thankfully I stumbled upon the "value field settings" section of the pivot! To get it to change to value field settings, where it says "Count of Cust..." and there is an arrow next to it, click the arrow and choose the [bottom] option "Value Field Settings" to make adjustments to how the data is processed.
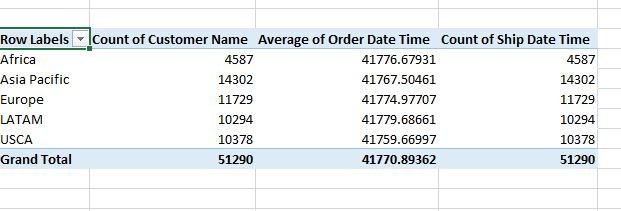
I changed it from "count" on the date/time of one of the values and it instantly calculated the TAT that I painstakingly put together with a formula that refused to work a few times. Boy did that completely slice up my timeline for how long it took to process one dataset!
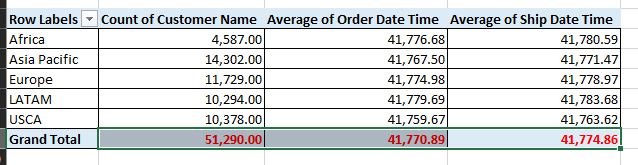
It then shows nicely when you put them together. Having it do all the calculations for you as well as labeling the data with what you want is a very nice look! I repeated this with the rest of the sections I needed, and have a new request to do this in minimum and maximum so it will be fun to give that a try as well.
My last Excel epiphany I played around with is I spent a fair amount of time on each pivot, pulling in the right data, columns and formatting them to look nicely but certainly there is a faster way to do that, I had thought.
Couldn't I just copy and paste? Well yes you can, by golly!
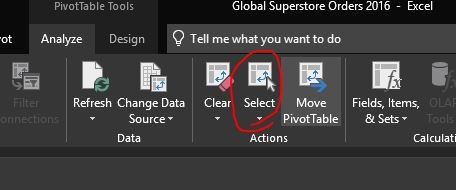
To do this, I went to the "Analyze" tab when you are in the pivot table design and editor. This will give you a few choices but we are interested in the "Select" tab, which you would then use to select "Entire PivotTable" that we would like to copy.
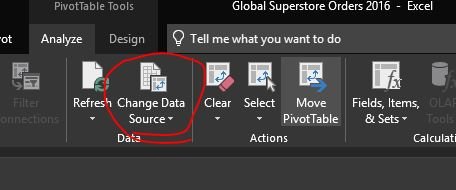
Once you have determined where you would like to paste the table (for consistency, I always insert a pivot 6 cells below the bottom row of the pivot above it, that way it's consistent and looks clean but also allows you to add additional options in the future if you need to [sometimes when adding different rows for example, it bumps the pivot table upwards one cell and Excel doesn't like it much when you try to do that and bump up against the pivot above it]) and paste it. This makes an exact copy, formatting and everything, of the pivot from above into a new pivot below. Now for the most time efficient trick to re-do all of the work you did to get the pivot looking awesome, "Change Data Source" will save you precious minutes/hours!
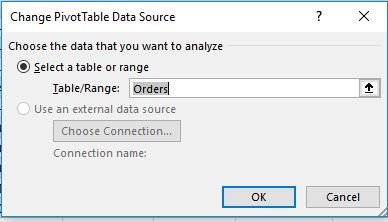
Once you have change data source open, select the different sheet you wish to use and bam! It does the calculations and formatting you applied to make the other pivot looking great, to the new one. This includes the column grids, any colors you add to it and exactly replicates it with new data which saves so much time!
You will look like an excel pro (fake it 'til you make it, eh?) to those who are interested in looking at this data! (in some fields I guess, others may have people who know lol)
Let me know how you use it!
Are you an excel user? Let me know how you use it, I'd love to talk about it and see and learn things from you! Was my little guide easy to follow? Let me know if there are improvements on explaining something. I would also be interested to find out an easier way to do this if possible, just to learn something more. Can't hurt to try.
I know @paulag is an excel wiz on here but I'd love to find some others who have an affinity for number crunching and analytics! Consider following her other page, https://steempeak.com/@theexcelclub for more!
Did you enjoy this post or my other posts? Please consider following me for more! @cmplxty
https://www.presearch.org/signup?rid=513043
Still using Steemit.com? Upgrade! Steempeak is a much better user-interface, gives loads more information at your fingertips and has some great developers behind it. Give it a try, go to www.steampeak.com and see how much easier it is. You just need to use Steem Connect, one of the most secure ways to log into other Steem frontends.


Interesting
Piotr and you are great supporr to steemit
Thanks for checking it out! Piotr helped me get on my feet here over a year ago! He’s helped so many for sure.
I can see it
Steem on
Happy Holidays
nice work. Pivot tables are really awesome. When you get to Power Pivot, you can use multiple tables which really make pivot tables way more powerfull
Thanks! I will be giving power pivot a try in a few weeks when things die down a bit. I would be interested if it would have made this task easier!