I Am Back

Life
So I may or may not have dropped off the radar for a couple of days without any word. And well the main reason for that was assignments, University assignments to be precise.. to be even more precise Computer Science Data Visualiation.
And of course like a good student, I totally did everything weeks in advance and did totally not just do everything the day before.. Ohhh wait, I did just that.

Interesting Bits
So I had to choose a dataset and make a visualization with a particular goal in mind. Now I would have loved to have done somerthing in crypto but all the datasets required processing and filtering and I didn't have nearly that much time (24H). So I chose the top dataset at the time which was a dataset based on diamonds (link if you're interested)
So I did some processing and found some interesting results.
DIAMONDS BABY
So I graphed a couple of them and found out some interesing things and thought I'd share them :)
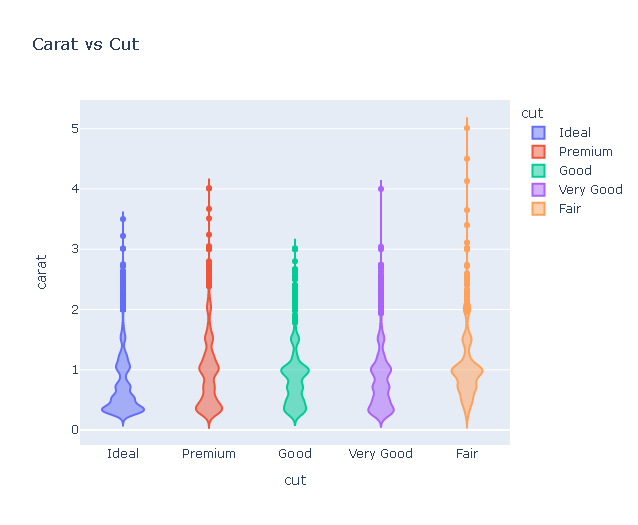
Carat and the Cut
Sure there are some cuts which fade out quicker and others which stretch beyond the others; but for the most part they actually seemed well within median of eachother.
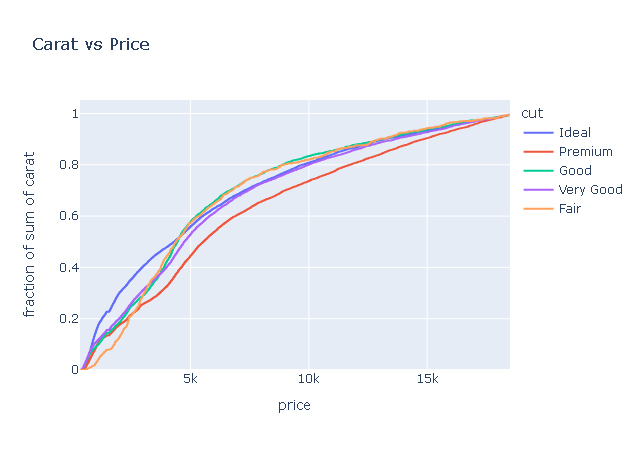
HOW MUCH ???..
But the previous initial assessment seems to hold true, there seems to be an equilibrium point at which you get diminishing returns on your diamond.
Now can we expand further?
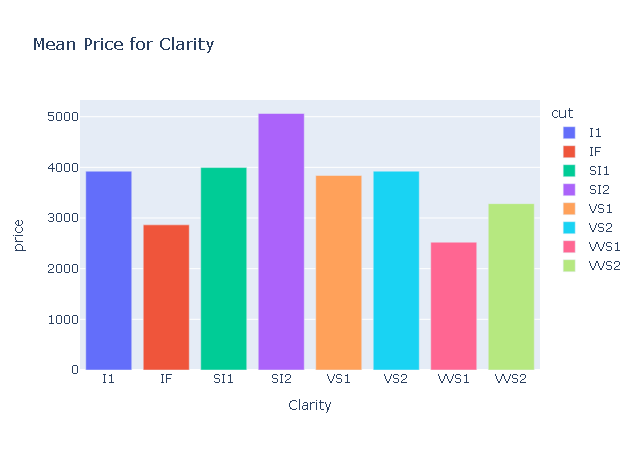
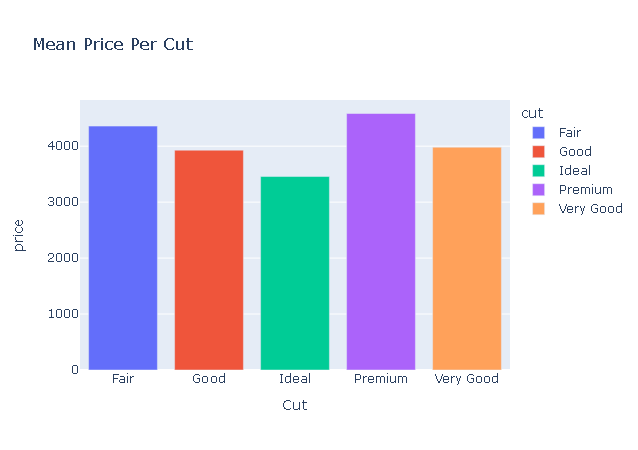
Boring Stuff
Needed to do a bit more to get atleast 75 so here we are.. some filler content.
Enjoy <3
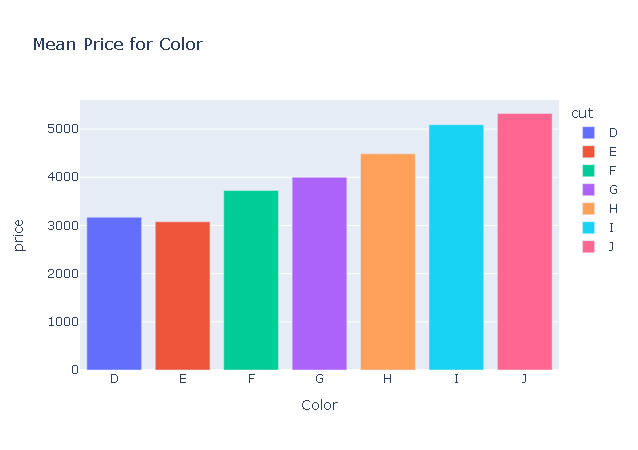
So here we, are some boring graphs as filler content. But as they show there is a distinct price increase for clarity and color but not so much for the cut. This we see relates back to the 4C's of diamond pricing (Carat, Color, Cut, Clarity)
The Money-Shot
Finally after all the "hardwork" we have the ultimate interactive graph.. I call it the Money-Shot.
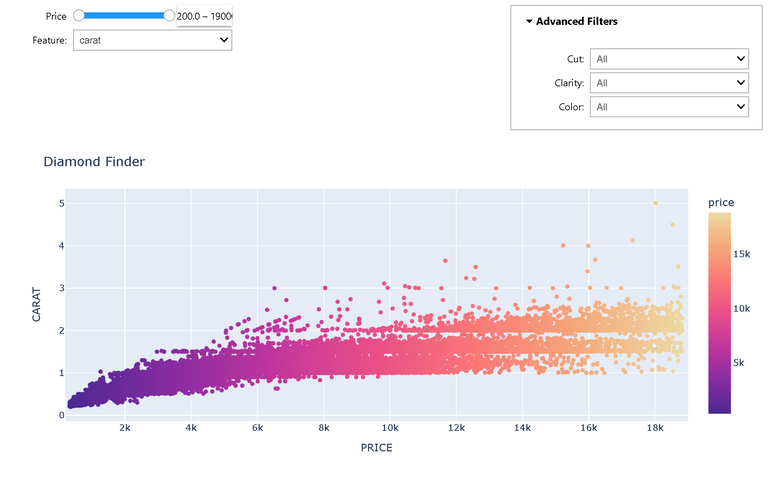
It has everything you'd want to filter, want to filter a specific cut, clarity, and color - you got it, boss. You want to filter multiple cuts, clarities, and colors, too bad you don't get that here :P
Come On Share It?
Well, for that I would need to get permission otherwise I might be flunked for sharing the source-code (as it counts as sharing exam). But if I do get permission, I'll make the GitHub public and update the post :)
So what did you learn?
That I don't need an entire month to do an assignment and I am absolutely awesome.. But in all seriousness, I could probably have added many more features and tested it better had I started earlier, but this is what I get for procrastinating this long.
Oh and on a diamond front, there is a sweet-spot where you can get a real banging diamond for your money (if you had money in this economy) and diamonds have a 12-17% APY compounding value scale, sooo.. I guess buy diamonds?
Final Remarks
It would be neat if I could just submit this as the written assignment part, but I'll write that up tomorrow morning at 7 as this only needs to be in at 12PM so wish me luck or cookies!
It has been an interesting little assignment, and thought I'd share it with the lovely people of Hive :D
Congratulations @deadeagle63! You have completed the following achievement on the Hive blockchain and have been rewarded with new badge(s):
Your next payout target is 50 HP.
The unit is Hive Power equivalent because post and comment rewards can be split into HP and HBD
You can view your badges on your board and compare yourself to others in the Ranking
If you no longer want to receive notifications, reply to this comment with the word
STOPTo support your work, I also upvoted your post!
Check out the last post from @hivebuzz:
Support the HiveBuzz project. Vote for our proposal!
Thanks for your contribution to the STEMsocial community. Feel free to join us on discord to get to know the rest of us!
Please consider delegating to the @stemsocial account (85% of the curation rewards are returned).
You may also include @stemsocial as a beneficiary of the rewards of this post to get a stronger support.
Did you use R to create these?
I used Jypiter notebooks which sits ontop of Python, with Pandas to process the data, Plotly to graph and IPYWidgets to add interactivity ^_^
excellent stuff!