DAX SUM and SUMX Functions
BEST SELLING COURSE
The role of both DAX SUM and SUMX functions is to add numerical data together. Yet both these functions are rather different.
Let's talk about the SUM function first. The SUM function is simple. It takes a column of data and adds the values to give a total. It works like the sum function in Excel but Excel works on cell references or cell ranges and DAX works in columns.
But if you want to filter the data which you are adding, then you need to use the SUMX function. The Syntax is
SUMX(Table, Expression)
Where
Table: is the table containing the rows for which we will carry out the calculation.
Expression: is the calculation that will be evaluated on each row of the table.
Comparing DAX SUMX to Excel, you could say it works a bit like SUMProduct and complex Array formula.
What we will look at today
In this article and video, we are going to look at both SUM and SUMX in DAX. You will learn what is the difference between SUM and SUMX and you will learn when and how you can use both of these DAX function. We will use Power Pivot in our example, but this works the same in Microsoft Power BI.
You might already know these functions, but not understand how they work. To master DAX for PowerPivot or PowerBI you need to know how it operates. So, have a look at the article and video anyway, as we are going to get under the hood of DAX SUM and SUMX functions.
Sign up for my newsletter – Don’t worry, I wont spam – Just useful Excel and Power BI tips and tricks to your inbox
SIGN UP NOW
DAX SUM and SUMX functions
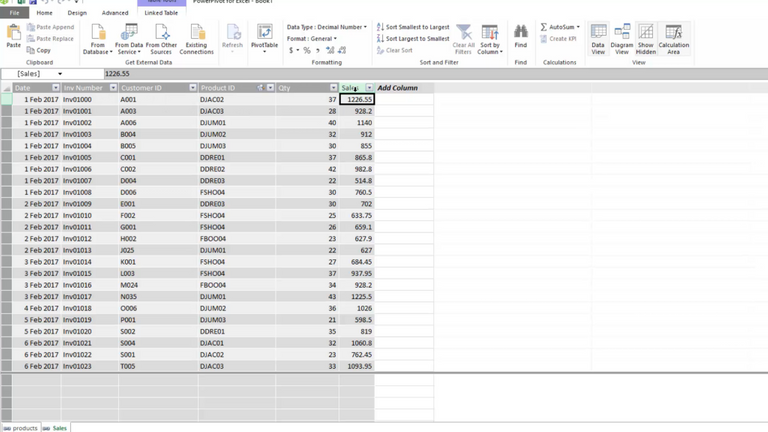
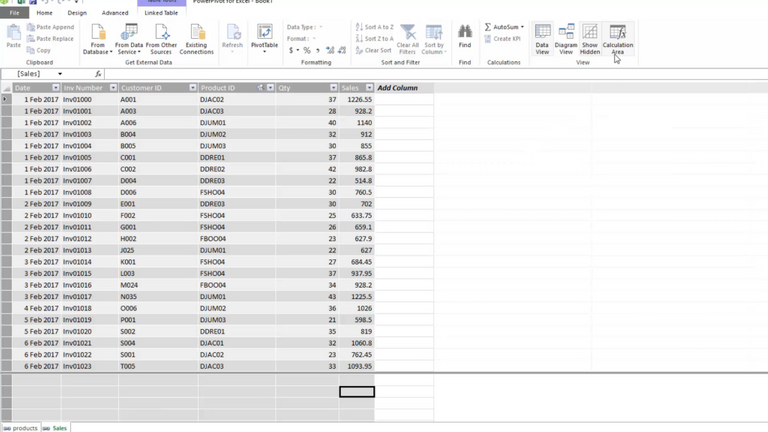
As with all DAX functions, SUM and SUMX within PowerPivot for Excel, Power BI and in Analysis Services. In this example, we will use Excel's Power Pivot.First, we have a sales table. This table contains the following columns:
date, invoice number, customer ID, product ID, quantity and sales.
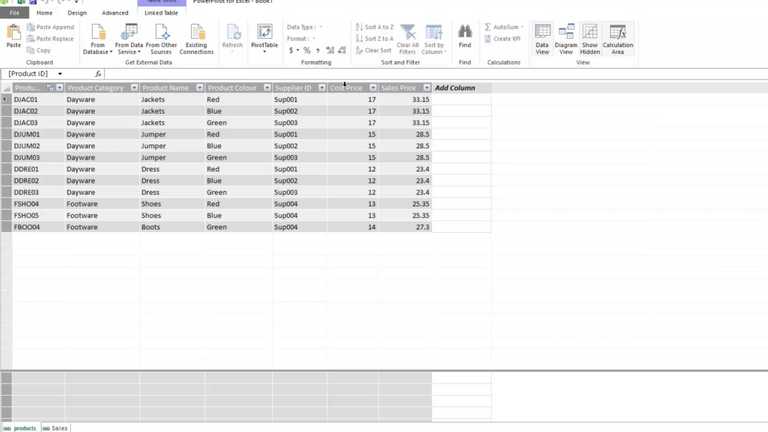
We also have a Product table. The columns in this table are: product ID, category, name, color, supplier ID, cost price and sales price.
The aim is to calculate the total of the sales (or the sum of the sales). And, we will do this in several different ways. First, we’re going to look at the normal SUM function. Then we’re going to look the SUMX function. Finally, we will look at the differences between the two functions and when you should use each one of them.
SUM in DAX
First, you will notice we have a sales column in the sales table. To get a total of these sales we can add in a measure.
In Excel 2013 Power Pivot, you can add a measure from the calculation pane of the screen. If this calculations pane is not visible, from the Home ribbon, you can show(or hide) the calculations pane.
Let’s go ahead and calculate our total for the sales column. By selecting any cell in the calculation area, we can enter our measure. By entering =SUM, you will see in the formula bar, the functions available, like in Excel.
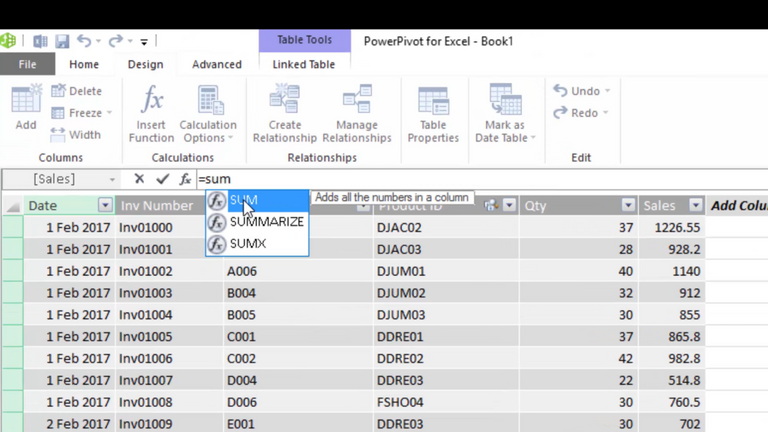
The syntax for SUM is
=SUM([column])
The SUM function looks for a column name. As we enter the table name, which we know to be ‘Sales’, we will see a list of available columns, measures, and functions. The icons beside the names in the dropdown show what they are. An item with the “T” icon indicates a table.
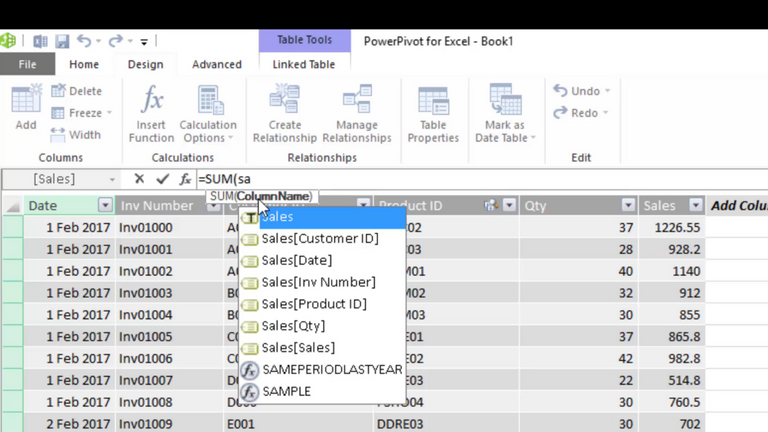
As we want to take our sales column in our sales table, we would select Sales[Sales]. we can then close our formula with a bracket.
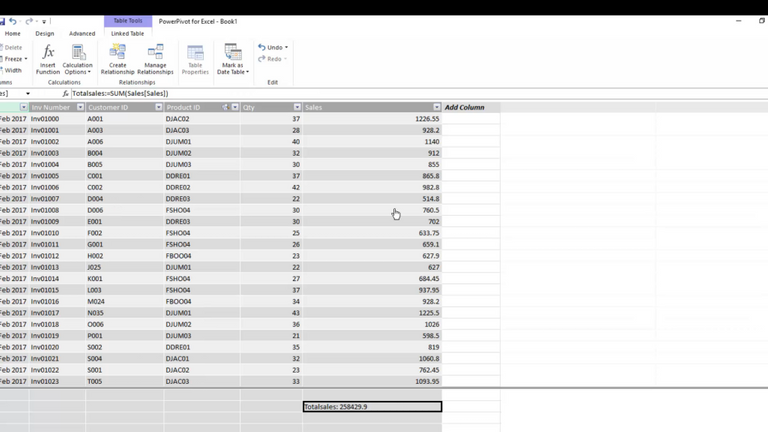
What we’ve done is we have taken a column from a table and we added the values of this column together.
But wait!
What if we didn’t have the sales value in this table? What if we only have the quantity and we wanted to get the total sales?
We do have, in our product table, a sales price. As a relationship joins these tables, we can carry out cross table calculations. From the sales table, we can take the quantity and multiply this by the sales price in the products tables.
RELATED
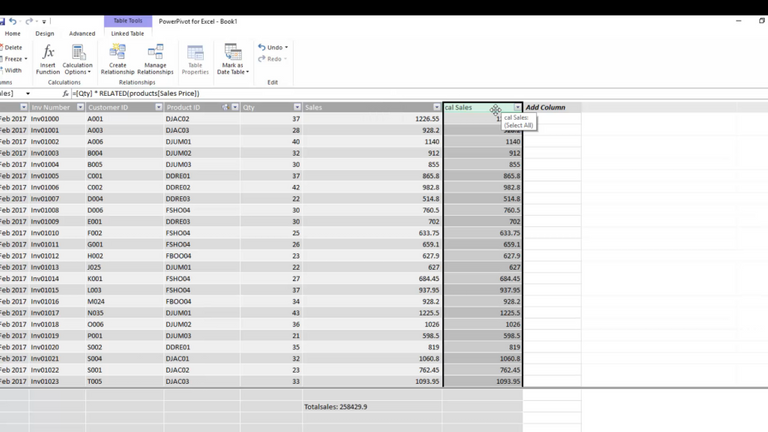
First, we will do this as a calculated column rather than a measure. To multiply a column against a column from a different, but a related table, we need to use the RELATED function. The full expression we need to use is
=[qty] * RELATED(Products[Sales Price]
As with all DAX expressions, we start with equals. We will first select our quantity column as we wish to use this column to calculate the sales value. To do this we need to multiply the values in each row, by the corresponding sales price value in the products table.
To multiply this column, as it is not in the sale table, we need to use the RELATED function. The related function will allow us to reach into a different table and use a related value.
As the calculated column is in the sales table, we need to reach into the related products table to get the sales price.
Reading the Expression
=[qty] * RELATED(Products[Sales Price]
What this expression says is:
In the first row, take the quantity. Then, go over to the table products. Find the related sales price for the particular product and multiply it by the quantity.
DAX will then move down the sales table, row by row and carry out this calculation.
By right-clicking on the column we can rename this column ‘Cal sales’. If we want to get our total sales we now need to SUM our new calculated column. In the measures area enter the following expression
=SUM(Sales(cal sales))
This measure will now add all the values from our calculated column.
Wrapping up SUMX
To note. Calculated columns, when added as a value to a pivot table or chart, will create an implicit measure. This is because the values from columns are aggregated when added to pivot tables and visualizations.
And that’s how we would reach into another table to carry out the calculation and finally get a total Sales value.
But this way is quite long and is very heavy on your computer’s resources. You see DAX stores calculations carried out in a calculated column in the model. Whereas measures are only calculated when they’re needed.
Introducing Row Level calculations in DAX
DAX carries out calculated columns at the row level, one row at a time. In this example, what DAX does is it goes to the first row and in the first row goes to the quantity and takes that value. Then it hops over to the products table and looks for the sales price for the corresponding product. These values are multiplied against each other. Then DAX goes down to the next row and does the same thing for that row, and so on. This is at row level and this is an important concept of DAX to understand. We always carry out calculated columns at row level.
SUMX IN DAX
What we’re going to look at now is another solution to calculate sales.
Let’s assume we didn’t have the sales column in our sales table and we didn’t want a new calculated column. All we want is one measure. Well, what we can do now is use the SUMX function.
The SUMX function will allow you to sum things across different tables. It would remind me of SUMPRODUCT in Excel. Let me show you what I mean.
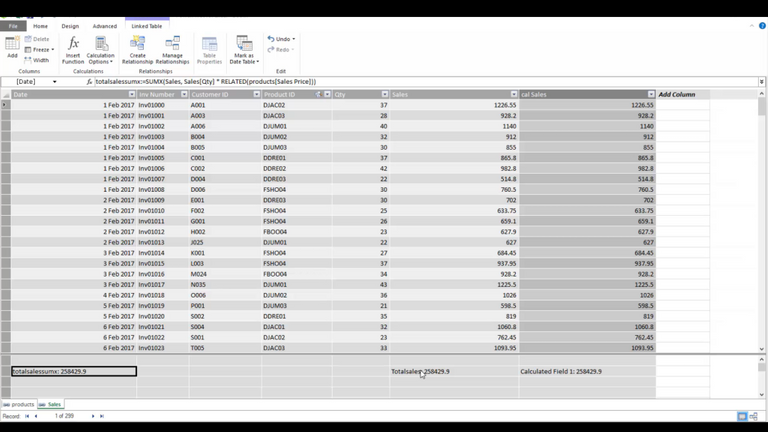
We will create a new measure, and the measure is going to use SUMX.
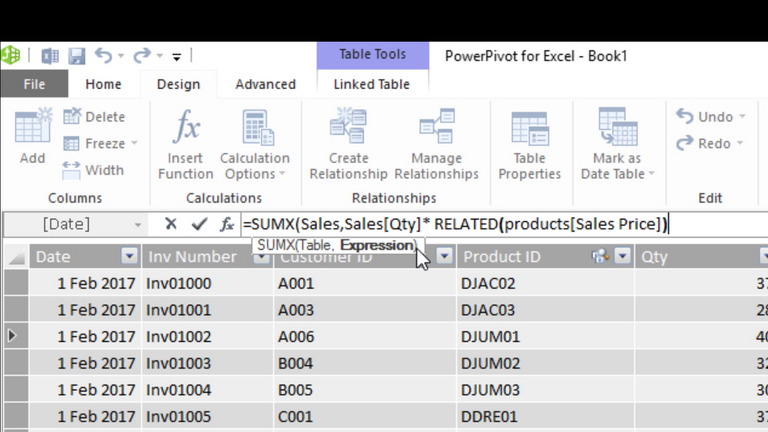
The full measure is
=SUMX(Sales, Sales[Qty]* RELATED(Products[sales price]))
SUMX ‘returns the SUM of an expression evaluated for each row in a table’. It’s a table function and the first thing it looks for is the table.
So, what table is it that this calculation is going to take place in?
Well, the table is going to be our sales table.
Next, DAX says 'what expression do you want to SUM the values from in the sales table?'
An expression is a formula. Our formula is going to be our quantity * sales price. But we need to wrap RELATED to our sales price, as it is from a different table.
Reading the Expression
Reading this formula in English. The formula is saying
'go to the sales table and get the quantity then, multiply the sales quantity by the related product price.'
DAX will go row by row, down the sales table. It will take the sales quantity and multiply it by the related price in the products table. DAX will store the value for each row in its memory. When it gets to the end of the table, DAX will go to the outer formula, SUMX, and will sum all these stored values together.
Calculating total sales using the SUMX function gives us the same result as each of the previous examples. It is important to learn that you don't always need to create a calculated column.
Iterator's
We can slice and we can dice this measure that we create. You see the SUMX function is an iterator. Iterators are something you will come across often in DAX. An Iterator defines the ROW context for a DAX formula. So that means it tells DAX on which rows to carry out a calculation and the filter context used with slicers does not break this. Row context and filter context are different. And they both must be taken into consideration when you’re creating DAX measures.
BEST SELLING COURSE
Learn and Earn Activity
To earn steem rewards on this post, in the comments section below answer the following questions:Before you read this article and watch the video, how would you rate your understanding of SUM and SUMX functions in DAX? Poor, Ok or Great?
How would you rate your understanding now that you have completed the article?
What are your key takeaways from this post?
In return for this article -DAX SUM and SUMX Functions- I ask that you share this post or the video with your friends and colleagues
Sign up for my newsletter – Don’t worry, I wont spam – Just useful Excel and Power BI tips and tricks to your inbox
SIGN UP

Now there is value in Learning with The Excel Club and our Learn and Earn STEEM activities.
Cross posted from my blog with SteemPress : http://theexcelclub.com/dax-sum-and-sumx-functions/
To listen to the audio version of this article click on the play image.

Brought to you by @tts. If you find it useful please consider upvoting this reply.
Good stuff Paula :)
Commentators on this post will get STEM votes from me!
Thanks @abh12345.stem, nice of you to drop by. You should try this, learning power pivot means the transition to powerbi is just learning the interface :-)
Bitcoin and blockchain news read at https://btcmanager.com/
Join telegram https://t.me/btcmanagernews
Before the post, ok. After the post, great. Primary takeaway is the difference in aggregators and iterators.
Yeah aggregators and iterators have different roles in Dax and its an important concept to understand