Calculate 50 & 100-Day Moving Average with DAX
Posted from my blog with SteemPress : http://theexcelclub.com/calculate-50-100-day-moving-average-with-dax/
Following on from last weeks post, Connecting Excel to Coinmarketcap data for live ticker information and historic pricing, I thought I would share with you some basic indicators that you can add to your Excel Cryptocurrency Dashboard. This week we are going to look at calculating 50 and 100-day moving averages using DAX
In the previous post, we connected to the data from coinmarketcap using Excel Power Query and in that tutorial, the data was loaded into Power Pivot. As we did not create any calculations in that post, the reality is, you can load the data straight to Excel and do the same.
However, I suggested it be loaded to Power Pivot, because once you create the model, you can build on it further using DAX calculations. In this post, that’s exactly what we are going to do.
Video – How to calculate the 50 or 100-day moving average for the closing price of a cryptocurrency
In the video below, you will learn how, with the use of DAX, you can calculate the 50-day and 100-day moving averages. To do this we will call on the EARLIER function, which is a function available in DAX that is not available in Excel.
You will notice the video looks at creating the Moving averages of the closing prices. You can amend the function to calculate the averages or other values such as the daily high or low.
This video does not start with last weeks template. I would suggest that you also read this post in full as well as watching the video. The post details how DAX uses the EARLIER function in the calculated columns. The post also contains the exact formulas used if you copied last weeks set up. You can just copy and paste these formulas if you need to.
Working from the model we created last week, you should have already loaded the historic data into Power Pivot and you will have loaded a unique list of coins too. Therefore, you can skip these steps in the video. You also do not need to set up a date table (however a good practice is to have a date table)
You will, however, need to add a column to the Historic Data table in Power Pivot to create a unique key to overcome circular references.
How to calculate 50-day or 100-day Moving Average with DAX
We can calculate a moving average for any duration with DAX in Power Pivot. Once you have loaded the appended table containing the historic pricing for all the coins into Power Pivot, you can begin to create these calculations
What we want DAX to do is look at the date column within the historic pricing table and count back 50 days. Then get the average of the close price for those 50 days. However, we have multiple coins within the table, and we want DAX to calculate the average only for the coin in that row. To do this, we need to create 3 calculated columns.
The first column aims to ensure we have a basepoint to count 50 or 100 days. To do this, we need to identify the earliest date for each coin and number that 1. As we have multiple coins, we will have multiple 1’s. the next date will be 2 and the date after 3 and so forth.
The second column aims to calculate the date 50 days away and we use the third column to calculate the moving average.
Basepoint for moving average – Daynumber column
The first formula is to calculate the basepoint, identifying the earlier date for each coin and numbering this 1, and sequence number the dates after. We can achieve this by counting the rows in the historic table date column where the date is less than or equal to the date of the current row.
=COUNTROWS(Filter('historic data','historic data'[Date]<=EARLIER('historic data'[Date])&&'historic data'[Coin]=EARLIER('historic data'[Coin])))
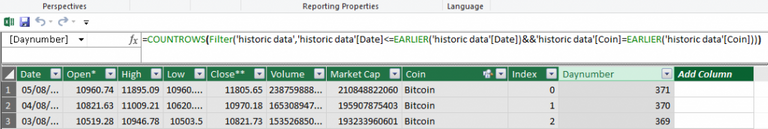
In the first row, the EARLIER functions get the value of 'historic data'[Date] for the current row in the table. Then the second EARLIER function gets the value of the 'historic data'[Coin] for the current row in the table. Next, the FILTER function returns a table where all the rows have a value of 'historic data'[Date] less than the current row and where the 'historic data'[Coin] matched the 'historic data'[Coin] on the current row.
Finally, COUNTROWS counts all the rows in the returned table.
The calculation then moves to the next row and carries out the same steps.
With a base day calculated, we can now use this value to calculate the date with a 50-day distance. We can also calculate this using a calculated column and again we will use the EARLIER function. However, this time we will also use the VALUES function.
Forward 50 days Calculation

=calculate(Values('historic data'[Date]),filter('historic data','historic data'[Daynumber]=earlier('historic data'[Daynumber])-50&&'historic data'[Coin]=earlier('historic data'[Coin])))
In the first row in the data table, the first EARLIER function will return a value of 'historic data','historic data'[Daynumber] – 50, for the current row in the table. The second EARLIER function will return a value for the 'historic data'[Coin] in the current row. FITLER will then return a table where all the rows are a value equal to the 'historic data'[Daynumber]- 50, and where the coin matches the ('historic data'[Coin] on the current row. The VALUES function will take this table and return a single column table with a unique value from 'historic data'[Date]
50 and 100-day Moving Average with DAX formula
In the final calculated column, we can now calculate the average of the closing price over 50 days.
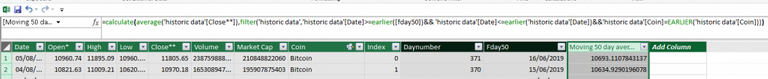
=calculate(average('historic data'[Close**]),filter('historic data','historic data'[Date]>=earlier([fday50])&& 'historic data'[Date]<=earlier('historic data'[Date])&&'historic data'[Coin]=EARLIER('historic data'[Coin])))
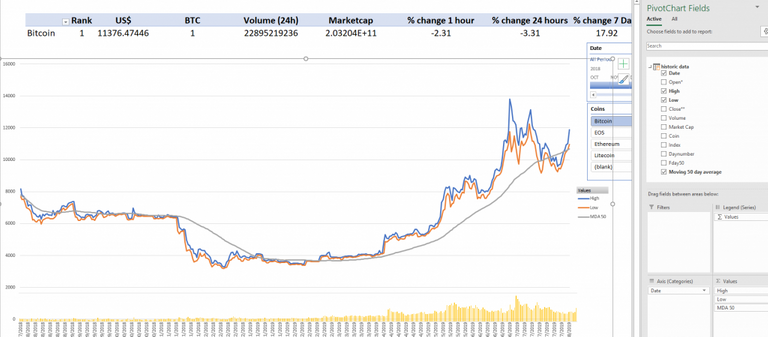
Updating the Visualization
Using the visualization created in last weeks learn and earn activity we can now add a new field to our line chart. In the pivot table fields list, you will find the newly calculated columns for your 50 and 100 day moving average. Add these fields to the values.
Learn and
Earn Activity
To earn Steem tokens post your solution below in the comments section
- Update your model to include the 50 and 100 day-moving average dax functions and share a screenshot in the image below of the updated chart.
- The formula used to calculate the 100-day moving average with dax is
=calculate(average('historic data'[Close**]),filter('historic data','historic data'[Date]>=earlier([fday100])&& 'historic data'[Date]<=earlier('historic data'[Date])&&'historic data'[Coin]=EARLIER('historic data'[Coin])))
In the comments section below, explain in English how this function works.
Sign up for my newsletter – Don’t worry, I won’t spam. Just useful Excel and Power BI tips and tricks to your inbox with Earn and Learn activities.

Now there is value in Learning with The Excel Club and our Learn and Earn STEEM activities.
We are the first Excel, PowerBI and DAX blog in the world where you can Earn while you Learn.
To Find out more now and start earning while you are learning Excel and Power BI
Posted from my blog with SteemPress : http://theexcelclub.com/calculate-50-100-day-moving-average-with-dax/
To listen to the audio version of this article click on the play image.

Brought to you by @tts. If you find it useful please consider upvoting this reply.
Congratulations @theexcelclub! You have completed the following achievement on the Steem blockchain and have been rewarded with new badge(s) :
You can view your badges on your Steem Board and compare to others on the Steem Ranking
If you no longer want to receive notifications, reply to this comment with the word
STOPVote for @Steemitboard as a witness to get one more award and increased upvotes!
Hello Paula. I have made my dashboard and I am really pleased with it. I followed this tutorial and the previous tutorial. I worked on them both during the week. But there is no way to upload the screenshots as per the instructions in the learn and earn activity. What should I do?