CONSTRUIR LA FÓRMULA DE LA PENDIENTE DE UNA RECTA EN EL CONTEXTO DE LA ECONOMÍA./BUILDING THE FORMULA OF THE SLOPE OF A STRAIGHT LINE IN THE CONTEXT OF THE ECONOMY
El contenido de este post trata el estudio de la Pendiente de una Rectay su objetivo es el siguiente:
The content of this post deals with the study of the
Slope of a Lineand its objective is the following:
CONSTRUIR LA FÓRMULA DE LA PENDIENTE DE UNA RECTA EN EL CONTEXTO DE LA ECONOMÍA
CONSTRUIR LA FÓRMULA DE LA PENDIENTE DE UNA RECTA EN EL CONTEXTO DE LA ECONOMÍA BUILDING THE FORMULA OF THE SLOPE OF A STRAIGHT LINE IN THE CONTEXT OF THE ECONOMY
BUILDING THE FORMULA OF THE SLOPE OF A STRAIGHT LINE IN THE CONTEXT OF THE ECONOMY 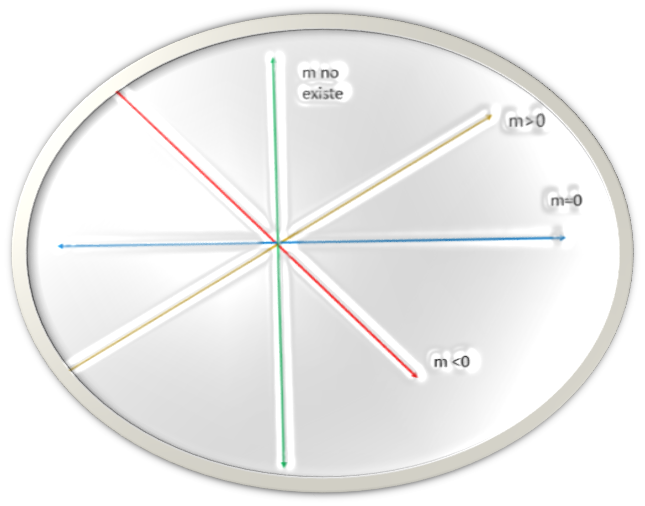
Iniciamos con un concepto muy importante:
We start with a very important concept:
Pendiente de una Recta/Slope of the Line
Pendiente de una Recta/Slope of the LinePara la interpretacion del significado de este concepto, sugerimos construir la representación gráfica del siguiente problema:
La Demanda en el mercado de un artículo q a un precio p, viene dada por la relación: p = -2q + 5.
For the interpretation of the meaning of this concept, we suggest constructing the graphical representation of the following problem:
The demand in the market for an item q at a price p, is given by the relation: p = -2q + 5.
Sugerencias para construir la gráfica
Al trazar la gráfica debemos tener claro el significado de las variables que intervienen en la relación precio-cantidad demandada ya que al identificar las variables se tendrá mayor claridad del problema. Seguidamente, estas variables se indicarán en los ejes coordenados del Plano Real, obviamente la variable independiente es q y la dependiente es p.
Suggestions for constructing the graphWhen drawing the graph we must be clear about the meaning of the variables that intervene in the relationship
price-quantity demandedsince by identifying the variables, the problem will be clearer. Next, these variables will be indicated in the coordinate axes of the Real Plane, obviously the independent variable isqand the dependent variable isp.
Otra cosa importante antes de proceder al graficado, es identificar el tipo de ``gráfica``, esto está vinculado con la ecuación dada, y, en este caso particular se trata de una ecuación de ``primer grado``, o lo que es lo mismo, una ``ecuación lineal ``; esto significa que su gráfica corresponde a ``una recta en el plano cartesiano``. Para proceder a la representación gráfica se deben escoger algunos puntos que satisfagan la ecuación de Demanda, para ello se sugiere elaborar una tabla de valores:
Another important thing before proceeding to the graph, is to identify the type of
graph '', this is linked to the given equation, and, in this particular case it is afirst degree '' equation, or whatever It is the same, alinear equation; This means that its graph corresponds toa line in the Cartesian plane. To proceed with the graphic representation, some points must be chosen that satisfy the Demand equation, for this it is suggested to develop a table of values:
q p
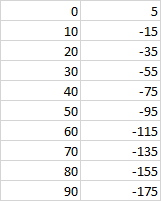
Para cada q en el eje de las abscisas x (eje horizontal) existe un p en el eje de las ordenadas y (eje vertical) lo cual define un par ordenado (q, p) en el plano R2.
For each
q '' on the axis of theabscissa x '' (horizontal axis) there is ap '' on the axis of theordinate y '' (vertical axis) which defines a `` ordered pair (q, p) in plane R 2 .
Veamos la gráfica//Let's see the graph
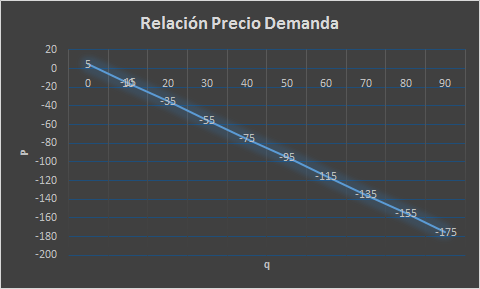
Al ver la gráfica nos planteamos la siguiente pregunta:
¿Qué le sucede al precio p cuando aumenta la demanda?
When we see the graph, we ask ourselves the following question:
What happens to pricepwhen demand q increases?
Para responder a esta pregunta debemos ubicarnos en el contexto de la economía. En este ámbito se conoce como una ley del mercado que nos dice que "a menor precio mayor es la demanda". Por esa razón la gráfica representa una recta decreciente ( a medida que crece la abscisa la ordenada decrece).
To answer this question we must place ourselves in the context of the economy. In this area there is a market law that tells us that "the lower the price, the higher the demand." For this reason, the graph represents a decreasing line (as the abscissa increases, the ordinate decreases).
Relación entre el coeficiente de la variable independiente y el tipo de recta/Relationship between the coefficient of the independent variable and the type of line
En este caso particular se observa que el signo de la variable independiente es negativo. /In this particular case, it is observed that the sign of the independent variable is negative.
Pendiente de la Recta/Slope of the Line
El coeficiente de la variable independiente recibe el nombre de Pendiente de la recta y se denota por la letra m; en el caso particular que hemos estado manejando, m= -2.
The coefficient of the independent variable is called
Slope of the lineand is denoted by the letterm; in the particular case we have been handling,m=-2.
Relación entre el signo de la pendiente y el tipo de recta/Relationship between the sign of the slope and the type of line
Es importante destacar que existe una relación entre el signo de la pendiente y el tipo recta, y es la siguiente: cuando la pendiente tiene signo negativo entonces la recta es decreciente; y, cuando la pendiente es positiva la recta es creciente.
Quizás se estén preguntando ¿Qué pasa si la pendiente es positiva?
Veamos en el siguiente ejemplo un caso donde la pendiente es positiva y consecuentemente la gráfica de la recta corresponde a una recta creciente (a medida que crece la abscisa la ordenada crece):
It is important to note that there is a relationship between the sign of the slope and the type of line, and it is the following: `` when the slope has a negative sign then the line is decreasing; and, when the slope is positive, the line is increasing. ''
You may be wondering what happens if the slope is positive?
Let's see in the following example a case where the slope is positive and consequently the graph of the line corresponds to an increasing line (as the abscissa increases the ordinate increases):
En el siguiente problema estudiaremos el caso que nos ocupa/In the following problem we will study the case at hand
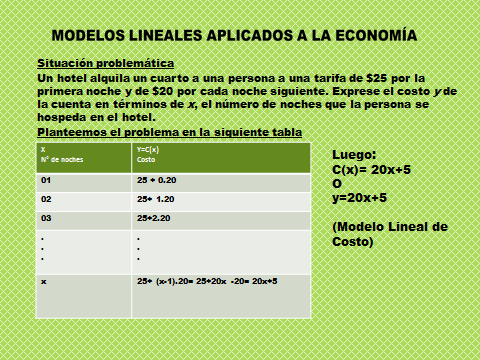
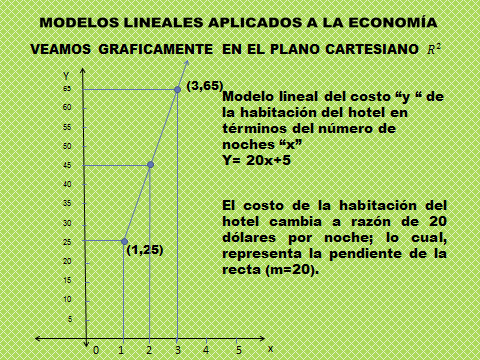
Un hotel alquila una habitación a una persona a una tarifa de $25 por la primera noche y de $20 por cada noche siguiente. Exprese el costo y de la cuenta en términos de x, el número de noches que la persona se ha hospedado en el hotel.
A hotel rents a room to one person at a rate of $ 25 for the first night and $ 20 for each night thereafter. Express the cost y of the bill in terms of x, the number of nights the person has stayed at the hotel.
A continuación en la imagen se encuentra el problema solucionado./Below in the image is the problem solved.
Gráfica/Graph
Comentarios/Comments
En este caso "a medida que aumenta el número de noches de estadía del huésped en el hotel, el costo aumenta", dando como resultado una recta creciente (lo cual se observa en la gráfica).
In this case "
as the number of nights the guest stays at the hotel increases, the cost increases ,,", resulting in an increasing line (which can be seen in the image).
A través de los ejemplos anteriores se ha podido identificar la pendiente de una recta al observar su ecuación, pero ¿Cómo obtenerla? si no se conoce la ecuación o si sólo se conocen los puntos por donde ella pasa.
Through the previous examples it has been possible to identify the slope of a line by observing its equation, but how to obtain it? if the equation is not known or if only the points through which it passes are known.
Fórmula de la pendiente conociendo dos puntos por donde pasa./Slope formula knowing two points through which it passes.
A continuación se da el procedimiento que permitirá construir la fórmula para el cálculo de la pendiente de una recta:
The procedure that will allow building the formula for calculating the slope of a line is given below:
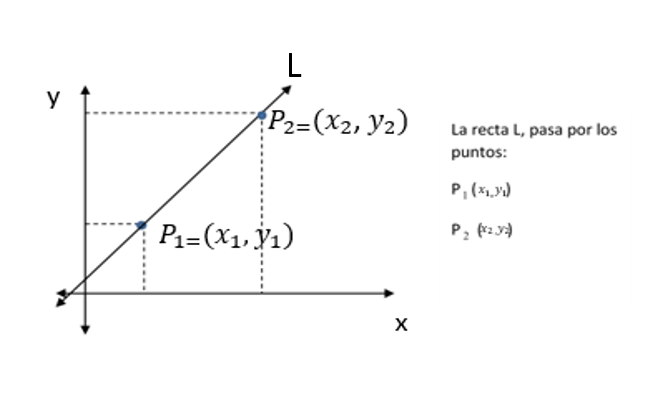
Consideremos que la recta L pasa por los puntos P1= (x1, y1) y P2=(x2, y2)
Let us consider that the line
Lpasses through the points P 1 = (x1 , y 1 ) and P 2 = (x 2 , y 2 )
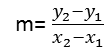
La pendiente m se define como la razón de cambio de la ordenada con respecto a la abscisa. Esto se interpreta como un cociente cuyo numerador denota el cambio en la ordenada y el denominador denota el cambio en la abscisa.
Esto es:
The slope m is defined as the rate of change of the ordinate with respect to the abscissa. This is interpreted as a quotient whose numerator denotes the change in the ordinate and the denominator denotes the change in the abscissa.
This is:
De acuerdo a esta fórmula se puede establececer la relación entre el tipo de recta y el signo de la pendiente./According to this formula, the relationship between the type of line and the sign of the slope can be established.
Ejemplo: /Example:
Calcular la pendiente de una recta que pasa por los puntos:/Calculate the slope of a line that passes through the points:
(3,-5) y (-1, 8)
Solución/Solution
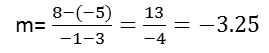
Veamos:/Let's see:
Cuando la recta es creciente significa que si x2 >x1 (la abscisa crece) entonces y2>y1 ( la ordenada también crece).
De tal forma que: y2-y1>0 y x2 -x1>0 y, consecuentemente m>0 (la pendiente es positiva).
Cuando la recta es decreciente significa que si x2 >x1 (la abscisa crece) entonces y2<y1 ( la ordenada decrece).
De tal forma que: y2-y1<0 y x2 -x1>0 y, consecuentemente m<0 (la pendiente es negativa).
When the line is increasingmeans that if x 2 > x 1 (the abscissa grows) then y 2 > y 1 (the ordinate also grows).
In such a way that: y 2 -y 1 > 0 and x 2 -x 1 > 0 and, consequently m> 0 (the slope is positive).
When the line is decreasingmeans that if x 2 > x 1 (the abscissa grows) then y 2 <y 1 (the ordinate decreases).
In such a way that: y 2 -y 1 <0 yx 2 -x 1 > 0 and, consequently m <0 (the slope is negative).
Pendiente de las rectas verticales./Slope of vertical lines.
Una recta vertical es paralela al eje de las ordenadas, por lo tanto cualquier par de puntos que tomemos en su trayectoria tendrán la misma la misma abscisa (x1 =x2) y diferente ordenada (y1≠y2), por lo tanto la razón de cambio o pendiente de esa recta no existe, consecuentemente las rectas verticales no tienen pendiente.
A vertical line is parallel to the axis of the ordinate, therefore any pair of points that we take on its path will have the same abscissa (x 1 = x 2 ) and different ordered (and 1 ≠ and 2 ), therefore the rate of change or slope of that line does not exist, consequently the vertical lines have no slope.
Pendiente de las rectas horizontales./ Slope of horizontal lines.
Una recta horizontal es paralela al eje de las abscisas, por lo tanto cualquier par de puntos que tomemos en su trayectoria tendrán diferentes abscisas (x1 ≠x2) pero iguales ordenadas (y1=y2), por lo tanto la razón de cambio o pendiente de esa recta existe y es 0.
A horizontal line is parallel to the abscissa axis, therefore any pair of points that we take on its path will have different abscissa (x 1 ≠ x 2 ) but equal ordered (y 1 = y 2 ), therefore the rate of change or slope of that line exists and is 0.
Créditos./Credits
El contenido de este post es totalmente inédito y se ha elaborado con ayuda de las herramientas electrónicas Excel y PowerPoint./The content of this post is totally unpublished and has been prepared with the help of the electronic tools Excel and PowerPoint.
Buenas, Su post ha sido propuesto para ser votado a lo largo del día por el witness @cervantes. Un saludo.
Congratulations @analealsuarez! You received a personal badge!
You can view your badges on your board and compare yourself to others in the Ranking