Dear readers, in the previous publication we address aspects related to the organic and mineral fertilizer, in addition to are described in a detailed manner the experimental methodology implemented for the evaluation of some variables agro productive crop of grass Megathyrsus maximus that was fertilized with mineral fertilizer (Urea), organic fertilizer (biological) and another area that is left unfertilized to contrast the effect of such treatments on the crop.
Megathyrsus maximus
 Design made by @amestyj with own images
If you want to know in detail what the treatments were and the methodology used, we invite you to visit the following link
organic-and-mineral-fertilization-in-areas-established-with-pastures-chapter-i
Below, the results obtained are then shared with you:
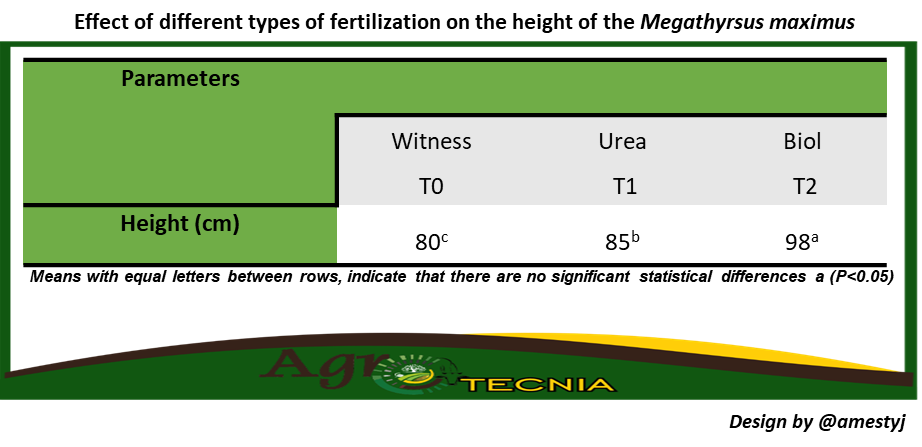
The table shows the average population of the height of the Megathyrsus maximus throughout the experimental period, which showed statistically significant differences between the treatment T2 with respect to the treatments T0 and T1 obtaining values of 98, 80 and 85 cm, respectively, the best growth rates were observed in the T2 (biol) and growth rates lowest were found in the T0 (unfertilized).
These results indicate that the plants reached better growth rates when applied biol dose of 200 l/ha, according to this, Cánovas, (2014) indicates that the height of the plant is increased when it is applied leaf fertilization with doses of 200 l/ha, which in turn is consistent with what had been stated by other authors, who point out that the biol is a kind of promoter of the growth of the plant, as, in the process of elaboration, plant hormones are produced from the wastes of the metabolism of the typical bacteria that act in the anaerobic fermentation process.
- Nutritional quality of the Megathyrsus maximus
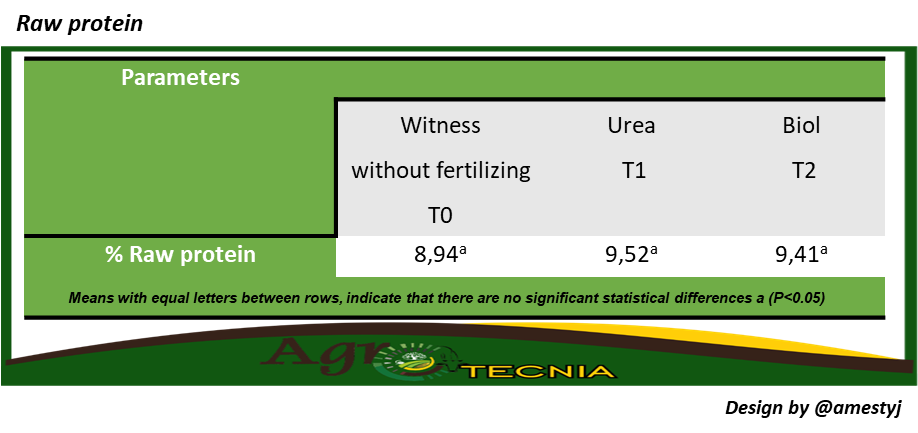
The table shows the means of the percentages of crude protein and there is no statistically significant difference between T0 (8.94%), T1 (9.52%), T2 (9.41%) despite this, quantitatively it was observed that the best percentages of proteins were found in T1 and T2 and the lowest in T0 throughout the experimental period. In this sense, according to what Van soest (1994) pointed out, these values exceed the critical protein levels that are located at 7%.
Within the research highlights that there was no statistically significant difference between the treatments, which is something to consider having in mind that in the two treatments were applied fertilizers in comparison with the witness, this could have occurred because of the short experimental period, since, according to Chacón (2011), when applied organic fertilizer the best results are obtained in longer periods, and our experimental period had a duration of five months, what I know according to the author can influence the bilogical fertilization because we are introducing certain microorganisms into the soil which need a considerable time for the proper decomposition of organic matter which can be reflected in the productive levels of grass crops.
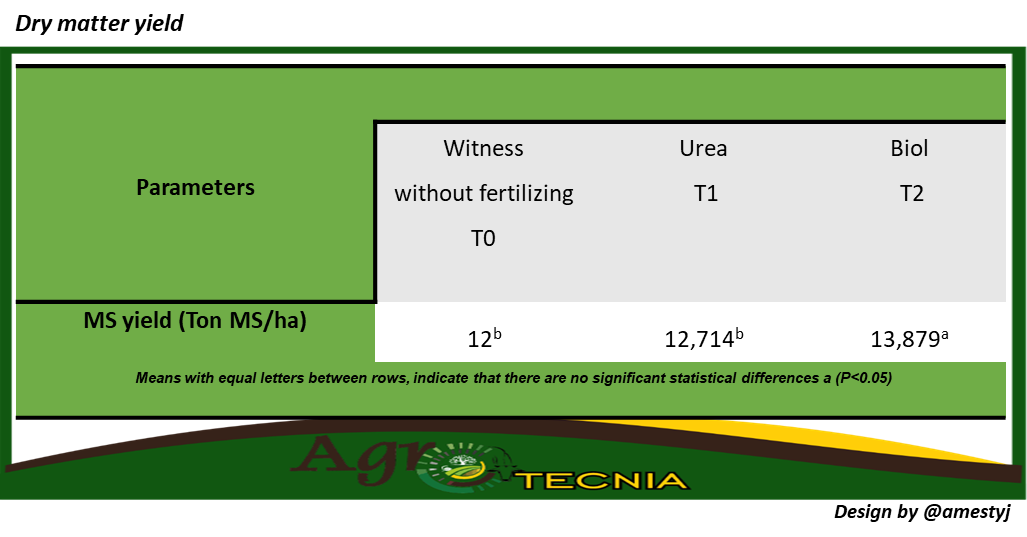
In the table, it is observed on dry matter yield of the grass Megathyrsus maximus where there is statistically significant difference (P<0.05) between the treatment T2 in comparison with the treatments T0, T1, obtaining values of 13,879, 12.714 and 12 ton/ha respectively, the highest yields were achieved with the dose of fertilization of 200 litres/ha of biol and lower yields were found in the rest of the treatments, and although there were no differences between them, the lowest value was obtained in the treatment that does not fertilizo.
These results may be consistent with what reported by Álvarez (2010), who indicated that the biol contains nutrients high in nutritional value that stimulates growth, as well Rodríguez et al (2010), indicates that the growth is defined as the increase in irreversible in the biomass, that is why the highest value of dry matter yield was presented in the T2 fertilized with biol. These values are in accordance with the height variable, which is an indicator of growth since, the higher growth in grasslands is estimated to have a higher yield of green and dry biomass.
Dear readers, this type of experimental trials allows you to collect some data of importance related to the organic fertilization of grassland in tropical areas, that is why you must continue the study of this type of fertilizer in the other forage species because, presents some benefits in crops and pastures, in addition to follow provando the dose of (200lts/ha), which yielded the best results in terms of growth and dry matter yield in several studies.
Until a next installment agro readers.
Alvarado, W, and Medal, R. (2018). Effect of Biol as an organic fertilizer on three cultivars of Pennisetum purpureum. Unpublished undergraduate work. National Agrarian University, Managua Nicaragua.
Avilan, F. and Machado, E. (2015). Influence of organic and chemical fertilization on the agroproductive characteristics of star grass (Cynodon nlemfuensis).Unpublished undergraduate work. UNESUR, Zulia.
Borges, J.; Barrios, M. y Escalona, O. (2012). Effect of organic and inorganic fertilization on agroproductive variables and chemical composition of star grass (Cynodon nlemfuensis). Revista zootecnia Tropical, 30(1), 17-25.
Cánovas, J. (2014). Effect of liquid organic fertilization on established grasslands of guinea grass (Megathyrsus maximus). Unpublished undergraduate work. UNESUR, Zulia.
Comerma, J.; Casanova, E. y Sevilla, V. (n.d.). Experiences and perspectives of the use of fertilizers in grasslands in Venezuela. Unpublished undergraduate work. UCV, Maracay.
Fernández, J. (2015). Evaluation of the effect of different doses of urea application on Mulatto II grass at the Saavedra Agricultural Experimental Station (EEAS) during the rainy season. Unpublished undergraduate work. Centro de Investigación Agrícola Tropical - CIAT Estación Experimental Saavedra (EEAS), Bolivia.
Rodríguez, J.; Gutiérrez, R. y Rodríguez, H. (2010). Dynamics of grazing systems. Mexico: Trillas.


From agrotecnia we reiterate our gratitude to our followers and all the communities that value our agricultural content, this commits us to continue sharing quality information with the whole hive.


Thanks for your contribution to the STEMsocial community. Feel free to join us on discord to get to know the rest of us!
Please consider delegating to the @stemsocial account (85% of the curation rewards are returned).
You may also include @stemsocial as a beneficiary of the rewards of this post to get a stronger support.
Thank you for the support dear friends
Interesting question and experiment! Great initiative! Just one little comment, be careful using the average of percentages, most of the times it doesn't give you an exact number I will give an example:
Plant 1 - 9g of protein in a total of 100 g that means 9% of protein
Plant 2 - 24g of protein in a total of 400g that means 6% of protein , right?
if we take the average of protein percentage (9 + 6) / 200 = 7.5%
However if we do the same with the raw weight of protein / total weight of plants we have a different number, but more precise:
9g+24g = 33g/ (100g+400g) = 6.6%
you can only use the average percentage if the total weight of each plant is the same something like that:
Plant 1 - 9g of protein in a total of 100 g --> 9%
Plant 2 - 24g of protein in a total of 100g --> 24%
9+24 / 200 = 16.5% it is the same calculation in either ways!
Good job anyways =)
!1UP
Click this banner to join "The Cartel" discord server to know more.
Greetings dear @gwajnberg, thank you for your valuable comment that undoubtedly enhances the content, we agree, that if we get the crude weight of protein among the total weight of plants we will get different results.
Generally to determine the quality of the pastures, the sampling is carried out by launching a square of one square meter in 10 luegares within the area equivalent to 1 hectare to be representative, in previous investigations the percentage of protein was determined for each square meter sampled and the weight was also taken, to be more exact.
At present, due to the costs of the analyzes in our country, a sample composed of all the launched quadrats is taken and sent to the laboratory, we are sure that it is less accurate at the experimental level but they are less costs.
These are small tests, the percentage of leaves and stems that are sent also influences the size of the sample, taking into account that the stems are more lignified and have a lower value in terms of the protein present.
Grateful for your comment, have a great week.
You have received a 1UP from @gwajnberg!
@stem-curator, @neoxag-curator
And they will bring !PIZZA 🍕.
Learn more about our delegation service to earn daily rewards. Join the Cartel on Discord.
Thank you for your support dear friends.