Using "Venn Diagrams" as Graphic Organizer to Teach Biology Concept
Hello teachers, students, and researchers, I am here again today, Tuesday, 12th May, 2020, to share a guide on how to Venn Diagram as Graphic Organizer to Teach Biology Concept. Let's consider a topic like Vertebrate.
For as long as there as there have been educators, there has been an unquenchable thirst for superior instructional techniques. Through the years, technological advancements have brought about alternations in pedagogical techniques used by educators in the delivery of their curriculum.
Studies have shown that the use of instructional materials have improved achievement Nwagbo (2006) and George (2008). Instructional materials are wide varieties of equipment and materials use for teaching and learning by teachers to stimulate self-activity on the part of the students. The teaching of biology without instructional materials may certainly result in poor academic achievement. An example of an instructional material is a Graphic Organizer.
What is a graphic Organizer?
Graphic organizers are visual displays of key content information designed to guide learners and to enhance their comprehension. The use of graphic organizers promotes understanding, and enhances organization and long term retention of information.
Graphic Organizers enhance meaningful learning which serves to facilitate learning and minimize boredom. Graphic organizers are fast becoming acceptable standard instructional tools across subjects in the education arena globally.
Types of graphic organisers include: KWL charts, Venn diagram, double bubble map, cluster/word web, storyboard, persuasion map and concept map, T-chart, Main Idea Web and Sequence Chart (Haddad, 2008; Lucidchart, 2019).
A Brief on Venn Diagrams
Venn diagrams innovated by John Venn is a visual organizer used to compare and contrast defined concepts (Venn, 1880). They are made up of two or more overlapping circles. The circles show relationships between defined concepts and allow learners to visually organize similarities and differences between the defining characteristics of the defined concepts.
Venn Diagram as Graphic Organizer
The Venn diagram consists of circles that represent categories of information; these circles overlap to show features that the categories share. Venn diagram is native to mathematics.
A Venn diagram can be used to compare and contrast two or more groups of things by visually displaying their similarities and differences in two or more circles that overlap. Similar information between topics is presented where a circle from one category overlaps with a circle from another category.
In analyzing Venn diagrams, features that do not fit in both categories are placed where the two circles do not overlap. Venn diagrams can serve to increase understanding of a relationship between two or more concepts.
Using Venn Diagrams to teach Biology Concept - Vertebrates
Instructional material:
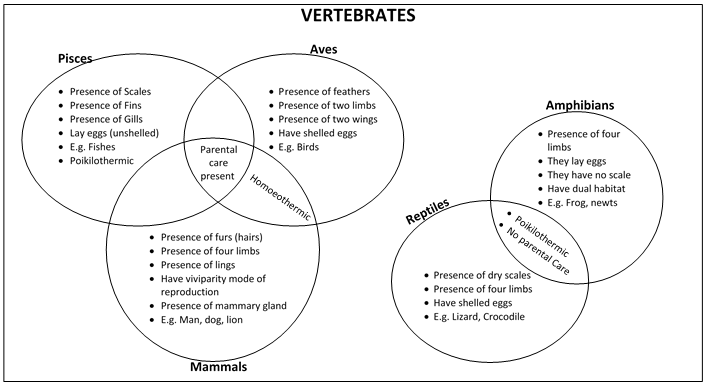
A Venn Diagram showing the classes of vertebrate.
Venn Diagram drawn by Yours Truly
Behavioral objectives:
At the end of lesson, the students should be able to;
a) Define vertebrate;
b) List the five classes of vertebrate;
c) List the characteristics of each classes of vertebrate with their examples;
d) List the similarities and differences between the classes of vertebrates.
Presentation
- Teacher presents Graphic organizer (Venn diagrams) to the students;
- Teacher explains that the circles represent categories of vertebrates;
- Teacher explains that there are five classifications including Pisces, Aves, Mammals, Reptiles, Amphibians;
- Teacher explains that characteristics of each class of vertebrate is written inside the circles;
- Teacher explains that characteristics written in circle parts that overlap each other shows similarities;
- Teacher explains that characteristics written circles that do not overlap shows differences;
- Teacher explains that if more than two circles overlap, that means the characteristic is available in all the categories concerned.
Evaluation:
The teacher ask the student question to ascertain the level of their understanding:
a.) Define vertebrate;
b.) List the five classes of vertebrate;
c.) List the similarities between Aves and Mammals.
d.) List the differences between Reptiles and Amphibians.
References
- George, G. O. (2008). Causes of Poor Achievement in WAEC Biology Examination in Taraba State Secondary Schools. International Journal of Life Sciences and Technology 21(3).
- Nwagbo, C. R. (2006). Effects of two teaching Methods on Achievement and Attitude to Biology of Students of different levels of scientific Literacy. International Journal of Educational Research 216-229.
- Venn, J. (1880). The Diagrammatic and Mechanical Representation of Prepositions. Philosophical Magazine and Journal of Science. 5 10 (59).
- Haddad, D. (2018). 5 Types of Graphic Organizers to Improve Learning (Online) https://www.verywellfamily.com/examples-of-graphic-organizers-2162277
- Lucidchart (2019). Study in Visuals: Types of Graphic Organizers for Education (online) https://www.lucidchart.com/blog/venn-diagram-symbols-explained.
I am your Research Assistant @Uyobong. We hope to meet again tomorrow for some helpful educational research tips. Feel free to use the comment section of this post to ask questions so we can interact the more.
@Education-hive and @Stemsocial have been set as beneficiary to 5% (each) of this post rewards.
Thanks for your contribution to the STEMsocial community. Feel free to join us on discord to get to know the rest of us!
Please consider supporting our funding proposal, approving our witness (@stem.witness) or delegating to the @steemstem account (for some ROI).
Thanks for including @stemsocial as a beneficiary, which gives you stronger support. Using the STEMsocial app could yield even more supporti next time.
and even for that life has no mercy and screws one over
I tutor online and I have been seeing a lot of biology questions relating to Venn diagrams. They are really interesting!
This is really interesting @uyobong. It looks simple and fun to use in teaching kids. I will like to know, how can this diagram be used any other topic or to be specific, topic like plant and their botanical names.