25-03-2024 - Economy - Profit [EN]-[IT]
~~~ La versione in italiano inizia subito dopo la versione in inglese ~~~
ENGLISH
25-03-2024 - Economy - Profit [EN]-[IT]
Profit
For a company, profit maximization and the search for equilibrium conditions are very important for its survival and expansion.
To measure profit, the first thing to do is understand how it is formed.
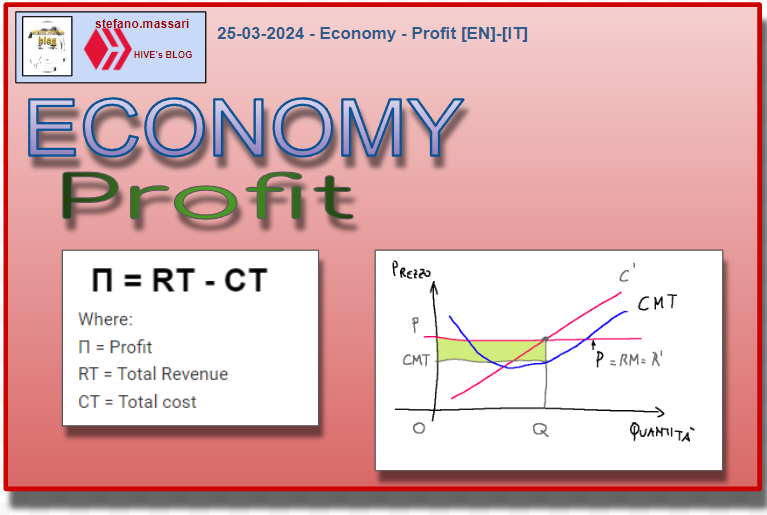
Where:
Π = Profit
RT = Total Revenue
CT = Total cost
We can analyze the formula written above and propose it in another way:

Where:
RT/Q = RM (Marginal Revenue)
CT/Q = CMT (Average Total Cost)
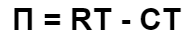
Graph of a profitable company
The red line with P next to it represents the selling price which is fixed to remain on the market. The red line There are costs that increase as the quantities increase.
The blue curve is CMT, i.e. the average total cost.
The chart shows that this company can create profit in the (P-CMT)xQ area
Short-run supply curve
There are two short-run supply curves:
1-Offer from the individual company
2-Market offer
Offer from the individual company
The first will be a graph in which on the abscissas there will be the quantity produced by the company and on the ordinates there will be the price
Market offer
The second will be a graph in which the market quantity will be on the abscissas and the price on the ordinates
Long-run supply curve
When companies can enter and exit the market by operating over a period of time that we can define as long-term. Fixed costs can become variable.
Here the profit, ∏=RT-CT, is measured in economic and non-accounting terms. It means that the opportunity cost must be included in the costs.
So in the long run, active companies are those that produce efficiently, with zero profit.
Long-run equilibrium condition*
This condition is essentially a mutation of the market which inevitably maintains its equilibrium. Below I will try to give an example.
Suppose we are in a long-term market and we are in equilibrium. So we have no new firms entering the market and none exiting.
As time passes, the good produced is increasingly in demand, therefore the demand increases. At this point the price will increase and the companies will be profitable. The fact that there are profitable companies incentivizes other companies to enter this market. As a result, the quantity supplied will increase and the price will fall again. At this point the cycle reaches its conclusion because we will return to a situation of equilibrium again.
Long-run supply curve
Theoretically, long-run market supply curves are horizontal.
Conclusions
Because it is easier to enter and exit in the long run than in the short run, the long-run supply curve is more elastic than the short-run supply curve.
Request
Have you ever participated in the calculation of the profit of any good produced by a company?
![]()
ITALIAN
25-03-2024 - Economia - Il profitto [EN]-[IT]
Il profitto
Per un'impresa la massimizzazione del profitto e la ricerca delle condizioni di equilibrio sono cose importantissime per la sua sopravvivenza e per la sua espansione.
Per misurare il profitto la prima cosa da fare è comprendere come si viene a formare.
dove:
Π = Profitto
RT = Ricavo totale
CT = Costo totale
Possiamo analizzare la formula scritta sopra e riproporla in un altra maniera:
dove:
RT/Q = RM (Ricavo marginale)
CT/Q = CMT (Costo Medio Totale)
Grafico di un'impresa in profitto
La retta rossa con P a fianco rappresenta il prezzo di vendita che è fisso per restare sul mercato. La retta rossa C’ sono i costi che aumentano con l’aumentare delle quantità.
La curva azzurra è CMT, cioè il costo medio totale.
Il grafico mostra che questa azienda può creare profitto nell’area (P-CMT)xQ
Curva di offerta di breve periodo
Le curve di offerta di breve periodo sono due:
1-Offerta della singola impresa
2-Offerta di mercato
Offerta della singola impresa
La prima sarà un grafico in cui sulle ascisse ci sarà la quantità prodotta dall’impresa e sulle ordinate ci sarà il prezzo
Offerta di mercato
La seconda sarà un grafico in cui sulle ascisse ci sarà la quantità di mercato e sulle ordinate il prezzo
Curva di offerta di lungo periodo
Quando le imprese possono entrare ed uscire dal mercato operando in un arco di tempo che possiamo definire di lungo periodo. I costi fissi possono diventare variabili.
Qui il profitto, ∏=RT-CT, si misura in termini economici e non contabili. Significa che nei costi bisogna comprendere il costo-opportunità.
Quindi nel lungo periodo le imprese attive sono quelle che producono in termini efficienti, con profitto nullo.
Condizione di equilibrio di lungo periodo*
Questa condizione è in sostanza una mutazione del mercato che per forza di cose mantiene il suo equilibrio. Qui di seguito provo a fare un esempio.
Supponiamo di essere in un mercato di lungo periodo e che siamo in equilibrio. Quindi non abbiamo nessuna nuova impresa che entra nel mercato e nessuna che esce.
Con il passare del tempo avviene che il bene prodotto è sempre più richiesto, quindi aumenta la domanda. A questo punto il prezzo aumenterà e avremo che le imprese saranno in profitto. Il fatto che ci siano delle imprese in profitto incentiva altre imprese ad entrare in questo mercato. Di conseguenza la quantità offerta aumenterà ed il prezzo tornerà a scendere. A questo punto il ciclo arriva alla sua conclusione perché si tornerà di nuovo in una situazione di equilibrio.
Curva di offerta di lungo periodo
Teoricamente le curve di offerta di mercato di lungo periodo sono orizzontali.
Conclusioni
Siccome è più facile entrare ed uscire nel lungo periodo piuttosto che nel breve periodo, la curva di offerta di lungo periodo è più elastica della curva di offerta di breve periodo.
Domanda
Avete mai partecipato al calcolo del profitto di un qualsiasi bene prodotto da un'azienda?
THE END
Congratulations @stefano.massari! You have completed the following achievement on the Hive blockchain And have been rewarded with New badge(s)
You can view your badges on your board and compare yourself to others in the Ranking
If you no longer want to receive notifications, reply to this comment with the word
STOPCheck out our last posts:
There must have been so much effort you are putting in daily to make sure we understand this your lecture
Hi @precab , Sometimes when I reread what I write it seems to me that it could be even clearer. With time I believe I can get better and better at being clearer and clearer. In this article I describe the long-run supply curve. We can summarize this like this.
If companies already present in the market achieve positive profits, other companies will be interested in entering.
The entry of new companies increases the quantity produced, decreasing the price and therefore profits.
!DHEDGE
@discovery 35
Grazie Liberty, in questo articolo parlo delle condizioni di equilibrio di mercato su lungo periodo. In questo le imprese attive hanno un profitto nullo, nessuna impresa entrante e nessuna in uscita.
This is really simple but the part of the graph made it hard for me. Right from school, I have always ran away from anything that has graph, lol
Lazy me
Thanks for stopping by...The graphs in the business sector and especially in the case of profit measurement graphs, serve more than anything else to identify the extent to which a company remains profitable and at what point it begins to lose money in producing a certain product.
Non ho partecipato, ma in alcuni incontri condividono con noi l'argomento, generalmente questi incontri sono di persona, un'occasione per uscire di casa che mi piace
Ritengo comunque bello che vi fanno partecipare ad incontri dove i parla degli eventuali profitti o perdite. Alla conclusione di tutti gli argomenti fatti in questo articolo possiamo dire quanto segue. Siccome è più facile entrare ed uscire nel lungo periodo piuttosto che nel breve periodo, allora la curva di offerta di lungo periodo è sicuramente più elastica della curva di offerta di breve periodo. Ultima cosa.. teniamo presente che in un mercato di lungo periodo i profitti tendono sempre a diminuire