Exam Problem by Dr. Judy Wood: Space Shuttle Columbia Disaster

https://play.3speak.tv/embed?v=mes/ta0jgic7
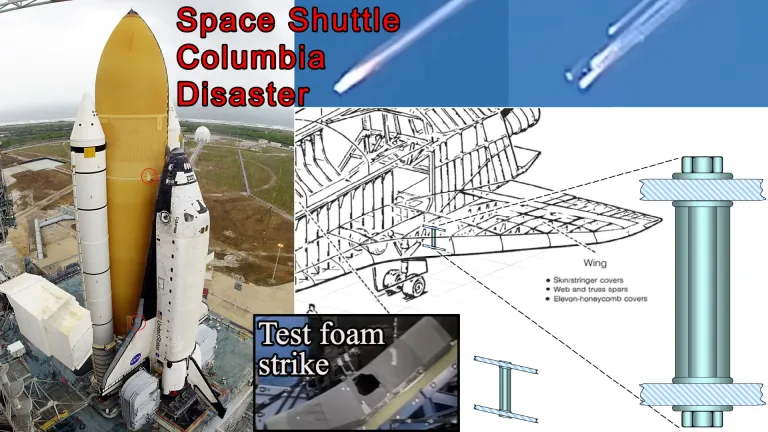
In this video, I go over an exam problem that Dr. Judy Wood gave her Mechanics of Materials class on February 6, 2003, in which she solved the cause of the Space Shuttle Columbia disaster that had occurred just 5 days prior. After seeing the news coverage of the disaster, which had also shown footage of the left wing being hit weeks prior on January 16 during takeoff, Dr. Judy Wood turned it into a classic thermal expansion problem. Assuming a thermal tile was broken off from the debris impact, the aluminum tube connecting the top and bottom support plates of the left wing would thus be exposed to high temperature during re-entry. As the aluminum tube wants to expand, it is prevented from doing so by the support plates, thus producing a compressive force in the tube. This compressive force also acts as bearing stress and shear stress on the plate. The problem involves finding the location of failure, deduced from the lowest temperature to failure. Months later, the Columbia Accident Investigation Board (CAIB) came to the same conclusion as Dr. Judy Wood, even experimentally validating it too with a test foam strike. Her students then gave her the nickname "The Disaster Queen"!
Later in this video, I cover the Space Shuttle Columbia disaster and some of the controversial aspects of the disaster, including possible knowledge or carelessness on investigating the left wing damage during the life of the flight.
MES - 3Speak - YouTube - PDF Notes Playlist - mes.fm/math
Timestamps
- 0:00 Intro
- 2:19 Introduction: EM 304 Test Problem 1
- 3:44 Topics to Cover
- 6:43 Live Footage of the Space Shuttle Columbia Disaster
- 11:28 Problem 1 of EM 304 – Test #1 – February 6, 2003
- 23:52 Solution: Review of Mechanics of Materials
- 24:28 Strain and thermal expansion
- 28:28 2014-T6 Aluminum Alloy
- 31:58 Elastic Constants
- 33:10 Young's modulus
- 33:35 Stress
- 36:44 Shear modulus
- 38:11 Shear stress
- 40:09 Poisson's ratio
- 44:25 Thermal Expansion Properties of the Support Plates and Aluminum Tube
- 44:45 Strength Limits (Allowable Stresses)
- 46:59 MES Mechanics of Materials Calculator: https://mes.fm/materials
- 51:21 Solution to Part (a): Maximum temperature without failure
- 1:03:45 Candidate 1: Aluminum tube in compression (point C)
- 1:08:34 Candidate 2: Plate bearing at the tube end (point B)
- 1:12:17 Candidate 3: Shear at the plate connection (point A)
- 1:30:00 Solution to part (b): Where it fails first
- 1:31:02 Solution to part (c): Stress state at the failure temperature
- 1:35:32 Solution to part (d): Volume-element sketches
- 1:42:32 Summary of the Engineering Logic
- 1:43:17 Dr. Judy Wood solved the Space Shuttle Columbia Disaster right away!
- 1:52:00 CAIB Investigator Scott Hubbard April 15, 2003 presentation confirmed Dr. Judy Wood's analysis
- 1:59:15 Space Shuttle Columbia Disaster
- 2:10:41 Columbia Accident Investigation Board (CAIB)
- 2:16:27 CNN Anchor Judy Woodruff transcript of CNN's February 6, 2003 Live Columbia Memorial
- 2:17:29 News footage of the Columbia disaster
- 2:19:47 Grok AI List of Controversies Surrounding the Disaster
- 2:28:26 Outro
#math #science #nasa #space #engineering
Links
MES - Donate - Telegram - MES Truth: @mestruth on Hive & YouTube - Where Did the Towers Go? by Dr. Judy Wood
- Reuse of my videos: Feel free to make use of / re-upload / monetize my videos as long as you provide a link to the original video.
- Fight back against censorship: Bookmark sites/channels/accounts and check periodically. Archive webpages - Hive blockchain tutorial
- Playback videos fast
Introduction: EM 304 Test Problem 1
This is a problem for Mechanics of Engineering course EM 304 that Dr. Judy Wood, author of the famous book Where Did The Towers Go, gave to her class in Clemson University on February 6, 2003.
She has sent me the test problem and solutions key so that I can make this tutorial.
- View/download the PDF here: https://mes.fm/em-304-problem-1-judy-wood
- View these notes in article format: https://mes.fm/space-shuttle-columbia
Topics to Cover
- Live Footage of the Space Shuttle Columbia Disaster
- Problem 1 of EM 304 – Test #1 – February 6, 2003
- Solution: Review of Mechanics of Materials
- Strain and thermal expansion
- 2014-T6 Aluminum Alloy
- Elastic Constants
- Young's modulus
- Stress
- Shear modulus
- Shear stress
- Poisson's ratio
- Thermal Expansion Properties of the Support Plates and Aluminum Tube
- Strength Limits (Allowable Stresses)
- MES Mechanics of Materials Calculator: https://mes.fm/materials
- Solution to Part (a): Maximum temperature without failure
- Candidate 1: Aluminum tube in compression (point C)
- Candidate 2: Plate bearing at the tube end (point B)
- Candidate 3: Shear at the plate connection (point A)
- Solution to part (b): Where it fails first
- Solution to part (c): Stress state at the failure temperature
- Solution to part (d): Volume-element sketches
- Summary of the Engineering Logic
- Dr. Judy Wood solved the Space Shuttle Columbia Disaster right away!
- CAIB Investigator Scott Hubbard April 15, 2003 presentation confirmed Dr. Judy Wood's analysis
- Space Shuttle Columbia Disaster
- Columbia Accident Investigation Board (CAIB)
- CNN Anchor Judy Woodruff transcript of CNN's February 6, 2003 Live Columbia Memorial
- News footage of the Columbia disaster
- Grok AI List of Controversies Surrounding the Disaster
Live Footage of the Space Shuttle Columbia Disaster
Footage from February 1, 2003 of the disaster can be seen at the 1:48 timestamp, as the space shuttle is disintegrating upon entry through the atmosphere:


At the 43:31 timestamp, the thermal tile damage is mentioned as a possible cause: https://youtu.be/hkrf8Jjv0tw?t=2611
Here is footage of the thermal tile damage during the launch on January 16, 2003, in which a piece of foam from the rocket booster breaks off and strikes the left wing: https://youtu.be/IgQ3ekcvyRA

Problem 1 of EM 304 – Test #1 – February 6, 2003
Last Saturday (February 1, 2003), the space shuttle Columbia disintegrated during re-entry through the Earth's atmosphere.
One possible cause could be the loss of thermal tiles…


- Assume tiles were lost in the localized zone shown below, exposing just one of the many aluminum stiffening tubes, connected to both the top and bottom framework of the wing.
- Assume the remaining structure is completely insulated from the heat and remains at 0°F.
- Assume the one exposed tube is heated uniformly.
- At 0°F, the aluminum tube is stress free and there are no gaps.
- Heat shields insulate the structure from temperature variations, as shown below.
- Assume the top and bottom of the framework is made of a solid plate.


Material properties:
- L = constant
- Note this is the length of the aluminum tube within the structural support surfaces (support plates) as shown in the earlier figure above.
- Δtmax = 3,000°F (maximum possible)
- From wiki: During re-entry, the thermal protection system (TPS) experienced temperatures up to 3,000 °F (1,648 °C), but had to keep the orbiter vehicle's aluminum skin temperature below 350 °F (180 °C).
Top and Bottom plates:
- αplate = 0.00 με/°F
- Eplate = ∞, G = ∞, v = 0 (rigid)
- τmax = 10.2 ksi
- σmax = 104 ksi (tension)
- σmax = 74 ksi (compression)
Aluminum (2014-T6):
- αal = 12.8 με/°F
- Eal = 10.6 Msi, G = 3.9 Msi, v = 0.34
- τmax = 19 ksi
- σmax = 60 ksi (tension)
- σmax = 60 ksi (compression)
Given the properties above:
(a) Determine the maximum temperature of the aluminum tube without causing failure at point A, B, or C.
- Note: Failure may occur in the plate or the tube.
(b) Where is it most likely to fail first (choose location A, B, or C). Why?
- Justify your answer with calculations.
(c) Using your answer from part (a), calculate the stress state in locations A, B, and C at the failure temperature.
(d) Show these stresses (from part (c)) on each of the volume elements (A, B, and C) provided on above, representing the state of stress at each of the three locations.
Note: Volume elements C, B, and A are provided below.
Location descriptions:
- Point A: zone of material inside top plate
- Point B: surface of plate facing tube end, and surface of tube end facing plate
- Point C: zone of material in outer surface of the aluminum tube.
Solution: Review of Mechanics of Materials
Note that I will be using Grok AI's assistance in the solution, as well as Dr. Judy Wood's solution key: https://grok.com/share/c2hhcmQtMg_4766b37c-cfd8-4dea-897f-42a2e51d1568
Let's first cover some of the mechanics of materials terms first.
Strain and Thermal Expansion
We are given the thermal strain for the support plates and aluminum tube, via their coefficients of thermal expansion:
- αplate = 0.00 με/°F
- αal = 12.8 με/°F
Strain is the relative deformation compared to a reference position, and has SI base units of meter per meter (m/m).
α is the coefficient of linear thermal expansion (tendency of matter to increase in size with increasing temperature).

Figure: Expansion joint in a road bridge used to avoid damage from thermal expansion.

The units με/°F = microstrain per degree Fahrenheit = 10-6 strain per °F.
10-6 strain corresponds to 1 unit of length changed per 1,000,000 unit of length, aka 1 part per million.
For example, aluminum expands by 12.8 millionths of an inch per inch of length for every 1 °F temperature increase.
The plates are assumed to not expand at all with temperature, hence αplate = 0.
2014-T6 Aluminum Alloy
2014 aluminium alloy (or aluminum in USA / Canada) is an aluminum-based alloy often used in the aerospace industry.
The T6 refers to the tempering process used, which is a process of heat treating used to increase the toughness of (typically) iron-based alloys.

Figure: Differentially tempered steel. The various colors produced indicate the temperature the steel was heated to. Light straw indicates 204 °C (399 °F) and light blue indicates 337 °C (639 °F).[1][2]

The T6 temper involves solution heat-treating and artificially aging until the metal meets standard mechanical property requirements.

The graph bars on the material properties cards above compare 2014-T6 aluminum to: 2000-series alloys (top), all aluminum alloys (middle), and the entire database (bottom). A full bar means this is the highest value in the relevant set. A half-full bar means it's 50% of the highest, and so on. For example, the Brinell Hardness and Elastic Modulus of 2014-T6 aluminum is very high compared with other aluminum alloys.
Elastic Constants
We are given the elastic constants for the support plates and aluminum tube:
- Eplate = ∞, G = ∞, v = 0 (rigid)
- Eal = 10.6 Msi, G = 3.9 Msi, v = 0.34
Young's modulus (or the Young modulus), E, is a measure of the tensile or compressive stiffness when a force is applied lengthwise.
Young's modulus is given by the equation of stress (force per unit area) divided by the strain.

Stress (σ for axial stress) describes the forces present during deformation.

Figure: Mechanical stress


Figure: Idealized stress in a straight bar with uniform cross-section.


Figure: The slope of the linear part of the stress–strain curve for a material under tension or compression
Figure: Relationship between Young's modulus and deformation under stretching aluminum
The Shear Modulus or modulus of rigidity, G or sometimes S or μ, is a measure of the elastic shear stiffness of a material and is defined (hence the := sign) as the ratio of shear stress to shear strain.


Figure: Shear strain

Shear stress, τ, is the component of stress coplanar (on the same plane) with a material cross section. It arises from the shear force, the component of the force vector parallel to the material cross section. Normal stress, on the other hand, arises from the force vector component perpendicular to the material cross section on which it acts.


Figure: Side view of a parallelepiped where a shearing force is applied to the top of a rectangular cuboid while the bottom is held in place. The resulting shear stress, τ, deforms the cuboid's rectangular side into a parallelogram. The area involved would be the top of the parallelopiped.

Poisson's ratio, ν, is a measure of the Poisson effect, the deformation (expansion or contraction) of a material in directions perpendicular to the specific direction of loading.

Figure: Poisson's ratio of a material defines the ratio of transverse strain (or lateral strain) (x direction) to the axial strain (y direction).


Figure: A cube with sides of length L of an isotropic linearly elastic material subject to tension along the x axis, with a Poisson's ratio of 0.5. The green cube is unstrained, the red is expanded in the x-direction by ΔL due to tension, and contracted in the y- and z-directions by ΔL′.


Thermal Expansion Properties of the Support Plates and Aluminum Tube
In summary, the support plates are considered idealized as perfectly rigid and non-expanding, hence having a coefficient of thermal expansion of zero, an infinite Young's modulus, infinite shear modulus, and a Poisson's ratio of zero.
While the aluminum tube has a coefficient of thermal expansion of 12.8 με/°F, a Young's modulus of 10.6 Msi (million psi aka million pounds per square inch), shear modulus of 3.9 Msi, and Poisson's ratio of 0.34 (the transverse strain is 34% of axial strain).
Strength Limits (Allowable Stresses)
We are also given the following strength limits for the support plates and the aluminum tube, at which the material is considered to fail (either yield or ultimate strength, depending on the design criteria):
Plates:
- τmax = 10.2 ksi = maximum allowable shear stress
- σmax = 104 ksi (tension) = maximum allowable normal stress in tension
- σmmax = 70 ksi (compression) = maximum allowable normal stress in compression
Aluminum:
- τmax = 19 ksi
- σmax = 60 ksi (tension)
- σmax = 60 ksi (compression)
Note that ksi = kips per square inch = 1000 pounds per square inch = 1000 psi
MES Mechanics of Materials Calculator: https://mes.fm/materials
Play around with it and let me know what you think!
I made it with Claude Code AI.
Solution to Part (a): Maximum temperature without failure
Determine the maximum temperature of the aluminum tube without causing failure at point A, B, or C.
Note: Failure may occur in the plate or the tube.
Let's look at locations A, B, and C in the earlier given diagrams, also shown below.
We are given that the one aluminum tube is exposed and heated uniformly while the top and bottom support plates (and the rest of the structure) stay at 0 °F.
At 0 °F the aluminum tube is stress-free and there are no gaps.
The plates are modeled as rigid (E = ∞, G = ∞, v = 0, α = 0), so the length L of the tube is fixed.
Only the exposed tube wants to expand due to thermal expansion; the rigid plates prevent that expansion, producing compressive force in the tube and equal-and-opposite reactions on the plates.
Failure can occur in the aluminum tube or in the plates (bearing or shear).
Because L is constant:


Candidate 1: Aluminum tube in compression (point C)
If the first failure is aluminum in compression, then the maximum temperature is:

60,000/(10.6*12.8) = 442.217
Candidate 2: Plate bearing at the tube end (point B)
The support plate's compressive allowable stress is given as σmax = 70 ksi.

If the point at B fails, then the compressive stress is greater than 70 ksi.
But we have already checked the point at C, which has a compressive strength of 60 ksi in the aluminum tube, thus the aluminum controls as it would fail before the plate does.
Since the support plates are idealized as rigid and non-expanding, we can't just plug in α = 0 and E = ∞ into the earlier ΔT formula to obtain the temperature at this higher stress.
As the aluminum tube expands due to thermal expansion, this expansion imposes stress on the support plate as well.
Thus, we can obtain the maximum temperature that the support plate will fail at by simply scaling up our earlier maximum temperature by the ratio of the compressive strength of the support plate to the aluminum tube.

Note again that the aluminum tube at point C will fail before this temperature is reached at point B in the support plate.
70/60 * 442.217 = 515.9198
Candidate 3: Shear at the plate connection (point A)
First note that we are told to assume that the "remaining structure is completely insulated from the heat and remains at 0 °F".
The skin of the wing, aka the support plate, is not affected by the temperature, but it is affected by the thermally expanding aluminum tube.
This thermal expansion of the aluminum tube causes shear stress on the support plate, at the point A.

Thus, by equilibrium:

Recall that the maximum allowable compressive stress in the aluminum is 60 ksi, while the maximum allowable shear stress in the support plate is 10.2 ksi.
Thus we can now obtain the corresponding temperature increase of the aluminum tube that would cause the support plate to fail in shear.

10,200/(10.612.8)(0.3/0.11) = 205.0279
This is the lowest temperature rise!
Therefore the maximum allowable temperature of the tube is 205 °F.
Solution to part (b): Where it fails first
Where is it most likely to fail first (choose location A, B, or C). Why?
Justify your answer with calculations.
The three candidate temperatures are approximately:
- A: 205 °F
- B: 442 °F
- C: 516 °F
Thus the failure occurs first at point A, which is shear in the support plate at the tube connection.
Solution to part (c): Stress state at the failure temperature
(c) Using your answer from part (a), calculate the stress state in locations A, B, and C at the failure temperature.
We can use our earlier equation relating aluminum compressive stress to the plate shear stress:
Note that Dr. Judy Wood used the stress-strain-temperature equation to obtain this corresponding compressive stress, both choices work.

10.2*(0.3/0.11) = 27.8182
At point C (outer surface of the aluminum tube), we have uniaxial compression of 27.8 ksi.
At point B (interface): the same compressive force acts as bearing stress on the plate and as axial stress on the tube end.
Because the force is limited by shear capacity at A, the bearing stress is well below the plate allowable (70 ksi).
At point A (inside the plate), the stress state is pure shear at the maximum allowable shear stress in the plate, which was given as 10.2 ksi.
Solution to part (d): Volume-element sketches
(d) Show these stresses (from part (c)) on each of the volume elements (A, B, and C) provided below, representing the state of stress at each of the three locations.
Note: Volume elements C, B, and A are provided below.
On the provided volume elements, the stresses at ΔT = 205 °F are shown below:


Summary of the Engineering Logic
Because the plates are rigid, the aluminum tube develops compressive stress linearly with temperature.
The connection, however, can transmit only a limited shear force before the plate fails in shear.
That force limit is reached at only 205 °F, which is well before the aluminum itself reaches its 60 ksi compressive yield.
Hence the first failure is shear at the plate-to-tube interface (point A).
Dr. Judy Wood solved the Space Shuttle Columbia Disaster right away!
Dr. Judy Wood gave this test to her EM 304 class just 5 days after the Space Shuttle Columbia disaster, and months later NASA officially came to the same conclusion!
Here is a Gemini AI summary of emails that Dr. Judy Wood sent me regarding how she rapidly analyzed and solved the failure mechanism.
- Identifying the Thermal Tile Issue:
- Following the disintegration of the Space Shuttle Columbia on February 1, 2003, Dr. Wood watched the lift-off footage on television and analyzed the foam strike.
- She noticed that the foam made a right-angle turn and "dustified" upon impact, indicating it was a hard, significant hit rather than a light grazing.
- Recognizing the necessity of thermal tiles during re-entry to manage thermal expansion, she correctly deduced the exact location of the wing damage.
- The February 6, 2003 Test:
- Just five days after the disaster, Dr. Wood incorporated the real-world event into her EM 304 (Mechanics of Materials) exam on February 6, 2003.
- The test required students to calculate stresses, thermal expansion, and the failure temperature for the exposed aluminum substructure.
- To help students grasp concepts like shear stress versus normal stress, she famously used visual aids in her classes, including Roadrunner cartoons (such as the Coyote cutting a circular disk out of a bridge) to teach them how to identify the correct surface area.
- Around half of her students solved it completely, though many initially doubted their calculations because the resulting failure temperature (~205°F) seemed surprisingly low.
- NASA's Timeline to the Same Conclusion:
- It took NASA two months following the disaster (upon analyzing flight-data-recorder equivalent thermocouple data) to officially update and confirm the exact failure location on the wing—matching the conclusion Dr. Wood had already mapped out for her students' exam.
- Other Notable Details:
- "The Disaster Queen": Dr. Wood was known by this nickname for her ability to analyze structural failures and apply them to coursework.
- NASA's Internal Awareness & Cover-Up: She noted that NASA management was aware of the foam strike early on and even discussed launching a "care package" of supplies to the space station that could have been redirected to the shuttle, but chose not to inform the crew of the serious danger. Furthermore, multiple requests by outside groups for spy-satellite imaging of the wing were cancelled by higher-ups.
- Experimental Validation: Months later, Columbia Accident Investigation Board (CAIB) investigator G. Scott Hubbard conducted physical tests—first on a fiberglass rehearsal wing and then on a real shuttle wing—that successfully replicated the exact damage pattern.
CAIB Investigator Scott Hubbard April 15, 2003 presentation confirmed Dr. Judy Wood's analysis
Here is one of the slides from Scott Hubbard's investigation that Dr. Judy Wood included in her test problem PDF that she sent me.
Alternative link: https://govinfo.library.unt.edu/caib/events/press_briefings/20030415/present_hubbard.html

Note the landing gear door, showing the damage shown is to the left wing, exactly where Dr. Judy Wood pointed out.

Note that the above image is erroneously showing the right wing.
Here is a Grok AI explanation for the above chart, since it doesn't come with any text.
This chart shows temperature data from sensors near Reinforced Carbon-Carbon (RCC) Panel 9 on the left wing leading edge of Columbia (STS-107) during re-entry.
It is from G. Scott Hubbard’s April 15, 2003 CAIB presentation. The graph plots temperature (°F) versus seconds from Entry Interface (EI). The two lines correspond to two different sensors in the Panel 9 region (shown in the small diagram at upper right):
- One line (typically the lower/blue-ish trace) is from a sensor that starts colder (around –100 °F).
- The other (red/brown) starts near 0–20 °F.
These are internal sensors (spar and clevis area behind/near the RCC panels), not external surface temperatures. Normal re-entry temperatures for these locations rise only modestly.
What the spike means
Around EI + 480–520 seconds both traces rise sharply. One climbs rapidly past ~200 °F and goes off-scale high (the sensor range tops out around 450 °F), then both drop off-scale low.
This does not mean the vehicle broke up at that instant. Columbia continued flying for several more minutes (loss of signal occurred near EI + 900 s). The spike and subsequent sensor failure indicate that superheated plasma had entered the wing through a breach in the leading-edge thermal protection system and was heating the internal structure and wiring. The sensors (or their wires) were destroyed by the heat—exactly the “wires cut or burned through” behavior Hubbard described in the briefing.
Later CAIB analysis identified the breach as originating near RCC panels 8–9 from the foam strike during ascent. The temperature data were one of the early lines of evidence pointing to heating inside the wing well before breakup.
Judy’s 205 °F annotation
In her exam materials she marks the rising portion of the red trace near 205 °F. That number is the failure temperature she calculated in the exam problem for the aluminum stiffener under constrained thermal expansion (shear failure at the plate connection). She is drawing a direct visual link between the real flight data and the temperature her idealized tube problem predicted would cause structural failure.
In short: the chart shows the moment hot gas entered the wing and began destroying sensors near Panel 9. The spike marks the onset of that internal heating event, not the final breakup, and Judy highlighted the 205 °F level to connect it to her thermal-stress calculation.
Space Shuttle Columbia Disaster
Let's go through the mainstream overview of the Space Shuttle Columbia disaster.
https://en.wikipedia.org/wiki/Space_Shuttle_Columbia_disaster
On February 1, 2003, Space Shuttle Columbia disintegrated as it re-entered the atmosphere over Texas and Louisiana, killing all seven astronauts on board. It was the second of two Space Shuttle missions to end in disaster, after the loss of Challenger and crew in 1986.
The mission, designated STS-107, was the 28th flight for the orbiter and the 113th flight of the Space Shuttle fleet. It was dedicated to research in various fields, mainly on board the SpaceHab module inside the shuttle's payload bay.

During launch, a piece of the insulating foam broke off from the Space Shuttle external tank and struck the thermal protection system tiles on the orbiter's left wing. Similar foam shedding had occurred during previous Space Shuttle launches, causing damage that ranged from minor to near-catastrophic, but some engineers suspected that the damage to Columbia was more serious. When Columbia re-entered the atmosphere of Earth, the damage allowed hot atmospheric gases to penetrate the heat shield and destroy the internal wing structure, which caused the orbiter to become unstable and break apart.

Figure: Columbia prior to launch. The circled area on the external tank (ET) is the left bipod foam ramp, and the circled area on the orbiter is the location that was damaged.


Close-up of the left bipod foam ramp that broke off and damaged the orbiter wing


The crew of STS-107. From left to right: Brown, Husband, Clark, Chawla, Anderson, McCool, Ramon.


Animation: Footage of the debris strike at T+81.9 seconds


84,000+ parts recovered: A grid on the floor is used to organize recovered debris.

The search for Columbia debris ended in May.[17]: 203 Approximately 83,900 pieces of debris were recovered, weighing 84,900 pounds (38,500 kg), which was about 38 percent of the orbiter's overall weight.
Space Shuttle
The Space Shuttle was a partially reusable spacecraft operated by the US National Aeronautics and Space Administration (NASA).[2]: 5, 195 It flew in space for the first time in April 1981,[3]: III-24 and was used to conduct in-orbit research,[3]: III-188 and deploy commercial, military, and scientific payloads.[3]: III-66, 68, 148
The orbiter was protected from heat during re-entry by the thermal protection system (TPS), a thermal soaking protective layer around the orbiter. In contrast with previous US spacecraft, which had used ablative heat shields, the reusability of the orbiter required a multi-use heat shield.[5]: 72–73 During re-entry, the TPS experienced temperatures up to 3,000 °F (1,600 °C), but had to keep the orbiter vehicle's aluminum skin temperature below 350 °F (180 °C). The TPS primarily consisted of four sub-systems. The nose cone and leading edges of the wings experienced temperatures above 2,300 °F (1,300 °C), and were protected by the composite material reinforced carbon–carbon (RCC). Thicker RCC was developed and installed in 1998 to prevent damage from micrometeoroid and orbital debris.[3]: II-112–113 The entire underside of the orbiter vehicle, as well as the other hottest surfaces, were protected with black high-temperature reusable surface insulation. Areas on the upper parts of the orbiter vehicle were covered with white low-temperature reusable surface insulation, which provided protection at temperatures below 1,200 °F (650 °C). The payload bay doors and parts of the upper wing surfaces were covered with reusable felt surface insulation, as the temperature there remained below 700 °F (370 °C).[4]: 395
When the Space Shuttle launched, the orbiter and SRBs were connected to the ET, which held the fuel for the SSMEs.[4]: II-222 The ET consisted of a tank for liquid hydrogen (LH2), stored at −423 °F (−253 °C) and a smaller tank for liquid oxygen (LOX), stored at −297 °F (−183 °C). It was covered in insulating foam to keep the liquids cold and prevent ice forming on the tank's exterior. The orbiter connected to the ET via two umbilicals near its bottom and a bipod near its top section.[6]: 50–51 After its fuel had been expended, the ET separated from the orbiter and reentered the atmosphere, where it would break apart during re-entry and its pieces would land in the Indian or Pacific Ocean.[4]: II-238
Launch and debris strike
Columbia was launched from the Kennedy Space Center Launch Complex 39A (LC-39A) on January 16, 2003 at 10:39:00 am. At T+81.7 seconds, a piece of foam approximately 21 to 27 inches (53 to 69 cm) long and 12 to 18 inches (30 to 46 cm) wide broke off from the left bipod on the ET. At T+81.9 seconds, the foam struck the reinforced carbon–carbon (RCC) panels on Columbia's left wing at relative velocity of 625 to 840 feet per second (426 to 573 mph; 686 to 922 km/h).[6]: 34 The foam's low ballistic coefficient caused it to lose speed immediately after separating from the ET, and the orbiter ran into the slower foam.[6]: 60 Neither the mission nor ground crew noticed the debris strike at the time.[6]: 140 The SRBs separated from the ET at T+2 minutes and 7 seconds, followed by the ET's separation from the orbiter at T+8 minutes 30 seconds.[6]: 35 The ET separation was photographed by Anderson and recorded by Brown, but they did not record the bipod with missing foam.[6]: 148 At T+43 minutes, Columbia completed its orbital insertion as planned.[6]: 35
Cause of the accident
After looking at sensor data, the CAIB considered damage to the left wing as a likely culprit for Columbia's destruction. An investigation studied recovered debris and noted the difference in heat damage between the two wings. RCC panels from the left wing were found in the western portion of the debris field, indicating that it was shed first before the rest of the orbiter disintegrated.[6]: 73–74 X-ray and chemical analysis was conducted on the RCC panels, revealing the highest levels of slag deposits to be in the left wing tiles.[6]: 75–76 Impact testing was conducted at the Southwest Research Institute, using a nitrogen-powered gun to fire a projectile made of the same material as the ET bipod foam. Panels taken from Enterprise, Discovery, and Atlantis were used to determine the projectiles' effect on RCC panels.[6]: 79–80 A test on RCC panel 8, taken from Atlantis, was the most consistent with the damage observed on Columbia, indicating it was the damaged panel that led to the in-flight breakup.[6]: 82–83
Columbia Accident Investigation Board
About ninety minutes after the disaster, NASA Administrator Sean O'Keefe called to convene the Columbia Accident Investigation Board (CAIB) to determine the cause.[6]: 231 [33] It was chaired by retired US Navy Admiral Harold W. Gehman, Jr. and included military and civilian analysts. It initially consisted of 8 members, including Gehman, but expanded to 13 members by March. The CAIB members were notified by noon on the day of the accident, and participated in a teleconference that evening. The following day, they traveled to Barksdale AFB to begin the investigation. The CAIB members first toured the debris fields, and then established their operations at JSC. The CAIB established four teams to investigate NASA management and program safety, NASA training and crew operations, the technical aspects of the disaster, and how NASA culture affected the Space Shuttle program. These groups collaborated, and hired other support staff to investigate.[6]: 231–232 The CAIB worked alongside the reconstruction efforts to determine the cause of the accident, and interviewed members of the Space Shuttle program, including those who had been involved with STS-107.[6]: 234–235 The CAIB conducted public hearings from March until June,[6]: 237–238 and released its final report in August 2003.[6]: 2

Animation: Mock-up of an orbiter's wing's leading edge made with an RCC-panel taken from Atlantis. Simulation of known and possible conditions of the foam impact on Columbia's final launch showed brittle fracture of RCC (reinforced carbon-carbon is a composite material consisting of carbon fiber reinforced in a matrix of graphite (crystalline form of the element carbon).


Here is a video of the foam strike test too:

CNN Anchor Judy Woodruff transcript of CNN's February 6, 2003 Live Columbia Memorial
Coincidently (and synchronistically), CNN aired a live special event on February 6, 2003, the same day as Dr. Judy Wood's test, of a memorial for the Columbia astronauts. The transcript of the programmed was rushed to completion by… CNN Anchor Judy Woodruff! 🤯

Here is news footage of the Columbia disaster, note again that almost 40% of the Space Shuttle was recovered!!


Grok AI List of Controversies Surrounding the Disaster
Here is a Grok AI list of controversies surrounding the Space Shuttle Columbia disaster.
Note that nearly all mainstream artificial intelligence (AI) models are biased towards the mainstream or "official" narrative, so keep that in mind.
If you have any information that AI gets wrong or leaves out, let me know!
https://grok.com/share/c2hhcmQtMg_4766b37c-cfd8-4dea-897f-42a2e51d1568
Here is a factual list of the documented controversies, management failures, known risks, and missed opportunities related to the Space Shuttle Columbia (STS-107) disaster.
These are drawn primarily from the official Columbia Accident Investigation Board (CAIB) report, contemporary news reporting, and released internal NASA emails and documents. The physical cause was a foam strike during ascent that breached the left-wing leading-edge Reinforced Carbon-Carbon (RCC) panels; superheated plasma entered during re-entry. The CAIB concluded that NASA’s organizational culture was as much a cause as the foam itself.
Known Foam-Shedding Problem and Normalization of Deviance
- Foam loss from the External Tank occurred on more than 80% of missions for which imagery was available. It was a chronic, known issue.
- NASA had repeatedly treated foam strikes as a maintenance/turnaround problem rather than a potential safety-of-flight risk. Requirements that debris strikes not damage the thermal protection system were routinely waived.
- A significant foam strike on Atlantis (STS-112) just months earlier was classified as an “action” item rather than a more serious in-flight anomaly that would have required resolution before the next flight. Schedule pressure (including ISS construction goals) contributed to this decision.
- The CAIB described this as classic “normalization of deviance”: each successful flight with foam strikes was taken as evidence that the risk was acceptable.
Imagery Requests for Damage Assessment Were Not Obtained
- During the mission, multiple engineers (including Rodney Rocha of the Debris Assessment Team) requested higher-resolution imagery of the left wing using Department of Defense assets (spy satellites or ground telescopes).
- Rocha wrote that without better images it would be “very difficult to even bound the problem” and asked colleagues whether they could “petition (beg)” for outside agency assistance.
- Requests were blocked or not acted upon. Mission Management Team chair Linda Ham’s actions and communications contributed to the cancellation of at least one request. Associate Administrator William Readdy later stated he declined to make an “emergency” request for satellite imagery after engineers had already concluded there was no safety-of-flight issue, though he said non-interfering imaging could proceed (it did not).
- The CAIB identified this as one of several missed opportunities. Managers viewed the requests as non-critical engineering desires rather than operational needs. The crew and senior decision-makers never received definitive visual confirmation of the damage extent.
- Post-accident, NASA arranged for routine military imaging of orbiting shuttles.
Internal Engineering Concerns and Incomplete Communication
- Engineers (including Robert Daugherty at Langley and others) exchanged emails discussing possible catastrophic scenarios from the foam strike, including damage near the wheel well, tire failure, or structural breach leading to loss of vehicle and crew. Some used language such as “world of hurt” or described worst-case outcomes.
- These concerns largely remained at the mid-level engineering level. They were not effectively escalated into a formal safety-of-flight challenge that altered the Mission Management Team’s conclusions.
- A Boeing analysis (using a tool primarily calibrated for smaller tile impacts) concluded the strike was not a safety concern. Management accepted this analysis. The actual damage was to the RCC leading edge, outside the primary assumptions of that tool.
- The crew was informed via email that there was “absolutely no concern” for RCC or tile damage and that the issue was “not even worth mentioning” except to avoid being surprised by reporter questions. They were not told of the ongoing internal debate among some engineers.
Organizational and Cultural Factors (CAIB Findings)
- The CAIB stated that “the NASA organizational culture had as much to do with this accident as the foam.”
- Key issues included: inverted burden of proof (prove the strike was unsafe rather than prove it was safe), communication barriers and informal processes that diluted urgency, schedule pressure, resource constraints, and a history of treating the Shuttle as operational rather than developmental.
- Similar cultural issues had been identified after Challenger; the CAIB noted that lessons had atrophied.
- There were at least eight identified missed opportunities during the flight to better understand the damage.
Media and Public Perception Notes
- Landing-day weather at Kennedy Space Center was excellent (clear conditions after morning fog burned off). Contemporary accounts described it as near-perfect weather for the scheduled touchdown. Re-entries were not normally major news events, but STS-107 received elevated attention in part because it carried the first Israeli astronaut (Ilan Ramon) and a large suite of science experiments.
- I did not locate a specific major newspaper headline with the exact phrasing “A perfect day for a perfect mission.” Coverage commonly described the mission as appearing successful and the weather as favorable until contact was lost.
What Was Not the Case
- There is no credible evidence in the official investigation or contemporaneous reporting of deliberate sabotage, intentional withholding of a known fatal breach, or a decision to fly despite confirmed knowledge that the vehicle would be lost. The core failures were cultural, analytical, and communicative: a known foam risk was underestimated, damage-assessment tools were insufficient for the actual strike, and requests for better data were not pursued vigorously enough under the belief that the strike was not a safety-of-flight issue and that little could be done in any case.
The CAIB report (especially Volume I) remains the primary authoritative source for these points. Many of the internal emails were released via FOIA or during the investigation and are publicly available.
You can check out this post and your own profile on the map. Be part of the Worldmappin Community and join our Discord Channel to get in touch with other travelers, ask questions or just be updated on our latest features.