OPENHAB in PILLOLE: 43. CHART PAGE Part 2 - Grafici sempre più belli su OPENHAB / Let's make CHARTS better on OPENHAB

New video of the OPENHAB in a NUTSHELL series.
Let's go deeper in the CHARTS PAGE, after having introduced the main features in the previous video.
Let's see how to create aggregated charts to obtain values calculated according to the chosen unit of time, such as the daily average of photovoltaic production.
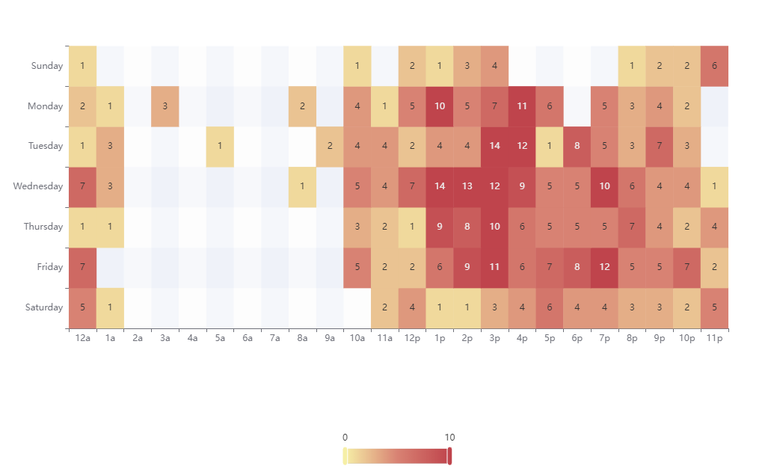
I also introduce the CALENDAR coordinate type to display the aggregated data in a CALENDAR-style page, using the HEATMAP chart type as an example.
Finally, I add to an existing graph all the secondary objects that OPENHAB makes available, to allow the user to zoom easily, change the chart type with a click and export the page as an image.
Enjoy the video
Nuovo video della serie OPENHAB in PILLOLE.
Continuo l'approfondimento della CHARTS PAGE, dopo aver introdotto le funzionalità principali nel video precedente.
Andiamo a vedere come creare dei grafici aggregati per ottenere dei valori calcolati in funzione dell'unità di tempo scelta, come ad esempio la media giornaliero di produzione fotovoltaica.
Introduco anche la tipologia di coordinate CALENDARIO per visualizzare i dati aggregati in una pagina in stile CALENDARIO, utilizzando il tipo di grafico HEATMAP come esempio.
Per ultimo, aggiungo ad un grafico già esistente tutti gli oggetti secondari che OPENHAB mette a disposizione, per permettere all'utente di effettuare zoom in maniera semplice, cambiare tipo di grafico con un click ed esportare la pagina sottoforma di immagine.
Buona visione
