Pandas DataFrame

In the last post, I gave a brief introduction to pandas library and one of its main data structure which is series. In this post, I am going to briefly talk about another data structure which is DataFrames. DataFrame is used to store data in two dimensional form, or in another word-tabular form in terms of rows and columns. Rows are used to store the information while columns are used to label the information. DataFrame can also be said as a collection of series as I discussed in my previous post. There are many things you can do with pandas dataframes like manipulating the data which includes indexing, merging, sorting, redefining the data like modifying, adding or deleting rows/column, cleaning and preparing the data by filling the null or NaN values, and so on.
Dataframe makes it easier for data to be used for visualization and analysis purposes. And the best things about pandas is that it supports most of the file extensions type like JSON, plain text, CSV and so on. Here we will do some coding related to DataFrame. The syntax for creating a DataFrame is quite similar to that of series. We will create a weather dataframe that contains 5 data about date, city, temperature, humidity and precipitation value for particular US cities.
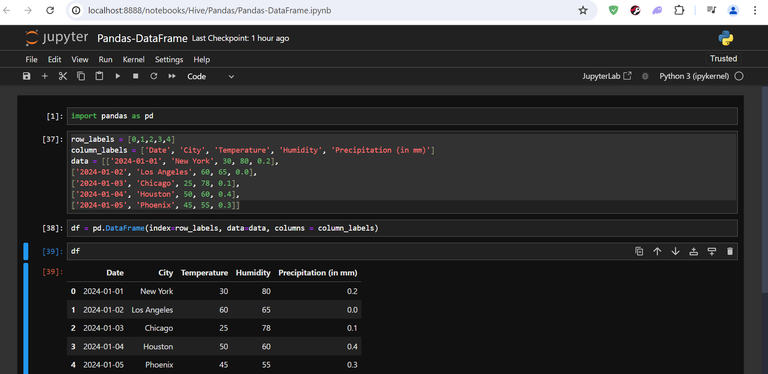
import pandas as pd

row_labels = [0,1,2,3,4]
column_labels = ['Date', 'City', 'Temperature', 'Humidity', 'Precipitation (in mm)']
data = [['2024-01-01', 'New York', 30, 80, 0.2],
['2024-01-02', 'Los Angeles', 60, 65, 0.0],
['2024-01-03', 'Chicago', 25, 78, 0.1],
['2024-01-04', 'Houston', 50, 60, 0.4],
['2024-01-05', 'Phoenix', 45, 55, 0.3]]

df = pd.DataFrame(index=row_labels, data=data, columns = column_labels)

df
So you may have seen above at first we imported pandas library and then define labels for column and rows. Then we filled the data for each of the 5 columns for 5 US cities. Then we used DataFrame function to create a dataframe which takes some argument like index itself, the row, columns and the data. There is an optional argument that you can pass here which is a datatype (dtype). Now lets see the output in tabular format.
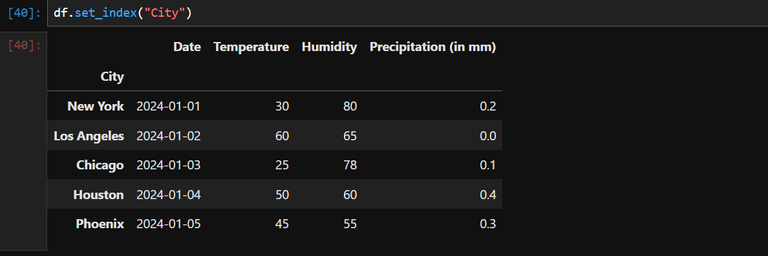
For the data, you can pass it any format like you want. I had passed the data in nested list form but you can pass set, tuple as you like and it will still return the same result. Now, you can see the index to be 0 till 5. I want the city to be index. We can do it by:
df.set_index("City")
If you run the above code, you will get following output:
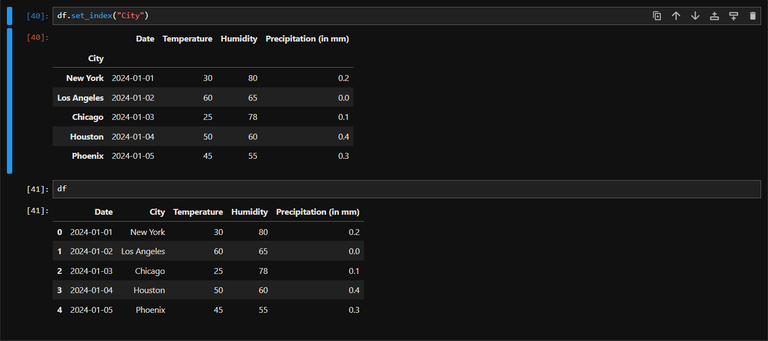
Note that specifying index like this won't change the original dataframe with city being the index. If you print your dataframe after doing this, you will get the original dataframe like below:
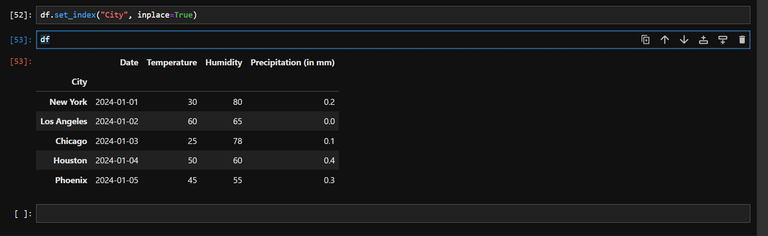
In order to actually apply the change to the original dataframe there is optional argument that you can pass to set_index() function which is as below:
df.set_index("City", inplace=True)

df
Now you can see your desired output like below:
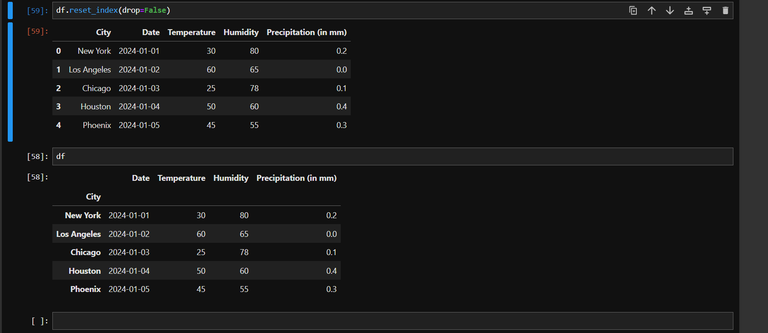
by default inplace value is set to false. There is also other optional argument called drop which is by default set to True. When you set it to False, then the City label will stay there as it was previously and as an index as well. You can reset the index by using reset_index method as below:
df.reset_index(drop=False)
If you don't set drop=False then city will be dropped and we won't get back our original dataframe. The output of above code is:
So that's all for now regarding basic of pandas dataframe. From next post, we will talk about reading CSV files using pandas and further posts will discuss about manipulating data using pandas library.
Thanks for your contribution to the STEMsocial community. Feel free to join us on discord to get to know the rest of us!
Please consider delegating to the @stemsocial account (85% of the curation rewards are returned).
Thanks for including @stemsocial as a beneficiary, which gives you stronger support.
it is good example of how do tables with python but it is better sql :D
Both of them excel at their own purpose. SQL is better used for extracting and filtering while pandas is better used for manipulation.