CSV File Handling With Pandas

Hello amazing bloggers out there. In this third series of Pandas tutorial post, I will be showing you how to select and index data from a CSV files using Pandas library. CSV (Comma-separated Value) files are one of the popular file extension to work with pandas for data storage and manipulation. It allows plain text file to be stored in tabular form. We will be working with a real-world dataset from Kaggle. The name of this dataset is "Titanic extended dataset (Kaggle + Wikipedia)" by Pavlo Fesenko, and you can download the dataset from here.
Talking about the Titanic dataset, it is one of the popular dataset used for educational purposes and also for beginners who want to begin their career in data science or machine learning. The dataset contains information of the passengers onboard the famous titanic ship and their survival status. The dataset we are working is an extension and improved version of the original Titanic dataset. The dataset had extensively been used for machine learning projects like predicting the survival status of passengers based on multiple factors using various algorithms like KNN, regression analysis and so on. With that being said, in order to build and evaluate such model, the primary tasks is to make sure that the data is right, free of inconsistencies and any errors. And, pandas help to a great extent to prepare data for such purposes.
I am assuming you have downloaded the dataset. You will need to register using one of your social media accounts or email to download the dataset. After you have downloaded the dataset, you will need to extract the dataset into the directory where you want to work, and that directory is also the path where your main python file is.
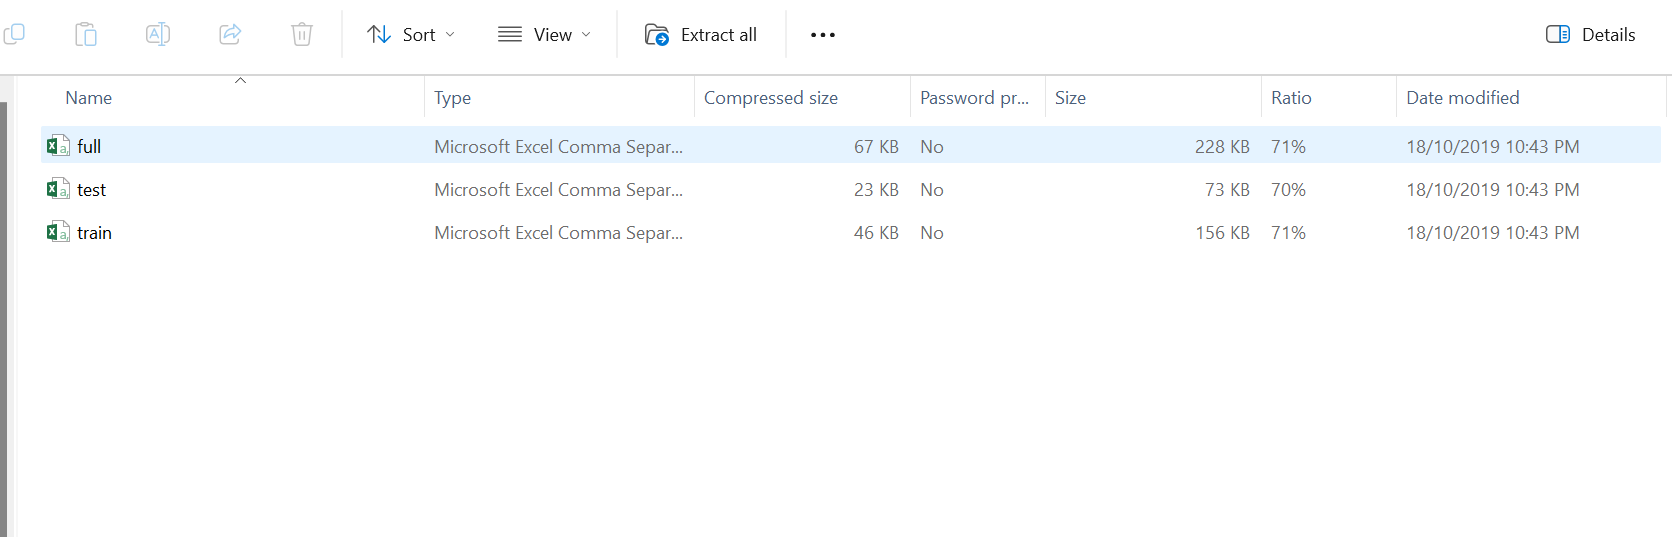
I have downloaded the dataset and after extracting I can see that there are three files. The file we will be working with is full.csv. I will upload that file to Jupyter Notebook and will rename the file from full.csv to titanic.csv. This is what my directory structure looks like:
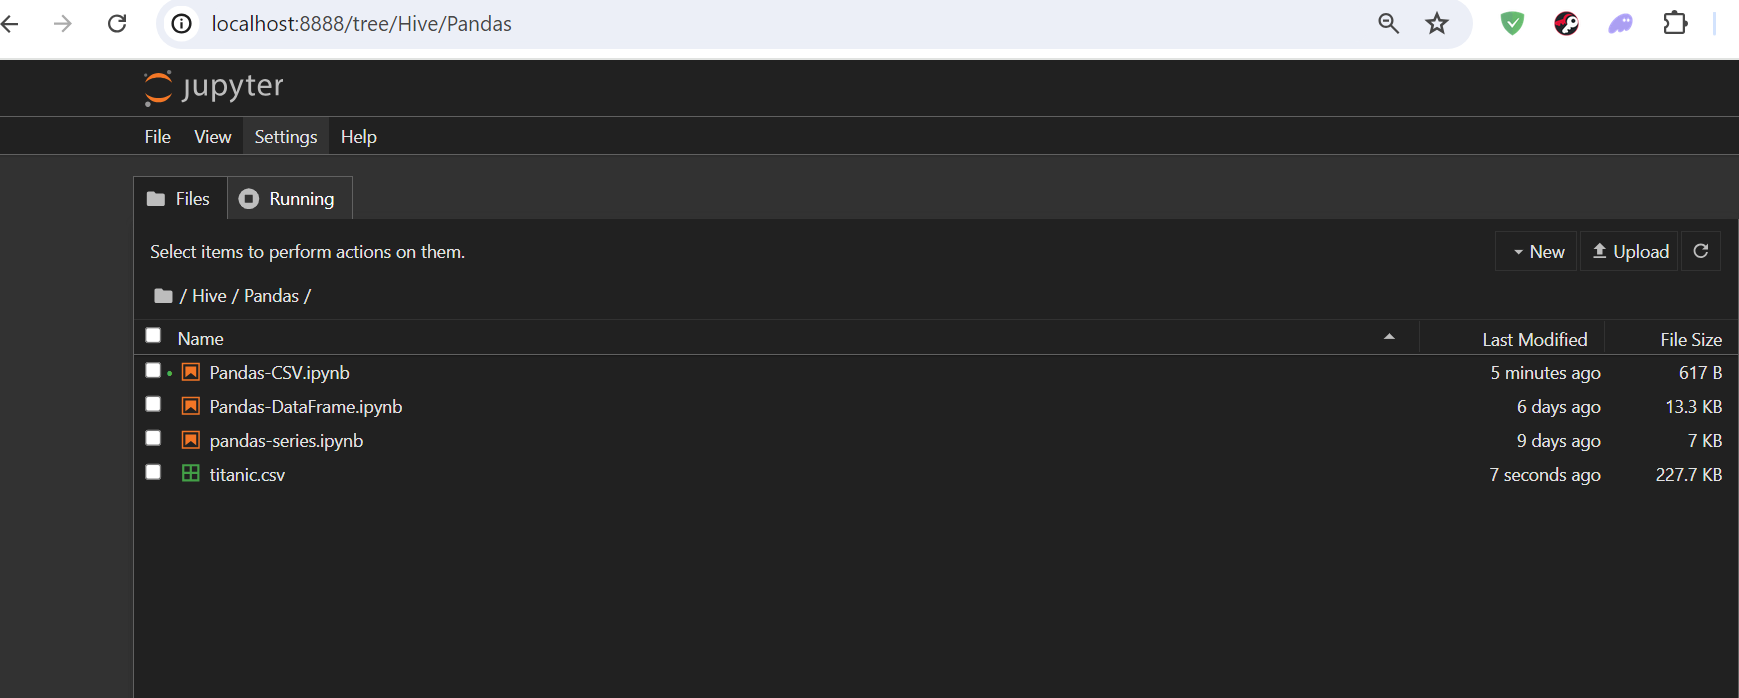
For this post I am working with Pandas-CSV.ipynb and the dataset titanic.csv which is in the same path. And working with this type of path is called "absolute path". You can also do by using relative path method.
The function read_csv() is used to load csv files into the pandas dataframe.
import pandas as pd

titanic_data = pd.read_csv('titanic.csv')

titanic_data
This is how the output will appear in your console:
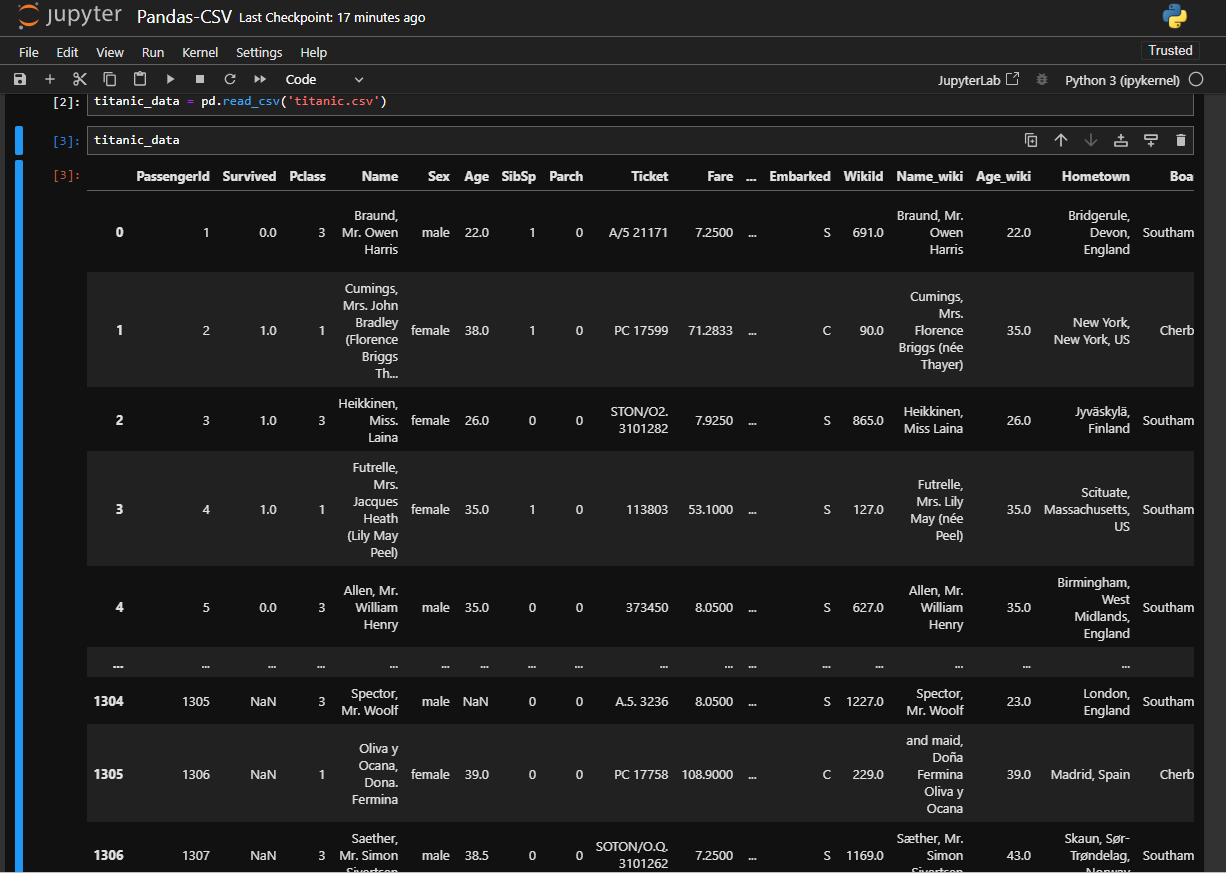
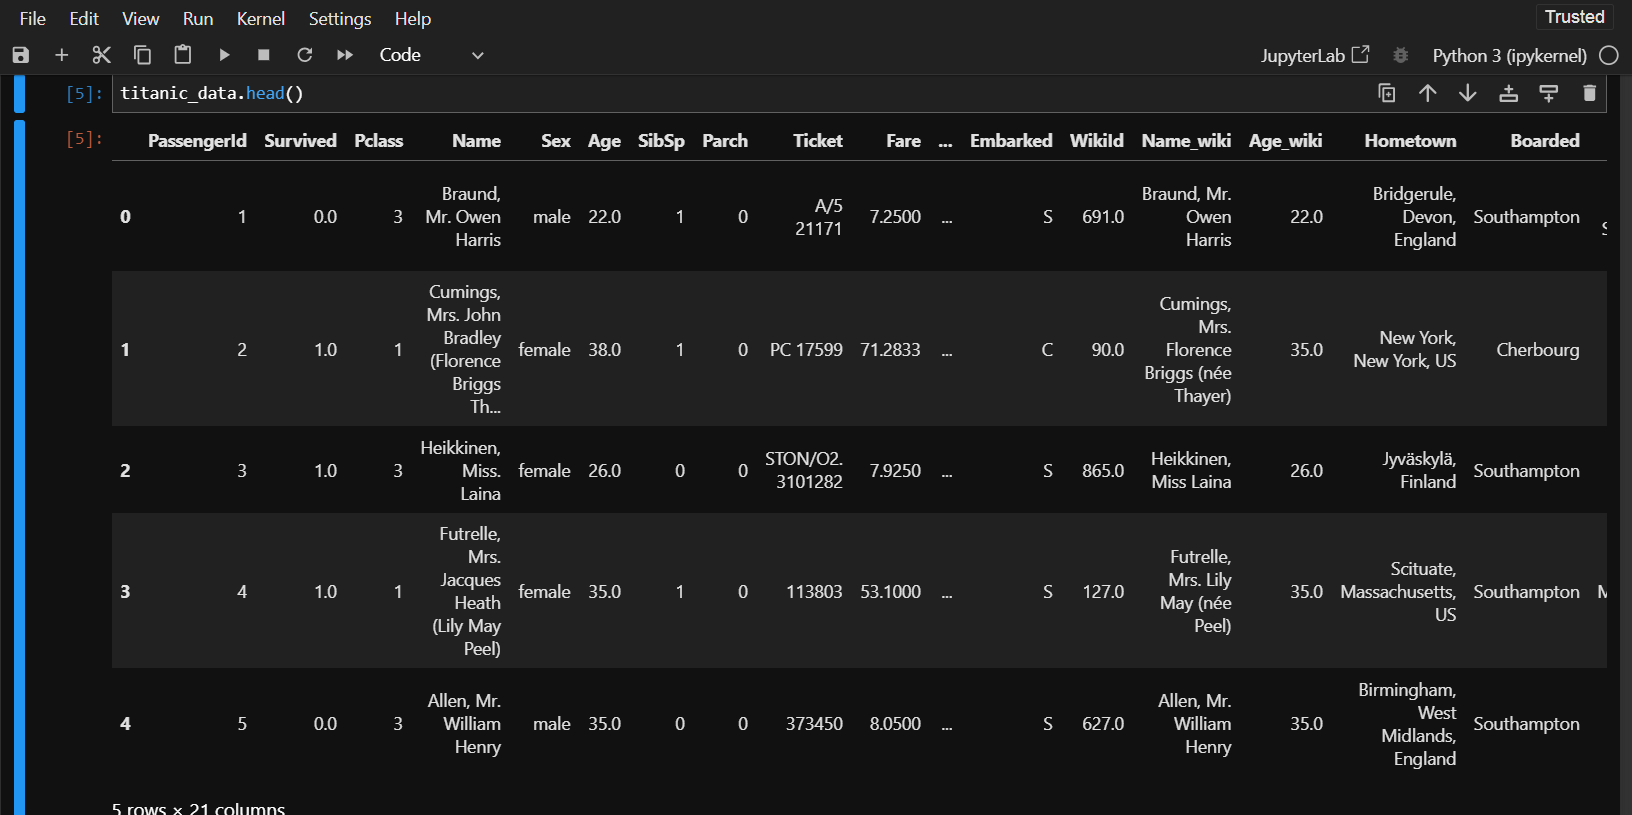
One thing for sure-from the above output you can see the dataframe contains 1309 rows and 21 columns. At a first glace, you will get confused by seeing so much data in table. We will inspect the first few rows to get better understanding of the dataframe. For this we will use titanic_data.head() function that will display only the first five rows of the dataframe.
In the same way, you can use tail() function to display the last five rows of the dataframe.
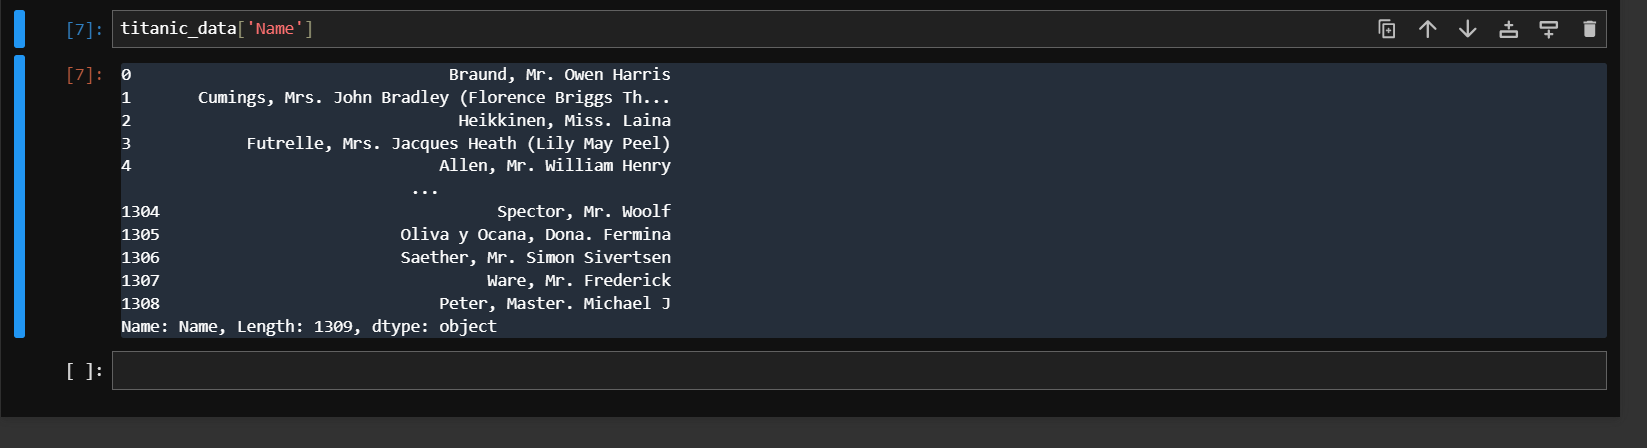
Now lets try to select a single column from our dataframe. We will select "Name" column for this purpose. To do this we need to first write the dataframe name and inside the square brackets, we need to type the name of that column. Make sure since we are passing the characters inside the brackets, you need to enclosed that within single comma or double quote as:
titanic_data['Name']
You will get the following output for this code:
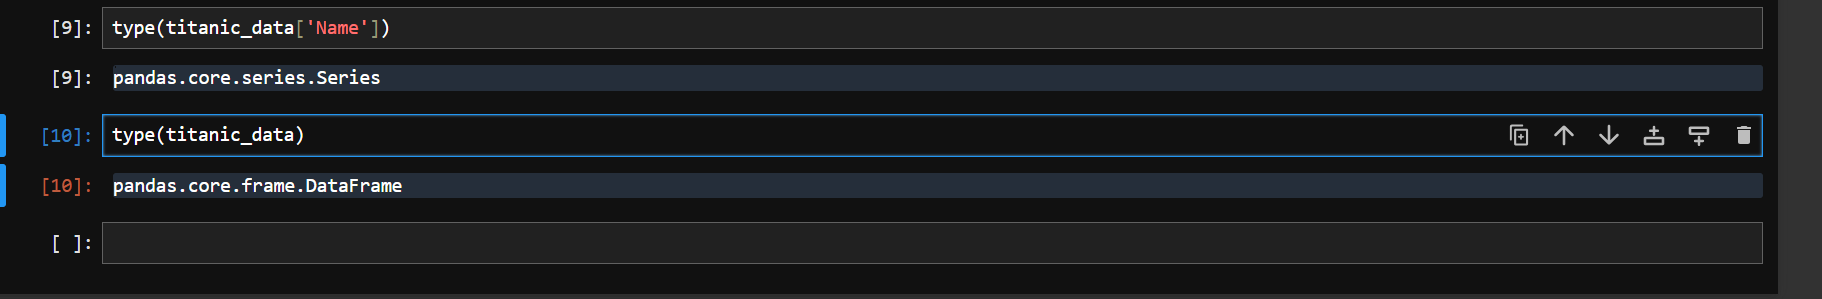
Remember in my previous two posts, I mentioned DataFrame as a collection of series. I will show you here why it called so. If you check the datatype of single column you selected above, it will show as series since it is one dimensional. The type of titanic data that we loaded is a dataframe.
type(titanic_data['Name'])

type(titanic_data)
See the output for your reference:
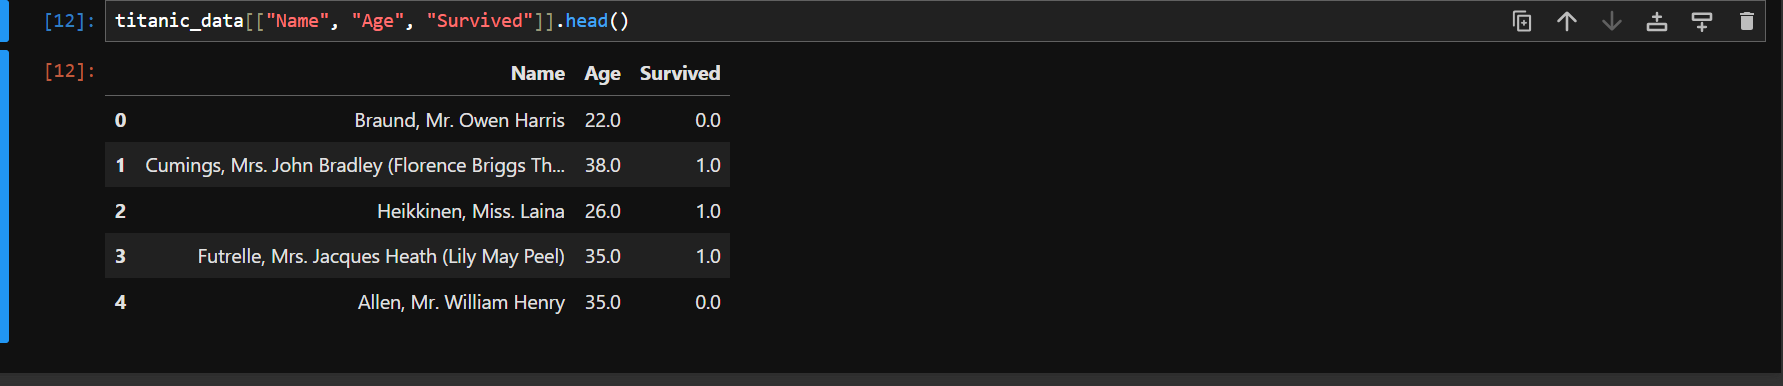
So when you go on adding one or more series then it will be a dataframe. Now lets see on selecting multiple columns. The syntax is same as before, the only difference is that you will need to pass a nested list in order to select multiple columns from a dataframe. Lets see we want to see the first five data that shows name, age and survival status.
titanic_data[["Name", "Age", "Survived"]].head()
You can see the output for yourself. Value 0 means false i.e. the passengers didn't survive and value 1 means true i.e. the passenger survived.
I am assuming that the post is getting lengthier and it will be time-consuming and confusing to read if I include everything in the same post. We will see other things we can do to CSV files in pandas in my other posts. Stay tuned for a while!!
Previous Pandas Tutorial Post
Thanks for your contribution to the STEMsocial community. Feel free to join us on discord to get to know the rest of us!
Please consider delegating to the @stemsocial account (85% of the curation rewards are returned).
Thanks for including @stemsocial as a beneficiary, which gives you stronger support.